
Footnotes & Flashbacks: Asset Returns 7-28-24
Another week of big events with a new pairing for the White House faceoff (or glove dropping) sees some shifting market dynamics.


J.D., you have issues…and stay off my couch.
After two weeks of an assassination attempt, an LBJ-style Biden withdrawal, an extremist GOP convention, and a slew of new data for the FOMC to chew on, we can now get back to serious issues like why JD Vance does not like cats.
For the past week, tech equities were slammed, small caps rallied, and the Equal Weight S&P outperformed the large cap benchmarks.
This coming week brings critical jobs data (JOLTS and payroll), an FOMC meeting to throw some more data on the scale weighing Fed easing expectations, and a fresh read from the market on what it might mean further out the UST curve.
As the timeline to election narrows, the asset returns might start seeing some “policy creep risk” enter the picture outside the narrow debate on the UST curve shape as conceptually inconsistent policy statements raise some risk factors that are not being coherently addressed in the political noise.

The pullback in equities this past week is something we cover below in the time horizon reconciliation of our 32 ETFs/benchmarks. The above chart covers the main high level debt and equity benchmarks we look at each week, and the news has been tough for tech and large cap benchmarks with the S&P 500 now in the red for the trailing month along with the NASDAQ.
The Russell 2000 has been rocking as part of the sector rotation theme in a move reminiscent of Dec 2023 when most of the year’s returns were generated in a matter of weeks (see Footnotes & Flashbacks: Asset Returns 1-1-24). The small caps have a high representation of regional banks in the mix and some other interest sensitive industry groups that have been rallying.
The hopes and dreams of bank equity holders ride on most banks avoiding outsized real estate problems and seeing interest margins improve on lower deposit rates in the year ahead. The regional bank optimism has been showing up in Small Cap benchmarks as well as the Regional Bank ETF (KRE). We look at those numbers in the ETF section with KRE now #1 in returns over 1-week, 1-month, and 3-months horizons.
Recent times have been friendlier to the bond market with the above debt benchmarks all positive for the 1-month period (and 3-months, 6-months, and 1-year). As we detail below, the 7 bond ETFs we cover each week (AGG, SHY, GOVT, TLT, LQD, HYG, EMB) were all positive for the week and the month as the UST curve has been supportive. Spreads also offered an assist in HYG for the past month and YTD.
When does policy planning start to factor into pricing?
With respect to the inconsistent policy promises coming out of the GOP convention and Trump’s daily ramblings and thoughts of the moment, we would check off a few that are pretty hard to digest, let alone reconcile with each other.
Inflation and supplier chains: Trump is promising to raise tariffs and weaken the dollar to support trade. The 20% border adjustment tax (“BAT” tax) proposed by the Ryan/Brady tag team in 2017 (which was laughed out of the Senate by the GOP and not even taken up) assumed a material strengthening in the dollar to mitigate the costs of the tariffs paid by the buyer (Trump still thinks he collected “billions and billions” from the Chinese. He did not. Buyer pays. Ryan and Brady knew that).
The whole issue of facts and conceptual relationships remain a challenge in interpreting the Trumpian economic platform. We spent some time this weekend documenting the performance of the “Trump economy” with an easy comparison to the “Clinton economy” (see Presidential GDP Dance Off: Clinton vs. Trump 7-27-24) and to the “Reagan economy” (see Presidential GDP Dance Off: Reagan vs. Trump 7-27-24). Both periods of the 1980s and 1990s crush Trump’s 4 years that he calls the “greatest economy in history.” No objective person will mistake Trump for a master of economics and math. That said, deciphering if “this number is higher than that number” is not Laureate material.
Clinton and Reagan oversaw economies that were leaps and bounds stronger than the one Trump term. He has to admit that before you take anything Trump says as rooted in fact. We also detailed the GDP of the Biden years across headline GDP and the layers of PCE and fixed investment and state and local government spending (see GDP 2Q24: Banking a Strong Quarter for Election Season 7-25-24). Biden’s numbers are modestly higher but also nowhere near Clinton or Reagan. The idea that you can turn on the growth jets in the post-2000 economy while eliminating massive deficits is as believable as some of the factually absurd statements on the performance of his single term economy.
Labor costs, wages, and lower inflation: Trump is also promising to deport as many as 20 million people while essentially implying we can do that while avoiding a wage-price spiral from the lower paid services sector. Even if in the areas of what he calls “Black Jobs” and “Hispanic jobs” (there are high numbers of structurally underemployed white people that just call them “Jobs” - not “White jobs”), the potential for shortages will be high, and there is no frictionless wheel. What Kamala should throw at him is the need for a sharp increase in minimum wage. That would be interesting to see his response since he is so worried about the waitresses and tips, etc.
You can easily find third party economic studies online around what such a mass deportation plan might mean for fallout. Currently, there is no “plan” on costs, logistics, secondary effects of labor supply or a remote attempt to do any regional analysis. The absence of facts, concepts and a plan make one think back to the mysterious Obamacare “repeal and replace” legislation where the “replace” never materialized. John McCain’s thumb saved healthcare for many households.
Trump wanted to lead with repeal back in 2017 – but he had no plan. There is still no plan in healthcare and there is no economic analysis and logistical planning of the mass deportation. There is a set of ideas from the Project 2025 huns, but Trump claims he does not know them. In the end, the mass deportation will be expensive, inflationary and dilutive to employers. There will be chaos in cities and soaring costs for local law enforcement.
How much will it cost? How will it be administered? (Stephen Miller as “Mass Deportation Czar”?). Where does the military fit into the picture? Which industries and regions will be more affected? Has there been any discussion with Mexican leadership (after all Trump spends a lot of time with Orban. Will Orban take 10 million to be a good guy? Who pays for the travel?).
Growth will pay for itself and reduce the deficit: Trump will cut taxes and lower interest rates via White House control of the FOMC. His pitch is that the growth rate will be such a winning formula that the UST debt will be reduced. That involves a balanced budget and surplus with tax cuts. How does that work? Supply-demand for bonds is not a worry in his world on market clearing.
The attempt to develop a “BRICS” currency (nations such as China, Russia, Saudis, South Africa, Brazil, and more) and a digital payment system outside the SWIFT mechanism is a “whole lotta complicated,” but the obvious question is whether such plans will keep China and the Saudis (and Mideast me-too followers) buying UST bonds hand over fist. Or will UST demand slide out of fear of the de-dollarization trends hurting the market and advertising a weaker dollar plan in advance. Hearing Trump answer any question on the topic would be downright entertaining (or frightening).
That dollar vs. BRICS currency is a topic for another day, but it seems designed to avoid sanctions risk. That tells you what the world can expect in geopolitics ahead, i.e., trouble. It all begs a lot of questions for those designing plans based on “have my cake and eat it too” policy assumptions. If they can’t figure out which economy did well (“greatest in history,” etc.) and which programs did not work and ignore facts on trade and budget deficits, that will be a process that does not gain a lot of market confidence.
The reality may be that the US trade policies will undermine corporate earnings and the demand side with tariffs, but you can still promise high growth? How? There is a very real risk that companies and government execution will struggle. The Project 2025 plan is to gut the state apparatus of experienced people for “like-minded” hires. The idea is that will not cause disruptions in services? The “plan” (not really a plan at all) might not work out as written down on a fact-free and concept-free whiteboard.

The above chart updates the 1500 and 3000 series, and we see Growth taking a beating this month while Financials have come roaring back alongside good numbers in Industrials and Value stocks. Interest-sensitive industries (notably Real Estate) are also back in action on UST curve optimism.
The rolling return visual
In the next section we get into the details of the 32 ETFs and benchmarks for the usual trailing periods. Below we offer a condensed 4-chart view for an easy visual before we break out each time period in the commentary further below. This is a useful exercise we do each week looking for signals across industry groups and asset classes.

The above chart shows a more favorable shift towards the positive side for the 1-week time horizon but was fairly consistent in shape with last week in 1-month, 3-month, and LTM as we cover below. Not all line items are created equal of course, and the tech battering and NASDAQ weakness do lead the headlines and especially with earnings teed up for this week with MSFT, META, AAPL, and AMZN.
The Magnificent 7 heavy ETFs…
Some of the benchmarks and industry ETFs we include have issuer concentration elements that leave them wagged by a few names. When looking across some of the bellwether industry and subsector ETFs in the rankings, it is good to keep in mind which narrow ETFs (vs. broad market benchmarks) get wagged more by the “Magnificent 7” including Consumer Discretionary (XLY) with Amazon and Tesla, Tech (XLK) with Microsoft, Apple, and NVIDIA, and Communications Services (XLC) with Alphabet and Meta.
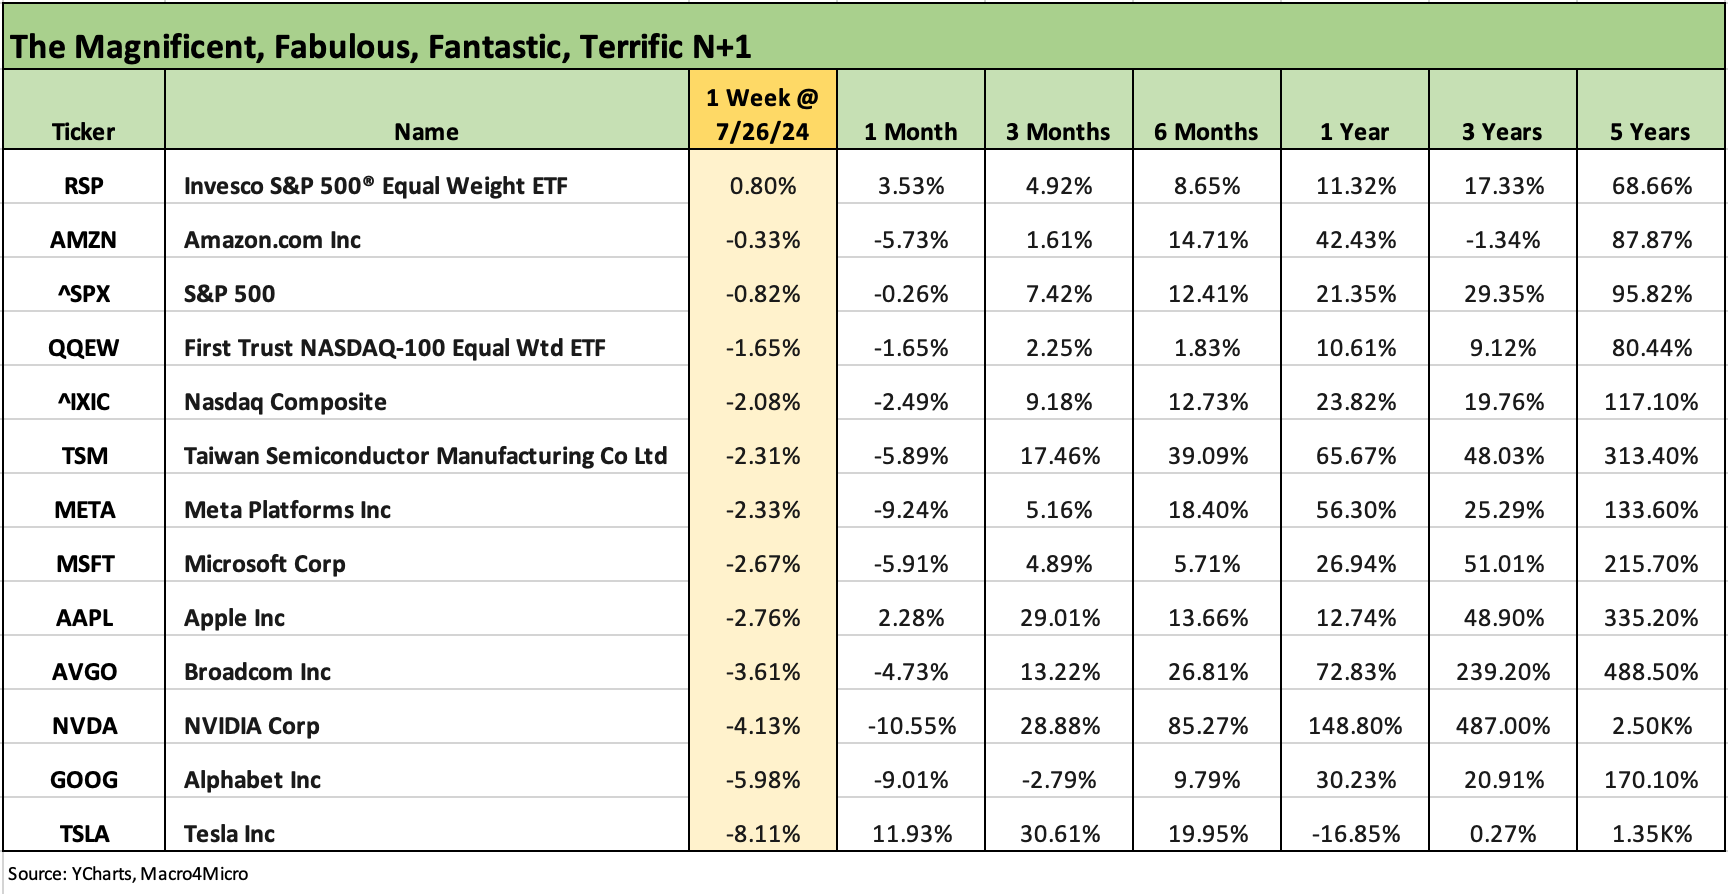
The above chart updates the Magnificent 7 plus a number of other tech bellwethers across the last week and various trailing time horizons. All the tech names in the table posted negative returns on the week and dragged down the broad benchmarks and broad ETFs (QQEW) with them. Notably, the Equal Weight S&P 500 outperformed and ended the week in positive range.
Tesla was a big disappointment and Alphabet sold off on earnings also. This week we have earnings from MSFT, META, AAPL and AMZN even as the FOMC weighs in and Payroll numbers come out.

The 1-week returns across the group of 32 tell a story of breadth in terms of the sector rotation themes but perhaps the wrong kind of breadth with the tech benchmarks and Mag 7 heavy ETFs posting negative returns. We see a score of 21-11 this week after last week posted only 11 in positive range.
We see all 7 bond ETFs in positive range and the top quartile led by some interest rate sensitive sectors with Regional Banks (KRE) at #1 followed by Homebuilders (XHB) at #2. The long duration 20+ Year ETF (TLT) barely made it across the line into positive range on a mildly favorable UST shift. We cover the UST action in our separate Footnotes publication on yields that we will post later.
The daily headlines of “sector rotation” show the Small Cap Russell 2000 at #3 and Midcaps at #4. The fact that regional banks and numerous builder/supplier names show up in Small Caps and Midcap indexes is not a coincidence and especially for the long tail of banks.
Base Metals (DBB) bring up the rear after a period of excess on the metals side, but the bulk of the bottom quartile is about the tech sell-off across the array of ETFs (XLK, QQEW, XLY, XLC) and benchmarks in or near the bottom quartile (NASDAQ, S&P 500).

The 1-month mix of winners and losers shifted slightly toward the negative side this week at 24-8 vs. 26-6 last week. We see 6 of the 8 with a Mag 7 heavy flavor but with Base Metals (DBB) on the bottom and the E&P ETF (XOP) very slightly in the red.
We see all the bond ETFs in positive range with HYG the winner in that group as the risky credit cycle has been resilient. We saw the HY index (ICE) this past week creep closer to the magic 300 bps line that would have put the HY index very close to the end of June 2007 and the end of 1997. It then eased back to close at +310 bps Friday, which is inside the June 2014 lows and the Oct 2018 lows but above the Dec 2021 lows.
The high quartile has Regional Banks (KRE) on top followed by the Homebuilders (XHB) as homebuilders have rebounded impressively since the CPI index release and a spate of constructive earnings reports so far. The CPI numbers (see CPI June 2024: Good News is Good News 7-11-24) set the builder rally off and the confidence has not been shaken on valuation at this point even with XHB at #1 for LTM (see Homebuilder Equities: “Morning After” on Rate Optimism 7-12-24 , Homebuilders: Equity Performance and Size Rankings 7-11-24).

The 3-month score of 29-3 was the same as last week. The above chart shows the same 3 ETFs in the red across Base Metals (DBB), E&P (XOP), and Energy (XLE). Regional Banks (KRE) are back on top followed by Small Caps (RUT), Builders (XHB), and Real Estate (XLRE). The volatility of the tech sector is underscored by NASDAQ still sitting in the top 5 despite the recent beating.
The bond ETFs are all positive, but the long duration 20Y UST ETF (TLT) is at #1 in the bond ETF mix at +6.5% as it rode the favorable rolling move in UST. For the LTM period noted in the following chart, that same TLT is in the red as one of two ETFs with negative returns for the past year along with the lagging Transports (XTN). The YTD return on TLT is -4.1%.

The LTM remains at 30-2 this week with the long duration 20+Year UST ETF (TLT) and Transports (XTN) in the red. The homebuilder rally and fade across a range of Tech and Mag 7 heavy ETFs has pushed Homebuilders (XHB)further into the lead and the rest of the top quartile tightly packed and carried over from last week.
The large cap benchmarks have lost some ground on tech weakness, but the S&P 500 still materially has outperformed the Equal Weight S&P 500 ETF (RSP) LTM. The small cap benchmark (RSP) soared in Dec 2023 and then faded, and a big question for asset allocators is the durability of the small cap rally given that recent history relative to tech.
A slowdown in the consumer sector and cyclical weakness would call into question the earnings trends in many small cap sectors, so the UST curve vs. the small caps makes for a tough directional call. Material weakness in fundamentals would support UST shifts but be unkind to the same US-centric names that would not like tariffs.
See also:
Presidential GDP Dance Off: Clinton vs. Trump 7-27-24
Presidential GDP Dance Off: Reagan vs. Trump 7-27-24
PCE June 2024: Inflation, Income, and Outlays 7-26-24
2Q24 GDP: Into the Investment Weeds 7-25-24
GDP 2Q24: Banking a Strong Quarter for Election Season 7-25-24
Footnotes & Flashbacks: Credit Markets 7-22-24
Footnotes & Flashbacks: State of Yields 7-21-24
Footnotes & Flashbacks: Asset Returns 7-20-24
Industrial Production June 2024: Is the Sector Rotation Alive? 7-17-24
Housing Starts June 2024: Still All About the Deliveries 7-17-24
Retail Sales: Second Wind 7-16-24
Footnotes & Flashbacks: Credit Markets 7-15-24
Consumer Sentiment: Still Feeling the Heat 7-12-24
Homebuilder Equities: “Morning After” on Rate Optimism 7-12-24
Homebuilders: Equity Performance and Size Rankings 7-11-24
CPI June 2024: Good News is Good News 7-11-24
Footnotes & Flashbacks: Credit Markets 7-8-24
The B vs. CCC Battle: Tough Neighborhood, Rough Players 7-7-24