
Footnotes & Flashbacks: Asset Returns 6-9-24
Duration took a 1-day beating on Friday, but that still did not offset the overall 1-week move lower in rates for bond ETFs.


Leaders of the pack start to spread out…
The market had a ride this week with asset returns showing the large cap benchmarks (S&P 500, NASDAQ) in the black with tech and growth ahead of the pack, and the bond ETFs had a resilient week despite the Friday UST curve action with 5 of 6 positive and only EM Sovereign debt (EMB) in the red.
This coming week brings CPI and a fresh FOMC dot plot with more ammo to gut-check the Friday sell-off crowd, who will again face off against the UST rally team that held sway on the week before the payroll numbers.
The ECB might bring back the pre-COVID/post-crisis debate around how far the FOMC can deviate from the ECB in monetary game plans and how the UST curve and currency markets will handicap that compare-and-contrast. It is early on that topic.
Oil slid despite the OPEC policy update deal with a brief touch into $73 handle WTI (ended at $75 range Friday) after $79 the prior week.

Above we detail the performance of the high-level debt and equity benchmarks we watch. The rolling 1-month numbers were all in the red not long ago in late April (detailed in our 4-26-24 Footnotes publication).
We see the debt benchmarks at least coming up all positive again in the 1-month return in the sequential ranking even though the running 1-month numbers notched down from 1% handle returns to sub-1% with the new mix of weeks. Looking back 3 months, we see IG Corporates and UST benchmarks in the red zone.
In equities, the lagging small caps are not sending positive vibes for the US-centric expectations and are negative for 1-month and 3-months timelines. The small caps are well below the equity benchmarks looking back over what otherwise was a great year in stocks. Those 1-year small cap returns were mostly generated at the end of 2023 (see Footnotes & Flashbacks: Asset Returns 1-1-24) when the Russell 2000 put up a month of December over +12% as it chased the other benchmarks.

The above chart updates our 1500 and 3000 series with Growth jumping back into the lead for 1-month and Energy and Industrials falling back into the red for 1-month. Industrials is back in negative range for 3 months.
We still see the whole lineup in double digit returns for 6 months with the exception of Real Estate at a 1% handle for 6 months but negative for 3 months. The strength over the past 1 year for equities is on the scoreboard across the breadth of Growth, Financials, and Industrials. That will be an uphill battle from here with policy uncertainty and capex budgeting a major wildcard for numerous industries from Autos to Cap Goods and Energy to Retail. Trade policy and tax planning will be a significant input for capital budgeting, and the election will play no small role.
The rolling return visual
In the next section we get into the details of the 31 ETFs and benchmarks for trailing periods. Below we offer a condensed 4-chart view for an easy visual before we break out each time period in the commentary further below. This is a useful exercise we do each week looking for signals across industry groups and asset classes.

The above chart shows a steady mix shift toward more balance in positive and negative returns from prior periods as we detail below. The 1-week timelines can move around but the shift in performance is more evident now in 1-month as well as 3-months. We dig into those in the breakouts below.
The Magnificent 7 heavy ETFs…
Some of the benchmarks and industry ETFs we include have issuer concentration elements that leave them wagged by a few names. When looking across some of the bellwether industry and subsector ETFs in the rankings, it is good to keep in mind which narrow ETFs (vs. broad market benchmarks) get wagged more by the “Magnificent 7” including Consumer Discretionary (XLY) with Amazon and Tesla, Tech (XLK) with Microsoft, Apple, and NVIDIA, and Communications Services (XLC) with Alphabet and Meta.
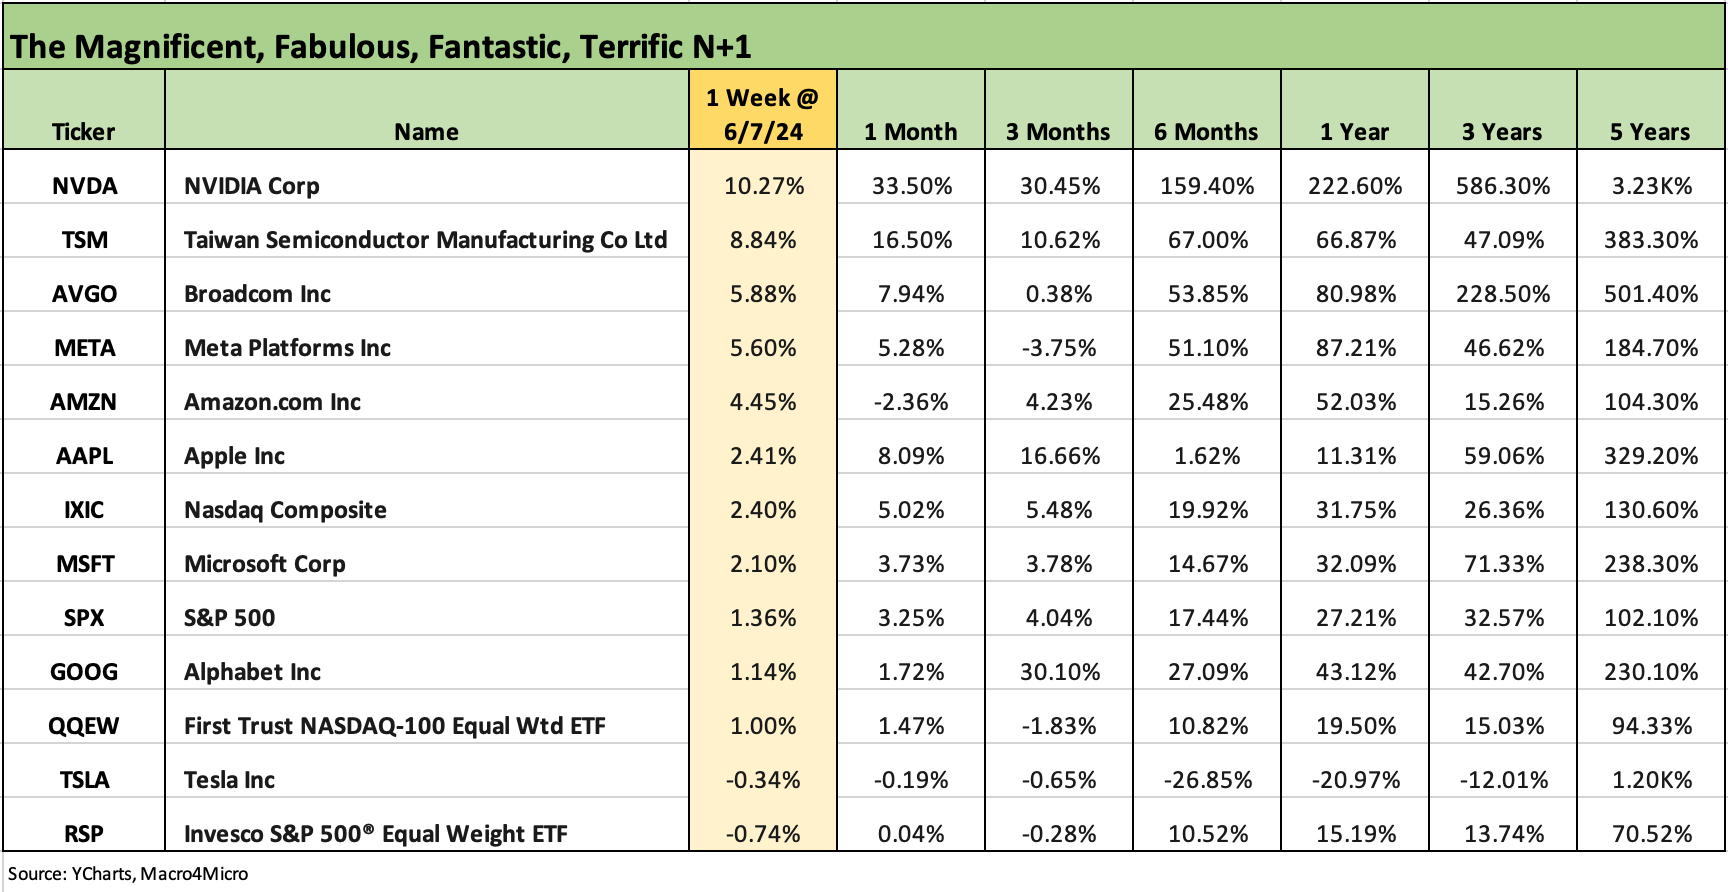
We recently added the above chart to the weekly so we can track the headline mega-names and see which might have wagged certain ETFs or the broader capitalization weighted benchmarks. We line up some of the major large cap Tech-centric names in descending order of total returns for the most recent week.
We include the S&P 500 and NASDAQ along with the equal weighted NASDAQ 100 Equal Weighted ETF (QQEW) and the S&P 500 Equal Weighted ETF (RSP). A table of the big tech names from the Mag 7 to the broader collection of “headline types” streamlines the weekly review if one of the big ETF names is impacting performances.
We see a strong week across Tech and NVIDIA and Taiwan Semi putting up banner weeks with Broadcom and Meta also both north of 5%. We see the S&P 500 in positive range, but the equal weighted S&P 500 ETF (RSP) is in negative range on the back of the tech outperformance.
TSLA continues to struggle and is now generating negative total returns over time horizons back across 3 years. EVs as a market is getting hit by the perception (and reality) of slow growth across the price tiers and what that means with so much negative EV press from used vehicle pricing to dealer dissatisfaction.

The 1-week return mix in our 31 benchmarks and ETFs weighed in at a balanced 15-16 on the week with a heavier weighting of Tech and Mag 7 flavor in the top quartile with the Tech ETF (XLK) at #1 followed by the NASDAQ at #2. We also see the Communications Services ETF (XLC) in the top quartile mix along with the NASDAQ 100 Equal Weighted ETF (QQEW) and Consumer Discretionary ETF (XLY).
Rounding out the group was the S&P 500 as large caps did well by the end of the week. The S&P 500, NASDAQ and Dow were all positive (Note: the Dow is not in our 31 but we cover it in the tables at the top of the commentary). Despite the UST whipsaw on Friday, a surprise guest in the top quartile was the long duration UST Index (TLT).
Among those taking a beating on the week, we see the Base Metals ETF (DBB) under pressure on the bottom at -4.7% as that volatile ETF is still at the top of the 3-month rankings but has fallen quickly down the ranks of the 1-month. Energy had a bad week with E&P (XOP) and Energy (XLE) in the bottom 5.
The curve has pulled Builders (XHB) and Regional Banks (KRE) down as well in recent periods as valuation gets debated. There is also ample uncertainty ahead on mortgages and growth rates for XHB and interest margins and asset quality for KRE.

The 1-month is now running at 17-14, and it is interesting to see 5 of the 6 bond ETFs in the positive range even if most are at the bottom end of the second quartile. The Friday sell-off after a period of lower rates will get a serious test this week with the FOMC mind-reading and Powell commentaries and dot plot adjustments along with the much more tangible metrics of the May CPI. We look at the curve issues in our separate Footnotes publication on yields (see Footnotes & Flashbacks: State of Yields 6-9-24).
The leaders of the pack at 1-month include Tech (XLK), NASDAQ (IXIC) and Communications Services (XLC) as Mag 7 names make a fresh push. S&P 500 also is a strong #4 but the Equal Weighted S&P 500 ETF (RSP) is all the way down at the top of the third quartile and barely positive at +0.04%. For now, the breadth theme is facing some short-term pressure. We see the BDC index (BIZD) holding in the upper ranks as the credit market backdrop is not under attack (yet) and floating rate secured debt is a decent home for asset risk and cash-based contributions to total returns.
On the bottom for the month, Regional Banks (KRE) still feel an erratic emotion X-factor in their performance around rates and commercial real estate exposure. The headlines are not getting much better there from the regional bank lumpiness of KRE exposures to the CMBS headlines of late.
Energy (XLE, XOP) and Builders (XHB) saw some setbacks over the 1-month time horizon. For Builders (XHB), that ETF is holding on to its #1 spot in LTM ranking by a sliver but could be losing that position as more home sales data rolls in over the coming weeks and mortgage rates stay stubborn. That comes after a great run for builders at +36% for 1 year. Numerous bellwether names have also had a good run (see Credit Crib Note: NVR, Inc. (NVR) 5-28-24, Toll Brothers: A Rising Tide Lifts Big Boats 5-23-24, Credit Crib Note: Taylor Morrison Home Corp (TMHC) 5-20-24).
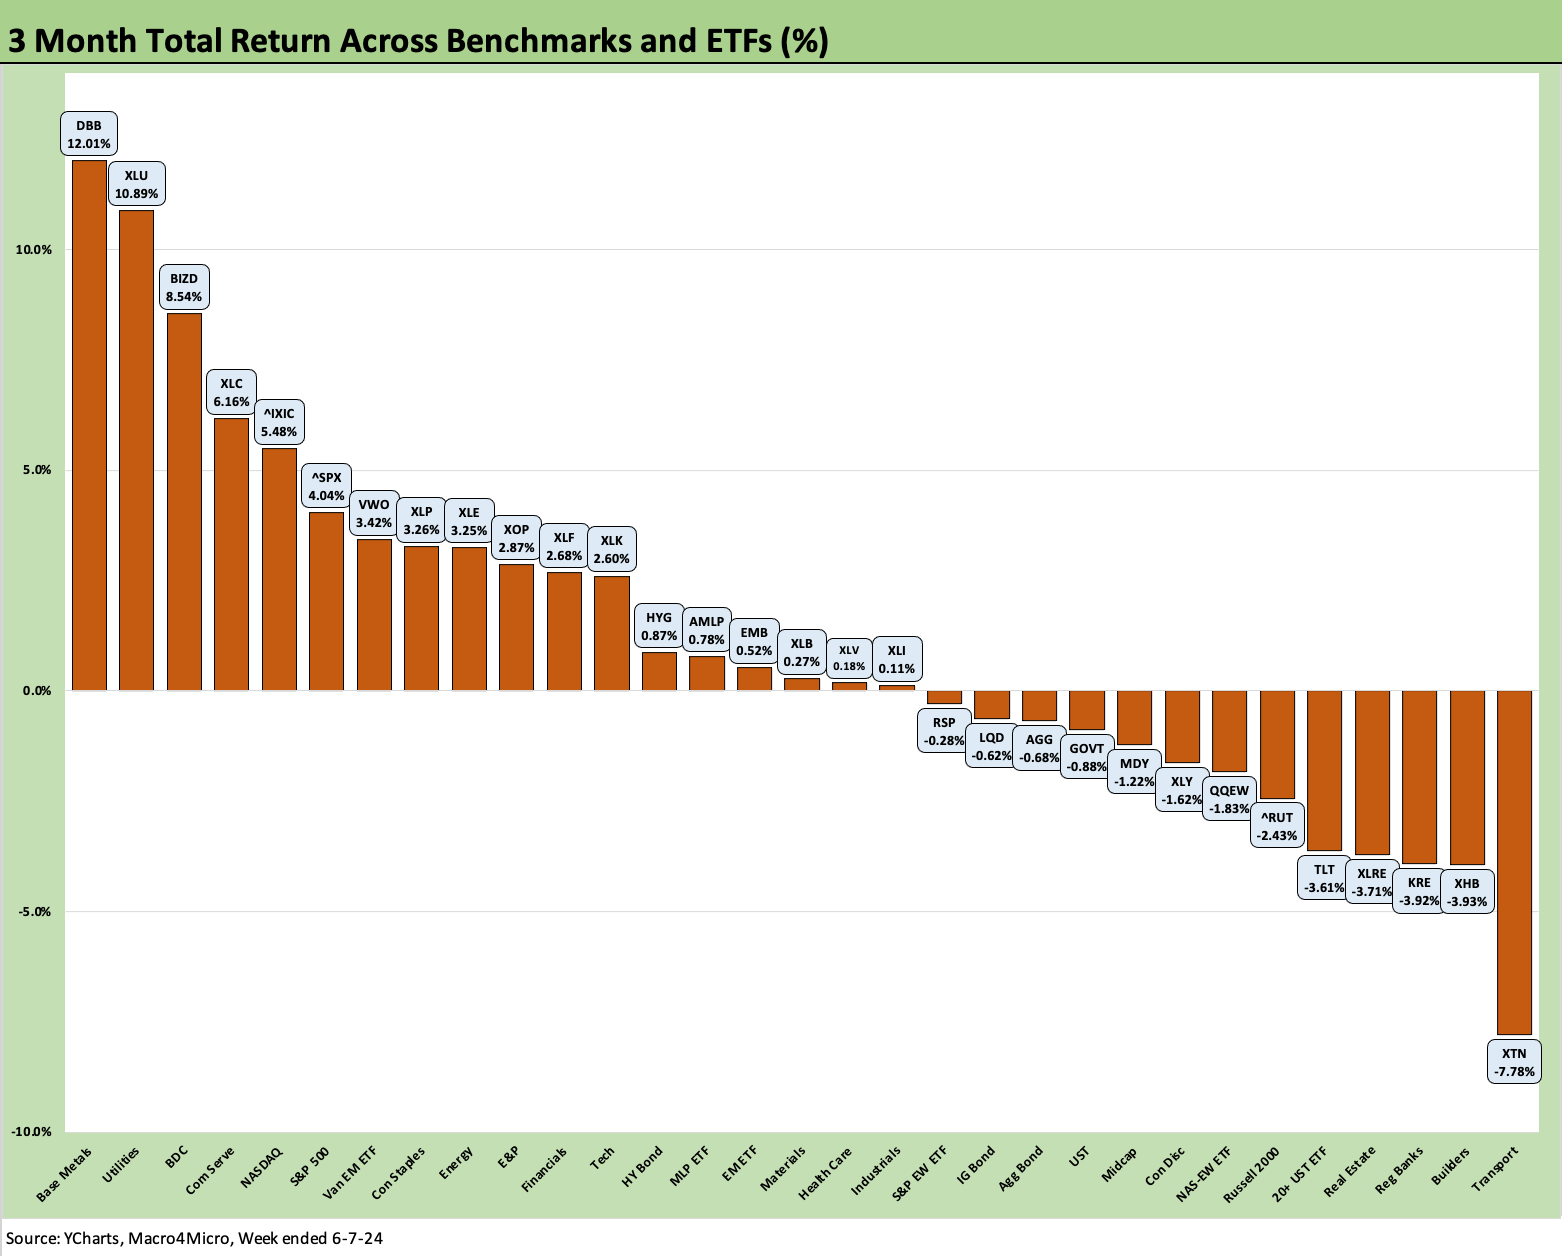
The 3-month returns are also shifting toward a more balanced return profile as the markets sees more differentiation across industry groups and benchmarks. We still see Base Metals (DBB) on top but that has been fading fast as noted in the 1-week and 1-month sections above.
Utilities (XLU) has been able to attract a range of investors from those looking at power demand to defensive themes and interest rate sensitive attributes depending on curve view. Meanwhile, the BDC ETF (BIZD) has held in very well at #3 with Communications Services (XLC) and NASDAQ rounding out the top 5.
For 3 months, Transports (XTN) is still mired in the lower rankings and is near the bottom in 1 year. The chart shows the interest rate sensitive names still feeling some pressure across Builders (XHB), Real Estate (XLRE), Regional Banks (KRE), and long duration UST (TLT).
We see 4 of the 6 bond ETFs in the negative zone, so this is where the test comes on when duration can get more sustained support from a UST curve with a potentially flagging consumer sector and a Fed that really seems to want to ease. We will get a read on the latter with the dot plot this week. PCE has cooperated in mild fashion of late, but fixed investment has been steady (see 1Q24 GDP: Second Estimate, Moving Parts 5-30-24).

It takes a while to move the needle on the 1-year after such a strong period with the 30-1 scoresheet holding strong and only TLT in the red and showing the duration pain on the long end.
Builders (XHB) may lose their spot on the leaderboard sooner rather than later with Communications Services (XLC), Tech (XLK), and NASDAQ in whispering distance before the drop to Midstream Energy (AMLP), Financials (XLF), BDCs (BIZD) and the S&P 500 in the top quartile.
Bond ETFs make up half the bottom quartile joined by lagging small caps (RUT), Utilities (XLU), Real Estate (XLRE), and Transports (XTN). Small caps made a major push in late 2023 but remain well short of historical highs in contrast to the lofty numbers and records in the large caps.
See also:
Footnotes & Flashbacks: State of Yields 6-9-24
Payroll May 2024: The Wave Continues 6-7-24
JOLTS April 2024: Shorter Line but Not Short 6-4-24
Construction Spending: Stalling Sequentially at High Run Rates 6-4-24
Footnotes & Flashbacks: State of Yields 6-2-24
Footnotes & Flashbacks: Asset Returns 6-2-24
PCE, Income and Outlays: Lower Income and Consumption, Sideways Inflation 5-31-24
1Q24 GDP: Second Estimate, Moving Parts 5-30-24
Durable Goods: Staying the Cyclical Course 5-24-24
New Home Sales April 2024: Spring Not Springing Enough 5-23-24
Industrial Production April 2024: Another Softer Spot 5-16-24
Housing Starts April 2024: Recovery Run Rates Roll On 5-16-24
CPI April 2024: Salve Without Salvation 5-15-24
Retail Sales April 2024: Get by with a Little Help 5-15-24
Consumer Sentiment: Flesh Wound? 5-10-24
Employment Cost Index March 2024: Sticky is as Sticky Does 4-30-24