
JOLTS April 2024: Shorter Line but not Short
We look at the latest JOLTS report for April as the market awaits the most recent May payroll data on Friday.


Just the facts...
April 2024 Job Openings are higher than the highest number of the pre-COVID cycle.
JOLTS data is following a logical pattern as a hefty tally of payroll bodies have been added to fill the Job Openings with the 8.1 million openings almost 2.6 million above the median since the fall of 2007 but 4.1 million below the March 2022 peak when the tightening cycle began.
The month of April 2024 saw Hires at over 3.7x the total of Layoffs and Discharges vs. a long-term median of just under 3x.
The positive differential of total Hires vs. Separations of all types (including Quits) sees Hires at 45% above the long-term median at 287K with Quits at 65% of Separations vs. the long-term median of 57%.
In the end, the jobs backdrop is still solid with UST bulls hoping for some job adds that are at least below what is needed to keep pace with demographics.
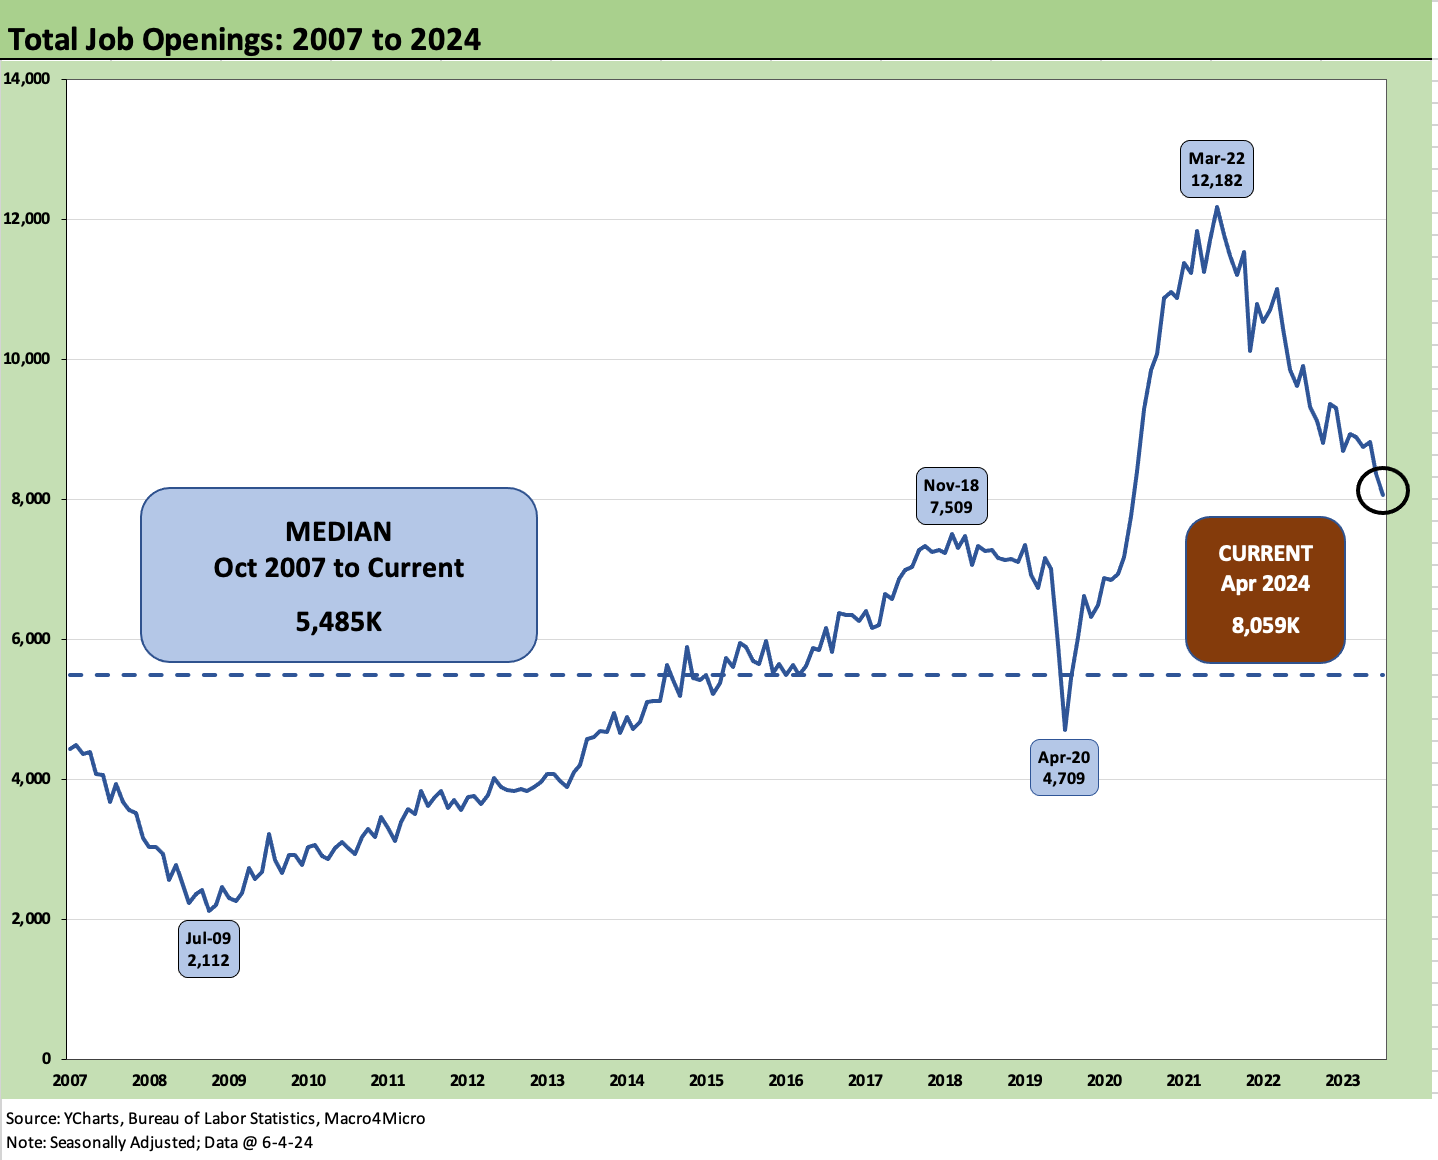
The above chart updates the running timeline on Job Openings since 2007 with the term “little changed” and “changed little” showing up quite often in the BLS JOLTS release text. The recent job openings of 8.06 million are running ahead of the peak numbers of the pre-COVID cycle when we saw 7.5 million in Nov 2018. That pre-COVID cycle ended up as the longest economic expansion in history before COVID derailed it.
The 12.2 million peak that was reached for Job Openings in March 2022 was part of a timeline of job expansion that ended up as the highest rate of payroll adds for any Presidential administration in history. Just the facts.
For the immediate trend now, however, the idea that the rate of hiring will slow is catching on as PCE eases back and some of the major areas of job adds such as construction start to plateau (see Construction Spending: Stalling Sequentially at High Run Rates 6-4-24). Problems in the auto sector in such areas as EVs is also not helping the story line in manufacturing.
Slower growth is not contraction, but at some point the forward looking bullishness for growth and fear of 2025 setbacks (tariffs, contraction in demand with mass deportations, civil strife, etc.) could start to slow employment trends as well.

The above chart updates the Hires multiple over Layoffs/Discharges. The current 3.7x is down from the Nov 2021 peak of 5.1x and above the long term median of just under 3x in a growing economy with a growing population.
When we look at the trend line post-COVID vs. post-crisis, we see a very bullish hiring period in 2020-2024 while the pain of the macro hangover in early 2009 to 2014 was painful and slow. The scale of the post-crisis carnage across manufacturing and services took time to heal on a global scale.
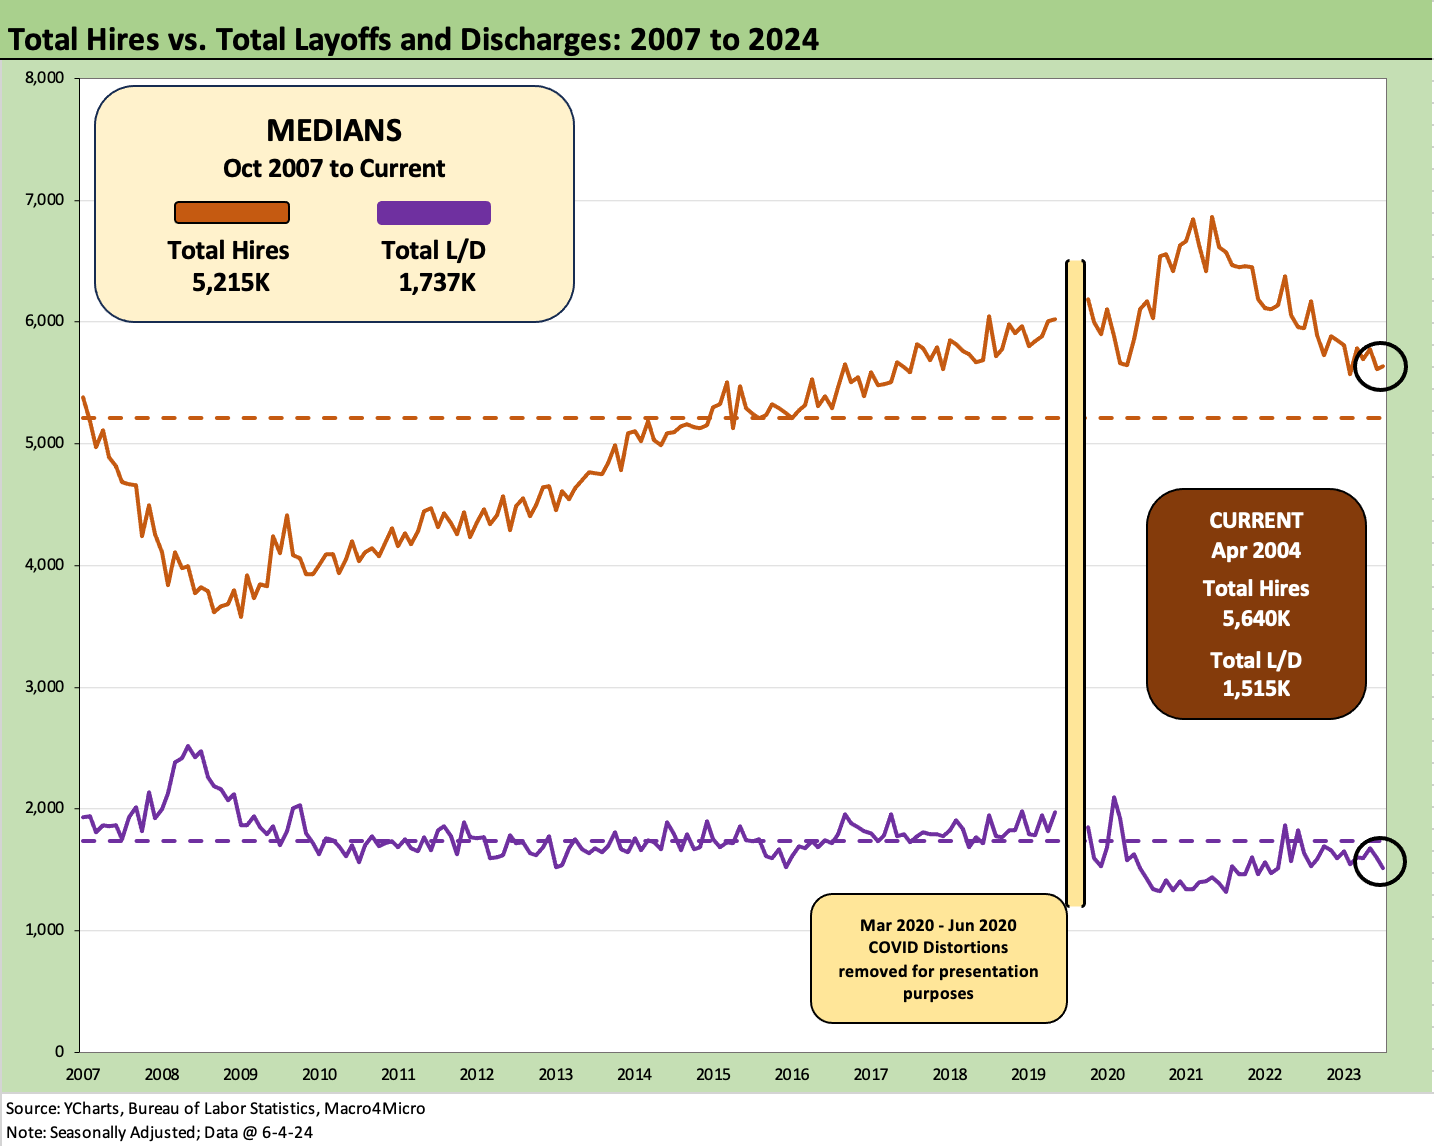
The above chart shows the timeline for the gross numbers for Hires and Layoffs/Discharges. We adjust the chart to exclude the visual distortions of the peak COVID disruptions. We look at the COVID impacts in a box further below. We frame the medians for Hires and Layoffs Distortions in the box embedded in the chart. Hires in April are still well above medians and Layoffs/Discharges are still below median. That is a good backdrop with room to maneuver outside a recession scenario.
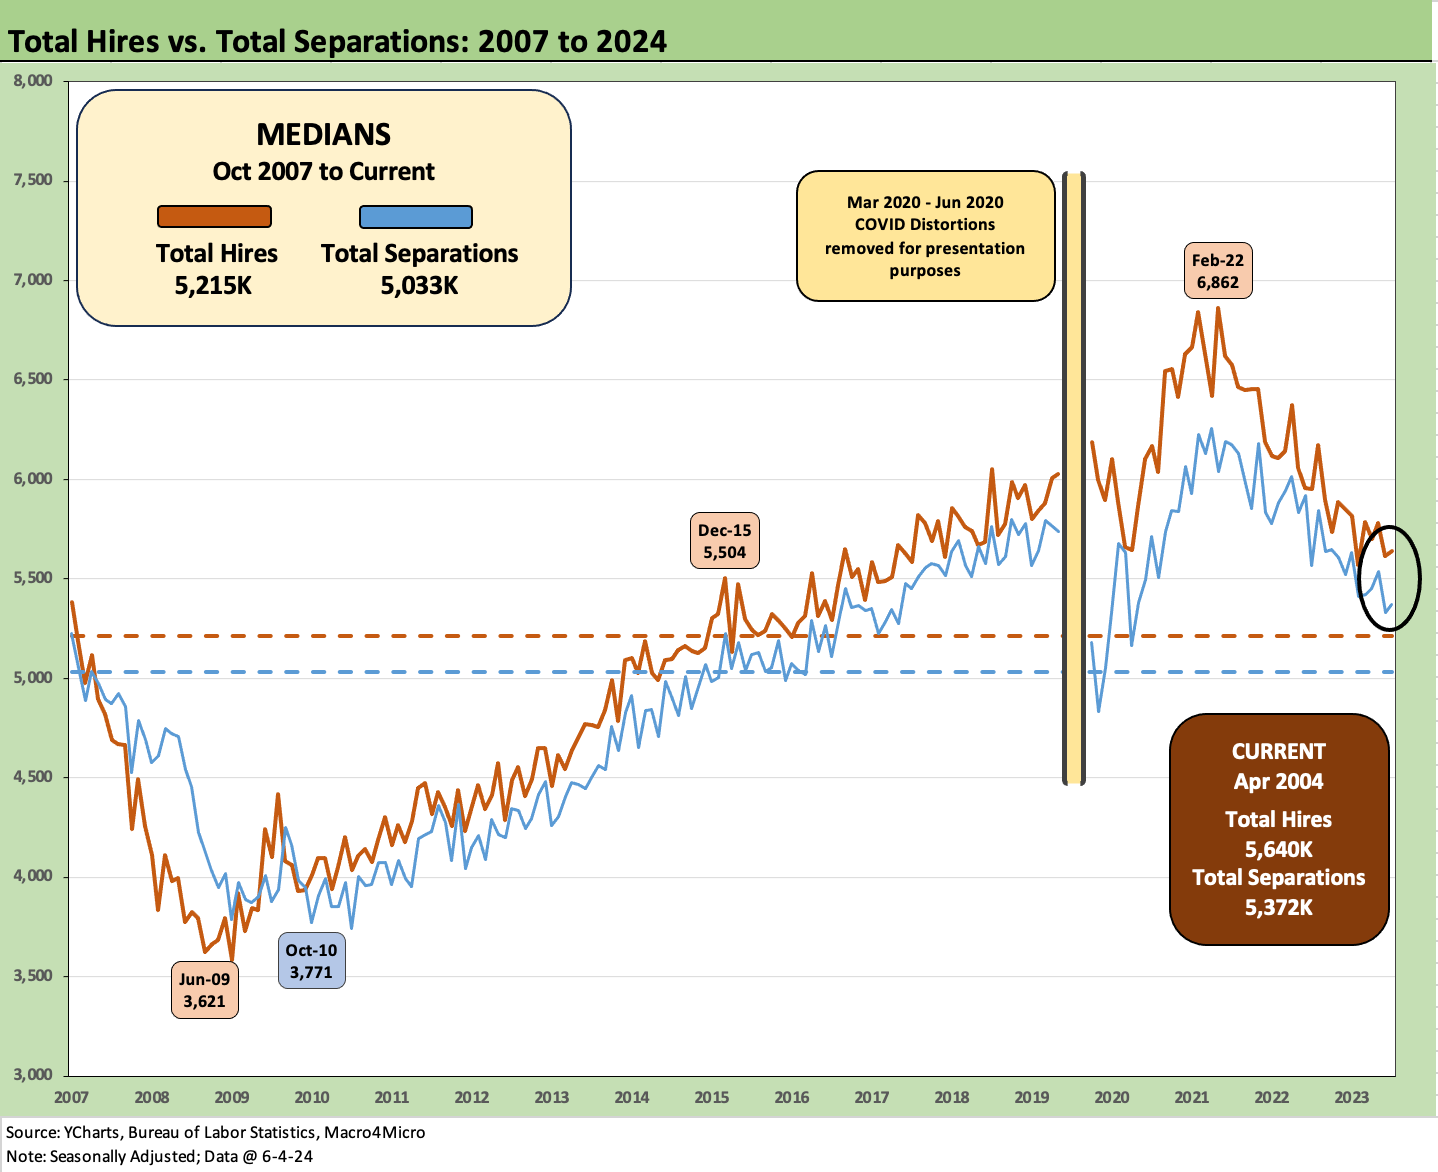
The above chart frames Hires vs. the total of all Separations which rolls “Quits” into the tally. Hires are above median, and Separations are also above median given the high Quit tally that has been evident in the recent job markets.

The above boxed text and numbers in the commentary tell the story of the other worldly employment swings during COVID. The Separations in March 2020 of 16.3 million followed by 11.3 million in April is like something from an asteroid movie.

The Hires minus Separation time series is updated above with the worst COVID distortions removed to preserve the visual value for “normal” cycles (to the extent a systemic bank crisis and global meltdown is “normal”). The current differential of +287K is materially above the +197K longer term median.

The above chart updates the “Quits mix” in Separations, and we still see an above median mix of Quits at over 65% of total Separations vs. the 57.4% median. The official “Quits Rate” (Quits as a % Total Employment) after revisions has been flat at 2.2% (SAAR) for each month in 2024. It is down from 2.3% in April 2023. The 3.5 million Quits was up by 98K for the month. The biggest decline was in Professional and Business Services at -131K. The Private Sector in total was only +60K for the month.
See also:
Construction Spending: Stalling Sequentially at High Run Rates 6-4-24
Footnotes & Flashbacks: State of Yields 6-2-24
Footnotes & Flashbacks: Asset Returns 6-2-24
PCE, Income and Outlays: Lower Income and Consumption, Sideways Inflation 5-31-24
1Q24 GDP: Second Estimate, Moving Parts 5-30-24
Durable Goods: Staying the Cyclical Course 5-24-24
New Home Sales April 2024: Spring Not Springing Enough 5-23-24
Industrial Production April 2024: Another Softer Spot 5-16-24
Housing Starts April 2024: Recovery Run Rates Roll On 5-16-24
CPI April 2024: Salve Without Salvation 5-15-24
Retail Sales April 2024: Get by with a Little Help 5-15-24
Consumer Sentiment: Flesh Wound? 5-10-24
April Payroll: Occupational Breakdown 5-3-24
Payroll April 2024: Market Dons the Rally Hat 5-3-24
Employment Cost Index March 2024: Sticky is as Sticky Does 4-30-24