
Footnotes & Flashbacks: Asset Returns 4-28-24
Earnings gives favorable reality check on fundamentals.


Seriously. It is like pulling teeth with the bears.
You show up and they call you a stag!
After the prior week’s beatdown, the equity market bounced back even as the 1Q24 GDP release and PCE details gave the market fresh debating material. The fact remains that personal consumption was strong and consistent with earnings season color (see PCE, Income, and Outlays: The Challenge of Constructive 4-26-24)
Too many GDP headline readers started pitching stagflation when the PCE line and Fixed Investment mix were firmly positive (see 1Q24 GDP: Too Much Drama 4-25-24) as inventory and trade shaved off -1.2 points but the critical lines held serve for a continued expansion theme.
Fixed investment was solid with housing impressive and all GPDI lines positive except for a minimal negative in Structures, which faced tougher comps after 4 quarters of double-digit growth.
The UST curve posted a more muted adverse move higher this week with credit spreads tighter and the smoke clearing on a week where the Fed easing timing was pushed back yet again. Only 5 of the 31 asset lines we monitor were negative this week and 3 of those 5 were bond ETFs.
The week had its confusing moments as inflation metrics in the GDP and PCE releases disturbed UST bulls. The net effects of the releases caused some anxiety around a stall in inflation progress and even fears of some more reversal of the success to date. That said, making the leap from a very tough last mile to calling for the arrival of stagflation is more about bearish forecasts than signs of economic contraction in the numbers. Stagflation is a forecast, but the mix of favorable growth numbers in PCE and fixed investment are a backward-looking fact.
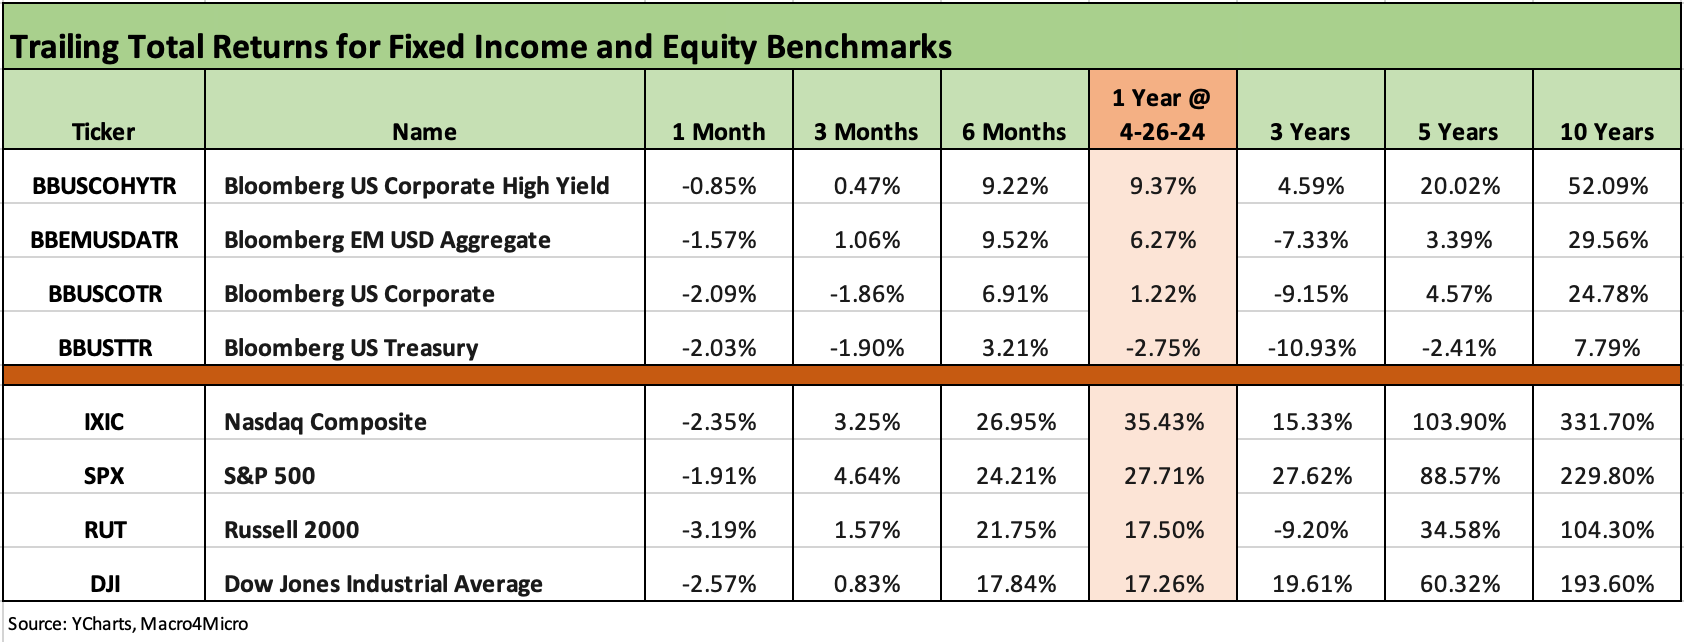
The above chart covers the high level debt and equity benchmarks we like to track, and we are still sitting in all negatives for the trailing 1-month period for both fixed income and equities. We line up the benchmarks in descending order of 1-year total returns. UST still sits in the red for the 1-year.
The week was a very good one for equities and one of the best for some equity benchmarks since October. The Big 4 (S&P 500, NASDAQ, Russell 2000, and Dow) were all positive with the NASDAQ seeing a banner week at +4.2%. As noted above, the running 1-month is still a struggle on the setbacks for UST optimism and FOMC timing.
The next week will bring more big name earnings after some of the biggest consumer names such as GM and Ford weighed in along with a slice of the major auto retailers, who brought color on bigger ticket consumer trends. Auto retailers had a good week in equities and in some cases exceptional. For this coming week, Apple and Amazon will round out the Magnificent 7 releases plus we will see a slew of consumer-related reports. If stagflation is upon us, many companies and more than a few economic releases are not clued in on that.
Economic indicators ahead this week include the Employment Cost Index, JOLTS, and monthly payroll on top of the FOMC meeting to keep things lively.

The above chart looks at the latest for the 1500 and 3000 series, and the mix over 1-month looks a lot like last week’s with all of the index lines in the red except Energy. The rolling 3-month has been quite strong with the exception of Real Estate with the 6 months period still feeling the effects of the monster Nov-Dec rally to end the year.
The returns are lined up in descending order of total returns over the trailing 1 year, and only the Real Estate sector has fallen well short of equity-like returns in the face of adverse curve developments.
Growth remains the clear winner as it bounced off the pain of 2022 while the 3-year returns offer a reminder of the virtues of diversification. Energy was about geopolitical event risk (and opportunities) in an increasingly ugly world (the world always seems ugly, but industry impacts vary).
As we will be reminded on the march to Election Day, external policy factors (war, pestilence, famine, policy risk such as trade wars, etc.) will loom. That will especially be the case in a Washington crowd where various leaders threatened default on the UST (Jan 2025 gets that back on the table) and some are now discussing a Federal Reserve coup. Further, conflict with China is expanding (Taiwan, Russian Ukraine support by China, trade). Supplier chain risk and China trade risk are intertwined.
The prevailing view is that too many in Congress have the capital markets IQ and spines of their fellow members of genus Lumbricus (go ahead Google me!) without the environmental value. That does not help confidence ahead of such a momentous year in policy decisions in 2025.
The rolling return visual
In the next section we get into the details of the 31 ETFs and benchmarks for trailing periods. Below we offer a condensed 4-chart view for an easy visual before we break out each time period in the commentary further below.
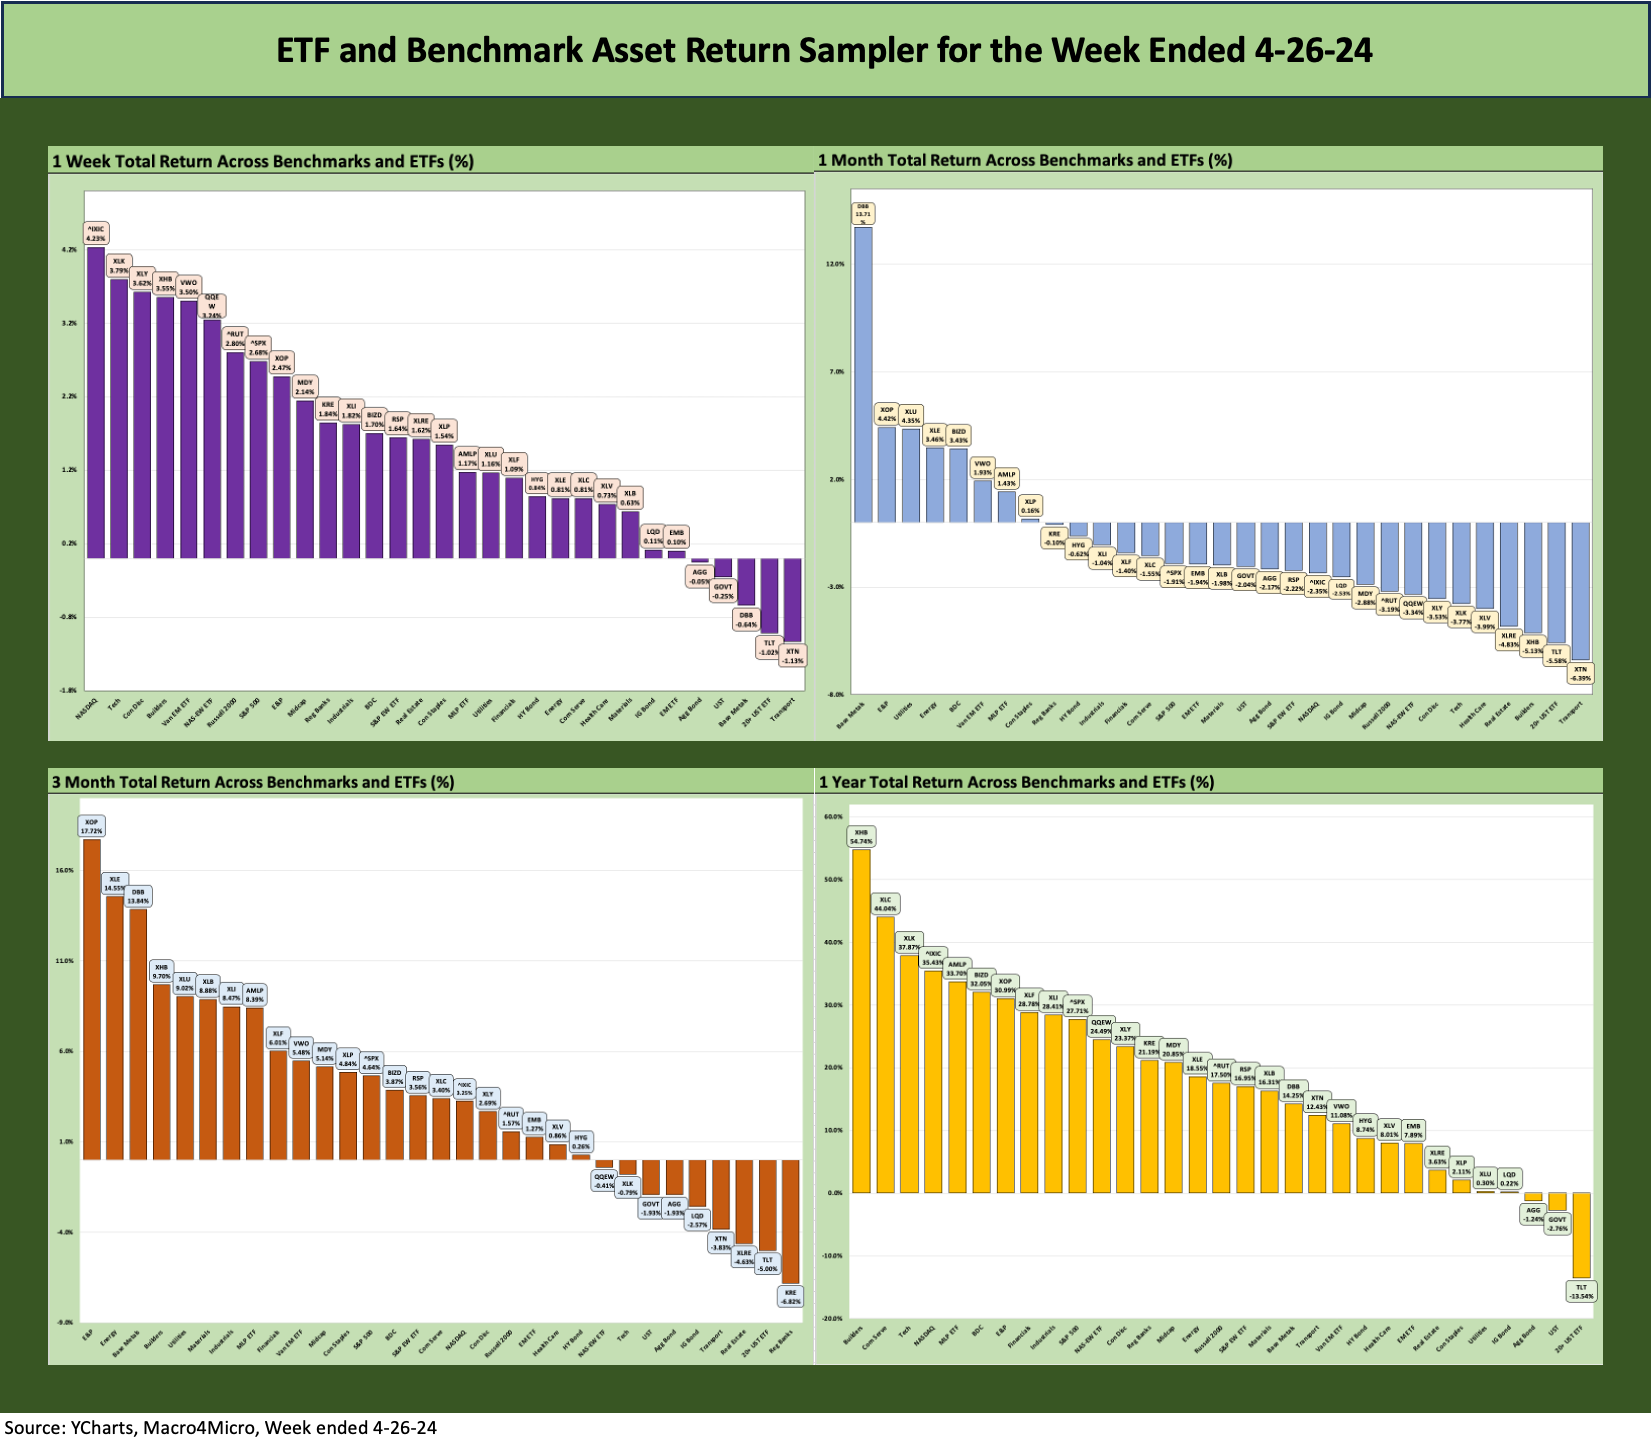
The above chart highlights recent turmoil at the back end of a very strong year for equities. The 1-month period shows the perils of the inflation battle while the 3-month period smooths that effect out (for now). The week-to-week numbers have grown more erratic after a healthy string of weekly numbers to get the year rolling.
The Magnificent 7 heavy ETFs…
Some of the benchmarks and industry ETFs we include evidence issuer concentration elements that leave them wagged by a few names. When looking across some of the bellwether industry/subsector ETFs in the rankings, it is good to keep in mind which narrow ETFs (vs. broad market benchmarks) get wagged more by the “Magnificent 7” including Consumer Discretionary (XLY) with Amazon and Tesla, Tech (XLK) with Microsoft, Apple, and NVIDIA, and Communications Services (XLC) with Alphabet and Meta.

The above chart highlights the 1-week performance of our 31 benchmarks and ETFs and the scoresheet weighed in at 26-5 after last week’s 8-23 and the week before that turning in a dismal 1-30.
The tech sector saw the Tech ETF (XLK) on the bottom last week with the NASDAQ (IXIC) second to last. The rebound this week put NASDAQ at #1 and XLK at #2 with NVIDIA posting +15% after a nasty -10% day to close out last week. NASDAQ was off by -5.5% last week.
The negative numbers above are very mild but include 3 duration-sensitive, high quality bond funds with the long duration 20+ year UST ETF (TLT) at -1.0%, and the UST ETF (GOVT) and AGG in the red. IG Corporates (LQD) and EM Sovereigns (EMB) were barely in the positive zone in the bottom quartile. HYG was a little further up the rankings on spread compression and less duration exposure.

The 1-month returns are still feeling the pain of recent weeks at a score of 8-23 with all 6 bond ETFs in the red and the long duration TLT in second to last with Transport Equities (XTN) bringing up the rear. Some of the YTD highfliers are in the bottom quartile including Tech (XLK) and Builders (XHB). We see the NASDAQ 100 Equal Weighted ETF (QQEW) and Consumer Discretionary ETF (XLY) in the bottom quartile with Tesla and Home Depot as major holdings dragging XLY down.
As we saw last week, the Base Metals ETF (DBB) has been flying with E&P (XOP) and Energy (XLE) strong and Midstream holding in the top quartile. The BDC ETF (BIZD) is riding the optimism around the leveraged finance cycle and the FOMC timing support being handicapped for floating rate assets.
The BDC peer group has a slew of earnings coming up over the next two weeks, so the private credit fixation of late will get some news to play with as the market will be on the lookout for lumpy asset quality developments.

The 3-month score came in at 22-9 favoring positive with energy, commodities, power, materials, industrials, and builders high on the leaderboard. That mix is not signaling fears of contraction. E&P (XOP), Energy (XLE) and Base Metals (DBB) are the top 3 followed by the Builders ETF (XHB) that continue to impress and already has seen homebuilders put up some strong March quarter earnings reports.
Over on the right in the bottom rankings we see Regional Banks still feeling the concerns around asset quality and worries over the next NYCB type headline. Interestingly, the broader Financials ETF just missed the top quartile as the regional bank names are still somewhat segregated from the group in risk-reward profiles. The market has seen a fair amount of disagreement on how this commercial real estate cycle will play out and what it means for regionals.
We see 4 of the 6 bond ETFs in negative range with TLT second to last and joined in the red by LQD, AGG, and GOVT with HYG just across the divide and EMB a bit up the rankings.

The LTM rankings show 28-3 favoring positive with TLT in last with GOVT and AGG in the red as fixed income has lagged on the UST curve. LQD was barely in positive range while EMB made it into the black at the top of the bottom quartile.
The winner of the bond ETFs was HYG at +8.7% which is within whispering distance of the long-term nominal return on equities and comfortably above a coupon return. HYG had the benefits of spread compression, higher coupons, and lower exposure to duration.
See also:
PCE, Income, and Outlays: The Challenge of Constructive 4-26-24
1Q24 GDP: Too Much Drama 4-25-24
1Q24 GDP: Looking into the Investment Layers 4-25-24
Durable Goods: Back to Business as Usual? 4-24-24
Systemic Corporate and Consumer Debt Metrics: Z.1 Update 4-22-24
New Home Sales March 2024: Seasonal Tides Favorable 4-23-24
Footnotes & Flashbacks: State of Yields 4-21-24
Footnotes & Flashbacks: Asset Returns 4-21-24
Existing Home Sales March 2024: Not Something Old, Something New 4-18-24
Housing Starts March 2024: The Slow Roll and Ratchet 4-16-24
Industrial Production: A Healthy Sideways 4-16-24
Retail Sales March 2024: Until You Drop 4-15-24
Consumer Sentiment: Do You Think Scary Thoughts? 4-12-24
CPI March 2024: The Steeplechase Effect 4-10-24