
PCE, Income and Outlays: Practicing Safe Growth?
Income outpacing spending and inflation easing MoM and YoY makes for a good PCE release.


So what Core PCE price index is the right one?
The May 2024 PCE release is more important than just the PCE price index with the consumption line one to watch closely after another material revision of PCE in the final 1Q24 GDP numbers (see 1Q24 GDP: Final Cut, Moving Parts 6-27-24).
The May PCE price index action was consistent with expectations. Headline PCE eased to +2.6% in May from +2.7% in April, Core PCE declined to +2.6% in May from +2.8% in April, and MoM was 0.0% for headline PCE (vs. +0.3%) and MoM Core at +0.1% (vs. +0.3%).
Nominal disposable personal income rose MoM to +0.5% (from +0.3% in April) or well ahead of nominal PCE of +0.2% (vs. revised +0.1% in April) with MoM spending on Goods at -0.4% (down from +0.2% in April) and Services at +0.2% (down from +0.3%).
The net takeaway from the curve as we go to print is a slight move lower with the stock market initially liking the combination of lower spending and cooler inflation numbers but then softening. The UST market was mixed with mild steepening as we go to print.

The above chart is one we include as a reminder of how slow the FOMC was in getting into an actual tightening framework. The tightening may have started in March 2022 with the move off ZIRP, but real tightening is not in place until fed funds exceeds inflation and fed funds are in fact positive real fed funds. Negative real fed funds constitutes accommodation, but it initially serves as “less accommodation” rather than actual tightening. That positive real fed funds rate took a while to cross the line.
There was little (arguably zero) discussion of Fed policy in last night’s debate with Biden not raising it and Trump busy giving a MAGA rally replay. Any views on the key drivers of inflation “then vs. now” were not addressed other than Trump saying, “it was all Biden.” That was not a case study in conceptual depth to say the least. Biden was lost and Trump was his usual fact-lite self. Maybe I missed it, but no one called out Trump after he in substance again claimed the seller pays on tariffs.
The May PCE numbers were once again modestly helpful to the hope for a finesse game of easing by a patient FOMC. Income outpacing expenditures works well enough (PCE, Income and Outlays: Lower Income and Consumption, Sideways Inflation 5-31-24) to support a soft landing scenario with lower inflation.
Overall, the PCE release still presents a mixed trend line but with consumption biased lower as we have seen in recent GDP revisions (see 1Q24 GDP: Final Cut, Moving Parts 6-27-24) and in a range of housing signals (see New Home Sales: Pumping the Brakes 6-26-24, Existing Home Sales May 2024: Weary Climb 6-21-24).
As a reminder, the WSJ has reported that Trump wants full control of the Fed and to roll it up as subjugated to the UST, so the Fed was also neglected as a topic in the debate. The inflation problem is a complex one that cuts across radically imbalanced supply-demand relationships, fiscal stimulus impacts on demand after a 100-year virus flood, Trump and Biden tariffs, the FOMC feet nailed to the starting blocks in 2021, the Russia-Ukraine global energy and food chaos, a mini wage-price spiral, and the ability of goods producers and service providers to raise prices when demand exceeds supply. That is a partial list of inflationary ingredients that got very little coherent focus last night.
Pricing strategies by goods and services providers gets a lot of attention on the left who tag price increases as widespread, de facto price gouging. If the left does not get the realities of supply and demand, they will not be taken seriously. It gets old and never works. Trump is wholly inarticulate (i.e. ignorant) on what drives inflation. Biden flamed out on the topic in the debate. After that fiasco, it is clear that the candidates are in a two-way tie for last place on the inflation topic (there is no first place). We have seen some Progressives bring out their margin charts to prove their case, but they flail on the topic and the exercise is more about targeting a subset of “the base.” That is not a topic worth debating since the lessons of the early 1970s include the experience that wage and price controls don’t work no matter what political party is in office.

The above chart updates the time series for long-term headline PCE and Core PCE. For the longer term PCE and Core PCE numbers, we see +2.6% and +2.4%, respectively, when the brutal spikes of the early 1970s and 1979-1981 get dropped in. When PCE (whether headline or core) is targeted for +2.0%, the above chart says, “I doubt it.”
An interesting exercise is to try to find universal agreement on what the 2.0% target applies to…Headline or Core? We have found both with one FOMC member from prior groups saying (in writing) it was definitely “headline.” It is like a floating craps game with a toggle of convenience for the target metrics.
The long-term time series is always a useful reminder of how insanely volatile the history was in the old days of the nasty inflation spike of the late 1973 oil embargo with the Yom Kippur War. The structure of US industry was undergoing the aftereffects of everything from post-Vietnam inflation to energy shocks and the high mix of COLA contracts setting off the wage price spiral. Nixon’s policies flopped and Ford’s homemade “WIN” button (Whip Inflation Now) just didn’t do the trick (see Inflation: Events ‘R’ Us Timeline 10-6-22, Misery Index: The Tracks of My Fears 10-6-22).
The waves of deregulation, currency market distortions and a fresh round of oil panic in 1979 set the stage for the mother of all tightening cycles under Volcker on the way into a vicious double dip recession. When political leaders play partisan games with such extremely complex topics with such convoluted histories, they are not doing anyone any favors in the ruthless ambition to win at any cost.
I was studying economics in the immediate aftermath of the then-longest recession (1973-1975) since the Depression and then on to work in NYC during the 1980-1981 double-dip with the second leg of that tied with the 1973-1975 recession for length (see Business Cycles: The Recession Dating Game 10-10-22). With those memories, I keep thinking about all those long-ago professors and Wall Street economists who often had 180-degree opposite views of the causes and the right cure.
Whether it was being barraged with theories on monetary aggregates as the main event or the more sea level factors of supply-demand, the idea is don’t rule anything out and blindly accept academic dogma. I admit to favoring supply and demand from my time studying the matter idling in a car in the odd-even license plate line to get gasoline during the aftermath of the Arab Oil Embargo. A read on M1, M2, and M3 monetary aggregates was not making the line any longer or shorter.

The above chart breaks out the headline PCE vs. Core PCE differentials. The long term median is zero, and that is where the differential is for May 2024. For now, energy markets are not the main event. As we cover in our monthly reviews, the Services sector is the root of the problem at this point.
Food and Energy have faced some very wild rides across the decades and notably after the Arab Oil Embargo in late 1973 and into the crunch of 1974. We see this again in the 1979 panic that had a disproportionate impact on the refined product markets in what has been described as a hoarding problem exacerbated by the major integrated oil companies.

The above chart does the same PCE and Core PCE exercise but for a shorter timeline from 1997 through 2024. This timeline brings a median for PCE of +1.9% and Core PCE of +1.7%. This is below the +2.0% Fed target, but it is fair to say a global systemic bank crisis and a deadly global pandemic make for a backdrop that are hard to cook up very easily. The 2.0% target is a tough one to defend in historical context.
The timeline from 1997 through 2024 included a wide range of dramatic Fed accommodation including the mega-easing actions of 2001 in the aftermath of the TMT implosion and the easing into the next expansion that saw 1% fed funds to kick off 2004. That prolonged easing into the up-cycle in turn set the table for the housing bubble in mortgages and in the structured credit and derivative market. The well known story brings the systemic bank system crisis and ZIRP from late 2008 through the end of 2015 with low rates through 2018, fed fund cuts in 2019 and the return to ZIRP in March 2020 through March 2022.
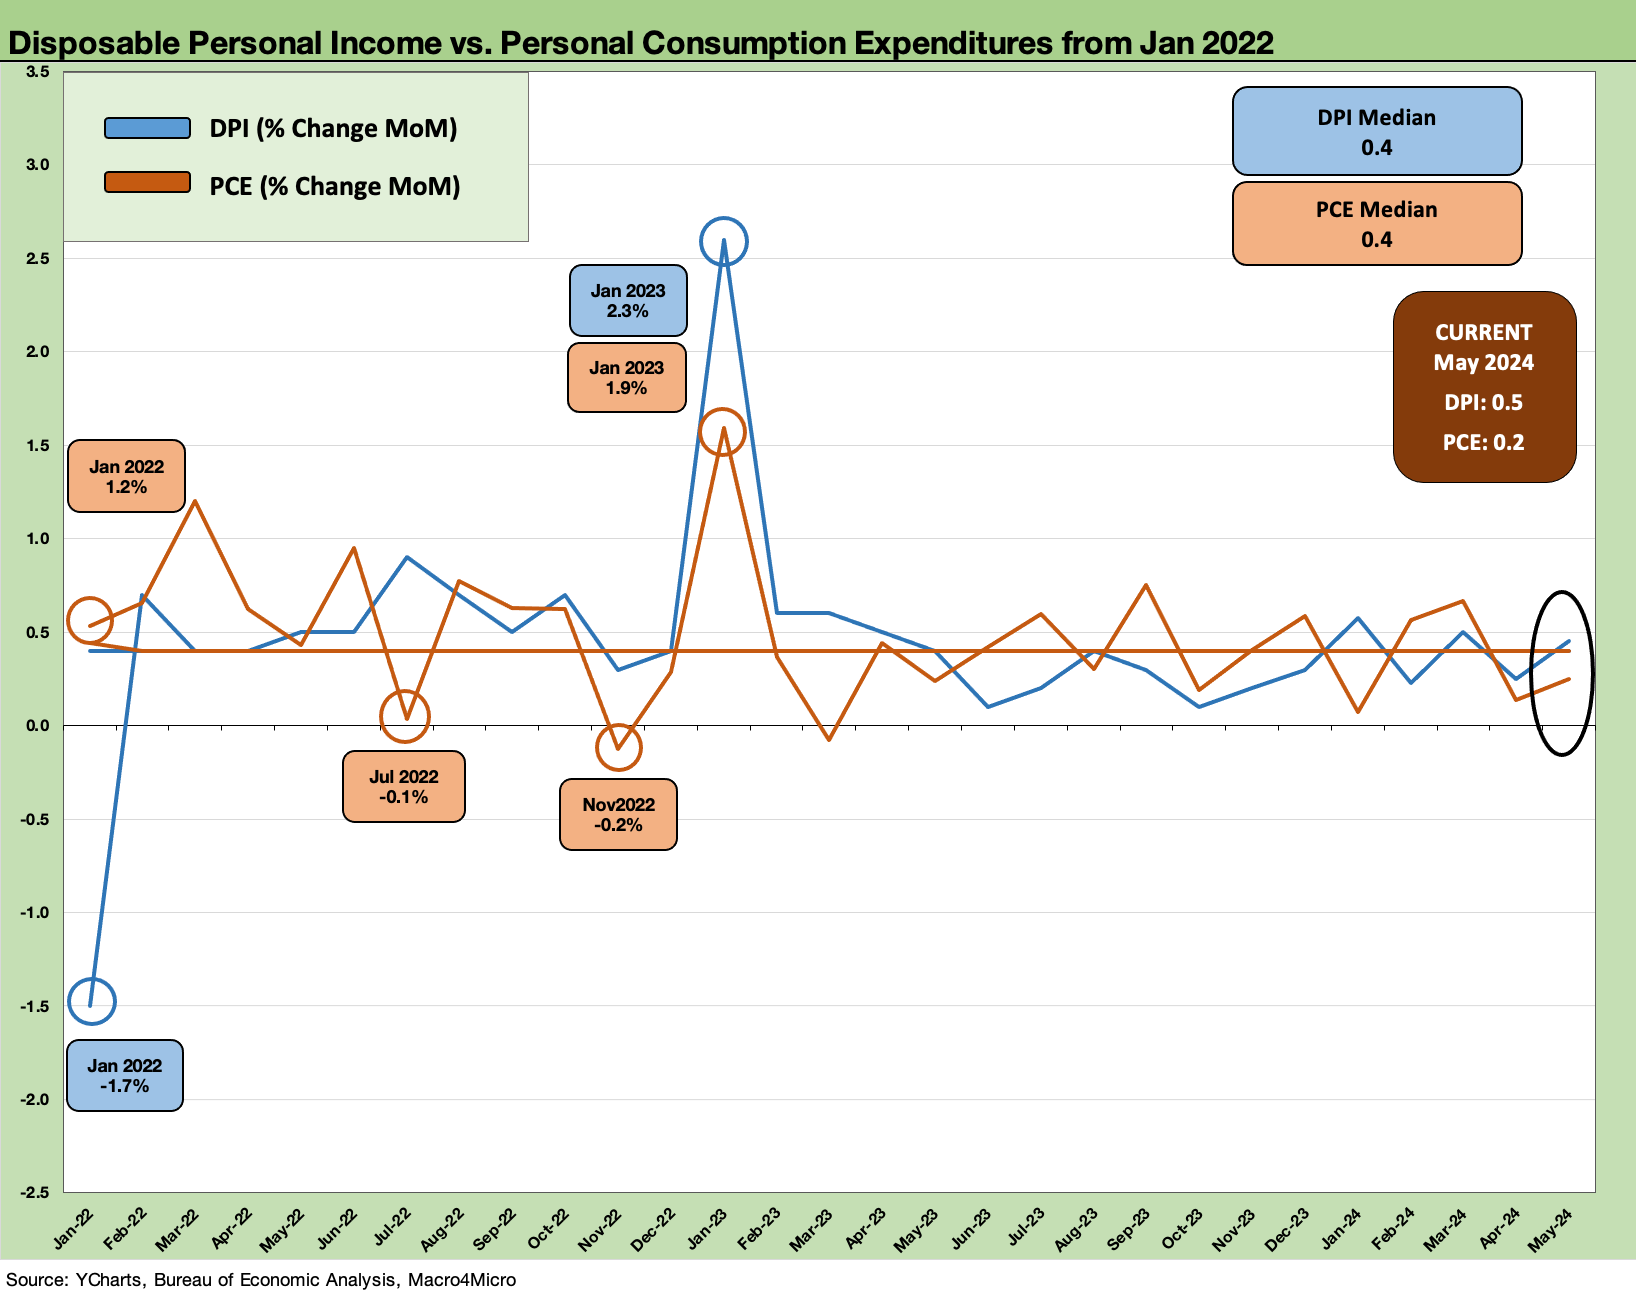
The above chart updates the time series for MoM DPI vs. PCE for a visual on income vs. consumption trends during the period from just before the tightening cycle. We have covered these patterns routinely in our monthly PCE updates. DPI ahead of PCE allowed for an uptick this month in the saving rate to 3.9% from 3.7%. The low savings rate has been a sign of a strong consumer sector but also one that is hard to sustain (see Savings Rates: Context Across the Cycles 10-27-23).
Across the post-Jan 2022 timeline detailed above, we see a dead heat in the DPI vs. PCE median at +0.4%. We see some distortions along the way, but they generally ran in a tight range. We are lately seeing the DPI ahead of PCE. That feeds into the moderating consumer story.

The above chart revisits the more controversial periods of the DPI vs. PCE time series that starts back in 2019 ahead of COVID. The COVID effects and ensuing stimulus actions drove some wild swings in DPI vs. PCE but then settled into a tight range after some major distortions and disruptions. The stimulus bills were very partisan and bitter in nature before and after the election (and who had to sign off in the White House) with the usual battles over how funds should be disbursed and who gets the money (a time-honored battle).
The reality is that anything that creates more demand is inflationary when supplies are as out of balance as they were in 2020-2021. That is a supply-and-demand fact influenced by actions in 2020-2021 when inventory was tight in many key sectors and notably in big ticket areas such as housing and autos (new and used).
The same is true for demand picking up when tariffs raised the cost of goods from supplier chains to finished goods. Those costs can be easily passed along with such supply-demand imbalances as seen during and after COVID.
The supply-demand dynamic feeds pricing power and notably on the goods side in the initial wave of pent-up buying. Meanwhile, that blurs the accountability and the lag effects. Those looking to assign blame for inflation can narrowly pick an action and lay blame (stimulus bills, FOMC asleep at the switch, Russia and oil, tariffs, etc.).
To say this issue was not addressed in the debate in any meaningful way would be an understatement. The CNN moderators rounded up to useless media mannequins (not an unusual occurrence). Trump was Trump, and Biden did not show up.

The above chart updates the monthly timeline for DPI vs. PCE across the timeline from 2019 across COVID into the stimulus period and then into the inflation and tightening cycle.
The periods of PCE contraction and DPI spiking are now settled into a 2024 period where we may have flipped into a stretch ahead where DPI more regularly runs in excess of PCE. That remains to be seen if it will keep playing out, but that would be a cyclical flag for the consumer sector. That demand weakness also could offer more support for more FOMC cuts if we see it flow into services inflation. This month we saw PCE price deflation YoY for Durable Goods at -3.2% but Services was still sitting up at +3.9%.
See also:
Durable Goods: Playing Defense 6-27-24
1Q24 GDP: Final Cut, Moving Parts 6-27-24
New Home Sales: Pumping the Brakes 6-26-24
Footnotes and Flashbacks: Credit Markets 6-23-24
Footnotes & Flashbacks: Asset Returns 6-23-24
Footnotes & Flashbacks: State of Yields 6-23-24
Existing Home Sales May 2024: Weary Climb 6-21-24
Consumer Sentiment: Summer Blues or Election Vibecession 6-14-24
Income Taxes for Tariffs: Dollars to Donuts 6-14-24
HY Spreads: The BB vs. BBB Spread Compression 6-13-24
HY Spreads: Celebrating Tumultuous Times at a Credit Peak 6-13-24
FOMC: There Can Be Only One 6-12-24