
Footnotes & Flashbacks: Asset Returns 7-7-24
We look at this past week’s asset returns as new highs for the S&P 500 and NASDAQ and a favorable UST shift offered relief from the noise.


We cannot fight a war with NVIDIA alone…
New record highs for the S&P 500 and NASDAQ joined with all positive numbers for the 7 bond ETFs we watch to deliver a week with 20 positive and 12 negative in the group of 32 benchmarks and ETFs we track.
We see 5 of 7 bond ETFs make it into the second quartile on the week with only GOVT and SHY off the pace in the third quartile.
Tech and Mag 7 heavy ETFs took 4 of the top 5 slots as Tesla put a big dent in its 6-month and LTM lagging performance with a +27% week.
Small caps (RUT) and Midcaps (MDY) were again in the red on the week and continue to lag the large caps in a sign of the recently narrowing breadth and some questions on a possible domestic stall in growth as more metrics are showing up with mixed signals across PCE, payrolls, ISM (manufacturing, services), and others.

With CPI and PPI out this week, the battle will continue for UST curve slope watchers, FOMC handicappers, and those looking to see if duration will finally have its day for bond allocations after a sub 1% YTD return of the IG bond index. As we detail below in the ETF updates, all 7 bond ETFs we track came up positive on a favorable UST curve move that we look at in our separate Footnotes publication on yields.
The benchmarks we watch each week in debt and equity are updated above, and everything in debt and equity came up positive for the trailing 1-month period except the Russell 2000 small caps (RUT), which is the only one coming up negative for 3 months as well. UST held in positive range over recent time horizons back to 1-year, but the optimism around a bullish move out the UST curve is hearing a lot of doubt even from many who are handicapping an FOMC cut by the fall. In credit, the holiday shortened week showed IG OAS tighter by 4 bps and HY wider by 9 bps.
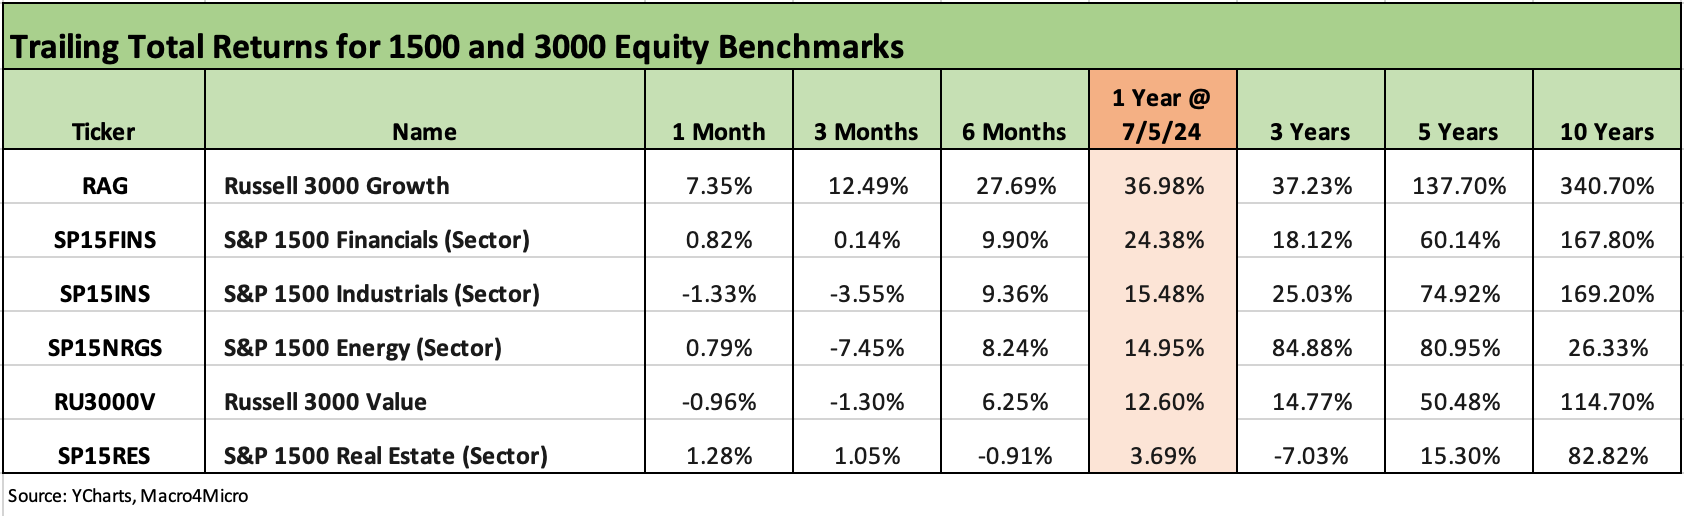
The above chart updates the 1500 and 3000 series, and the takeaway again is that growth still rules the roost. We see Industrials and Value softening. Financials are coming in positive but muted. We will get a wave of 2Q24 bank earnings and guidance at the end of this week and into next, and that should offer a lot of color on the state of provisioning, consumer credit trends, real estate issues, and loan demand.
The rolling return visual
In the next section we get into the details of the 32 ETFs and benchmarks for trailing periods. Below we offer a condensed 4-chart view for an easy visual before we break out each time period in the commentary further below. This is a useful exercise we do each week looking for signals across industry groups and asset classes.

The above chart shows a shift back to a more positive bias in 1-week and 3-months and a similar mix in 1-month favoring positive returns. The 1-year mix continues to post a very positive balance with another 30-2 score. The long duration 20+Y UST ETF (TLT) remains in the red along with the long-suffering Transports (XTN).
The Magnificent 7 heavy ETFs…
Some of the benchmarks and industry ETFs we include have issuer concentration elements that leave them wagged by a few names. When looking across some of the bellwether industry and subsector ETFs in the rankings, it is good to keep in mind which narrow ETFs (vs. broad market benchmarks) get wagged more by the “Magnificent 7” including Consumer Discretionary (XLY) with Amazon and Tesla, Tech (XLK) with Microsoft, Apple, and NVIDIA, and Communications Services (XLC) with Alphabet and Meta having a sold week as detailed in the earlier bellwether table.

The above chart allows us to track some headline mega-names and see which might have wagged certain ETFs or the broader capitalization weighted benchmarks. We line up some of the major large cap Tech-centric names in descending order of total returns for the most recent week.
We include the S&P 500 and NASDAQ along with the Equal Weight NASDAQ 100 Equal Weight ETF (QQEW) and the S&P 500 Equal Weight ETF (RSP). A table of the big tech names from the Mag 7 to the broader collection of “headline types” streamlines the weekly review if one of the big ETF names is impacting performances.
For this past week, Tesla reminded everyone how treacherous it is to bet against the company with a +27% stock move higher by beating the consensus deliveries target for the quarter while still being down -4.8% YoY. That still leaves Tesla negative for the LTM period and the only one of the Magnificent 7 in the red zone. In second to last for the LTM above, Apple is the second to worst performer of the Mag 7 over that period at +18.9% with the S&P 500 at +27%. For the week, we see 6 of the Mag 7 ahead of the S&P 500 with only NVIDIA slightly behind.

The 1-week time horizon weighed in at 20-12 with the top quartile heavy on tech and Mag 7 biased ETFs including Consumer Discretionary at #1 on the back of a very big week for Tesla at +27%. NASDAQ and the Tech ETF rolled along at #2 and #3. The volatile Base Metals ETF (DBB) had another good week at #4 as DBB held in at #3 for the rolling 3-month time horizon after a choppy few weeks that dropped it into the middle of the group for 1-month. Communications Services (XLC) rounded out the top 5.
The bottom quartile was all negative this week with Homebuilders (XHB) again showing weakness with a spot in last place for the month. The housing trends have been signaling slower growth with an ample base of inventory in place completed and under construction and mortgage rates staying stubborn as we cover separately in yields (see New Home Sales: Pumping the Brakes 6-26-24). Small caps (RUT) and Midcaps (MDY) continue to lag while Regional Banks (KRE) appear to be bracing for earnings season. Energy exposure (XLE, XOP) also had a bad week as XOP also had a bad month.

The 1-month mix held in well again this week at 21-11. A heavy mix of tech and Mag 7 heavy ETFs were evident in the top quartile. The Tech ETF (XLK) held down #1, Consumer Discretionary (XLY) at #2, and NASDAQ at #3 before the income heavy Midstream ETF (AMLP) moved in with the Mag 7 heavy S&P 500 benchmark at #5. The lack of breadth shows up again for 1-month with the S&P 500 in the top quartile and the Equal Weight S&P 500 ETF (RSP) in the bottom quartile.
On the bottom, we see Homebuilders (XHB) in dead last and still hanging around the bottom of the 3-month ranks at second to last (up from last place the prior week for the 3-month running returns). Builders have now fallen out of the LTM top quartile. Small caps and Midcaps are also in the red and in the bottom quartile.
For the1-month period, the only bond ETF in negative range is the long duration 20+ Y UST (TLT) with the other 6 positive but only HYG and SHY in the second quartile and the other 5 in the third quartile (EMB, LQD, AGG, GOVT, TLT).

The 3-month time horizon shifted materially more to a positive balance at 23-9 from 13-19 last week. Tech and Mag 7 heavy ETFs are driving the top quartile mix, and we see NASDAQ at #1, Tech (XLK) at #2, the S&P 500 at #4, and Communications Services (XLC) at #5. Consumer Discretionary (XLY) was at #8 on very strong Tesla 3-month numbers (+52%). Breaking up that pack at #3 was Base Metals (DBB) with its recent run.
Among the notables in the leader pack is the BDC ETF (BIZD) at #6 as high cash yields, a resilient credit cycle, floating rate stability, and a lot of headlines for private credit keeping BDCs on most radar screens and notably for income investors.
The bottom of the 3-month lineup includes Energy (XLE, XOP), Builders (XHB), Transports (XTN), Industrials (XLI), Small caps (RUT), and Midcaps (MDY). That mix of underperformers is not a great sign for cyclical optimism in US-centric markets.

A good year, a major rally to wind down 2023, and steady strength for much of 2024 is hard to shake, and the LTM lines weigh in at 30-2 again. The usual tech and Mag 7 heavy benchmarks are in the top quartile mix with XLK at #1, XLC at #2, and NASDAQ at #3, but income heavy AMLP and BIZD also make the leader group. Financials (XLF) will get a test with the coming wave of earnings reports late this week and next.
For the bond ETFs, we see 5 of 7 in the bottom quartile and HYG and EMB across the line in the third quartile. HYG was the best of the bond ETFs in the LTM period at 10.7% on less duration exposure, decent coupon income, and spread tightening. Only TLT remains in the red during a rough period for duration overall but a good one for credit quality.
See also:
The B vs. CCC Battle: Tough Neighborhood, Rough Players 7-7-24
Payroll June 2024: The Race Gets Confusing 7-5-24
JOLTS May 2024: The Jobs Oasis Still Has Water 7-2-24
Footnotes & Flashbacks: Credit Markets 7-1-24
Footnotes & Flashbacks: State of Yields 6-30-24
Footnotes & Flashbacks: Asset Returns 6-30-24
State Unemployment: A Sum-of-the-Parts BS Detector 6-30-24
The Debate: The China Deficit and Who Pays the Tariff? 6-29-24
PCE, Income and Outlays: Practicing Safe Growth? 6-28-24
HY Spreads: The BB vs. BBB Spread Compression 6-13-24
HY Spreads: Celebrating Tumultuous Times at a Credit Peak 6-13-24
Trade Flows: More Clarity Needed to Handicap Major Trade Risks 6-12-24
Miscellaneous histories:
Systemic Corporate and Consumer Debt Metrics: Z.1 Update 4-22-24
Credit Markets Across the Decades 4-8-24
Credit Cycles: Historical Lightning Round 4-8-24
Histories: Asset Return Journey from 2016 to 2023 1-21-24
HY vs. IG Excess and Total Returns Across Cycles: The UST Kicker 12-11-23
US Debt % GDP: Raiders of the Lost Treasury 5-29-23
Credit Performance: Excess Return Differentials in 2023 1-1-24