
Footnotes & Flashbacks: State of Yields 7-7-24
We look at another week with a duration friendly UST move, but the CPI and PPI numbers loom as 2Q24 earnings season begins.


They told me he could help us find the path to easing?!
The next round of CPI and PPI numbers still won’t help the markets find the road to 2.0% until shelter cooperates, demand pulls back on the throttle, and some services start to see pricing power diminish.
The UST inversion remains stubborn as fed funds approaches the 1-year anniversary of the last hike in late July 2023.
We update the 5Y to 30Y slope history as at least that segment of the UST curve is upward sloping.

Note: As a reminder, we split out the Credit Markets portion of the weekly Footnotes & Flashbacks into a separate publication (starting 6-23-24). We now have Asset Returns, State of Yields, and Credit Markets. We published a separate detailed commentary on CCC tier histories earlier today (see The B vs. CCC Battle: Tough Neighborhood, Rough Players 7-7-24). We will publish the Footnotes Credit Markets publication tomorrow.
The above chart updates historical UST curves for some key dates across the cycles from the 1978 mini-inversion across the Volcker inflation fighting war, the 1989 credit cycle peak, the TMT market peak of 2000, the 2006 calendar year peak for the housing market and leveraged finance bubble, the post-tightening UST 10Y UST peak (Oct 2023), and the latest UST from this past week.
The chart frames a range of UST across the cycles that are outside the world of ZIRP and QE. In other words, we exclude the period from the credit crisis until the tightening cycle of 2022 was well underway into the fall of 2023 with the July 2023 hike in place.
The picture tells a story that current UST rates are in fact quite low in historical context, and there has never been an inversion quite like this at such low interest rates in any prior cyclical peaks. We are in the first inflation war since Volcker and the economic backdrop could not be more different than 1979 transitioning into 1980 and the double dip recession with all of the stagflation and monetary aggression.

The above chart shows the running UST deltas from the 10-19-23 peak through last week. We also break out the running YTD deltas as the upward shift retraces some of the monster rally that drove bonds in Nov-Dec 2023 and helped give a lift to equities as well. During 2024, equities obviously were able to push right through the adverse UST shift.

The above chart updates some of the key timelines for UST migration from the end of 2021 across the tightening cycle through this past week’s close on Friday. We include a memory box with the dates and details of the FOMC actions.
The convergence of the 12-31-22 and 12-31-23 UST curves further out the maturity spectrum, despite a 100 bps differential in fed funds, will be the constant reminder to not take for granted that an FOMC cut will necessarily pull down longer UST rates.

The above chart frames the weekly UST deltas across the curve in another favorable move notably from 1Y to 7Y in double digits.
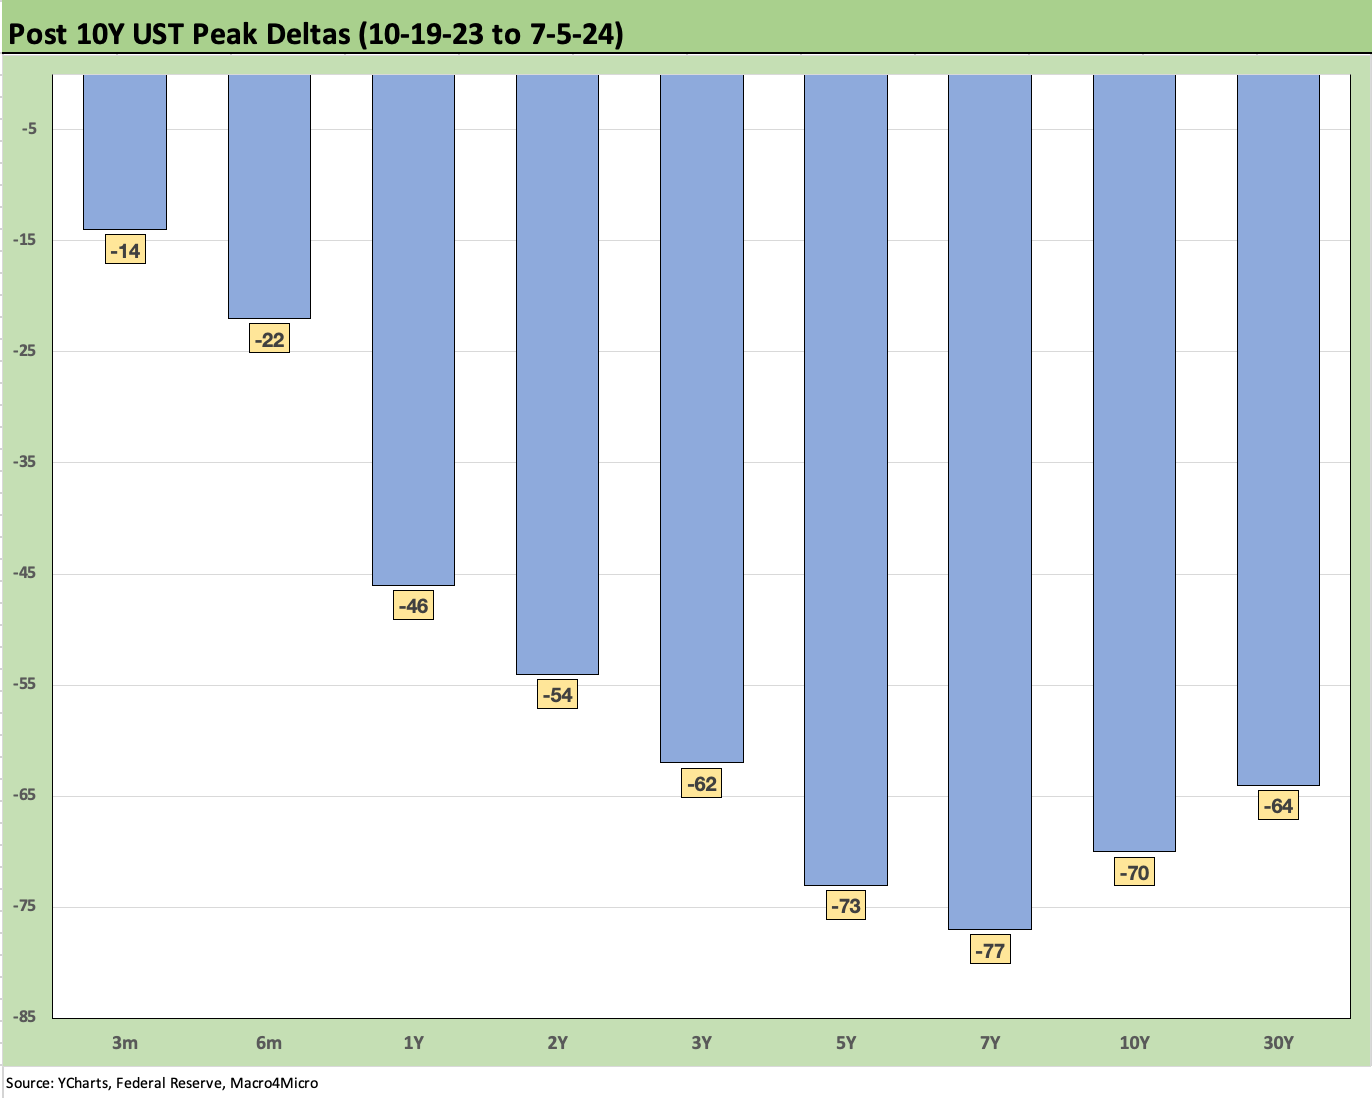
The above chart just offers another visual on the UST deltas since the peak UST curve of 10-19-23. The inversion from short to intermediate continues to stand out in the context of prior cycles and notably in expansion periods. There has basically been nothing quite like it in the modern capital markets. The whipsaws under Volcker were mostly in periods of contraction and very high absolute rates. Average inflation was much higher from 1979 to 1981 with the recession trough in late 1982.

The above chart offers another visual on the YTD UST deltas. The relatively poor (at best disappointing) performance of IG bonds is easy enough to explain with duration the main victim in total returns.

The above chart updates the Freddie Mac benchmark, and we see a minor uptick sequentially from 6.86% the prior week to 6.95% this week.
For some historical comparison, the chart includes comps of the Freddie benchmarks (horizontal lines) from the peak homebuilding year of 2005 and from mid-2006 when RMBS disarray was showing up on the screens. We also include the UST curve for each period and show how anomalous the inversion is in context.
The current mortgage rates are the highest of the three comps even as the UST 10Y currently is the lowest.

The above chart updates the 5Y to 30Y UST slope across the timeline from 1984. The current upward sloping UST slope of +25 bps is well inside the long-term median of +72 bps. It is also the only one of these segments that is currently upward sloping.

The above chart shortens the time horizon on the 5Y to 30Y shapeshifting to capture the more granular moves across the post-March 2022 tightening cycle. We see the peak slope of +163 bps back in Feb 2021 before the plunge down to -43 bps in Sept 2022 before a whipsaw and return to -46 bps in March 2023. The “steepening toward a flattening” has now resulted in an upward slope from 5 years.
The FOMC handicapping on how the flatter curve will arrive remains a debate as do the questions of who wins and who loses and where on the UST curve. There are ample scenarios where the front end moves lower while the longer UST moves higher.
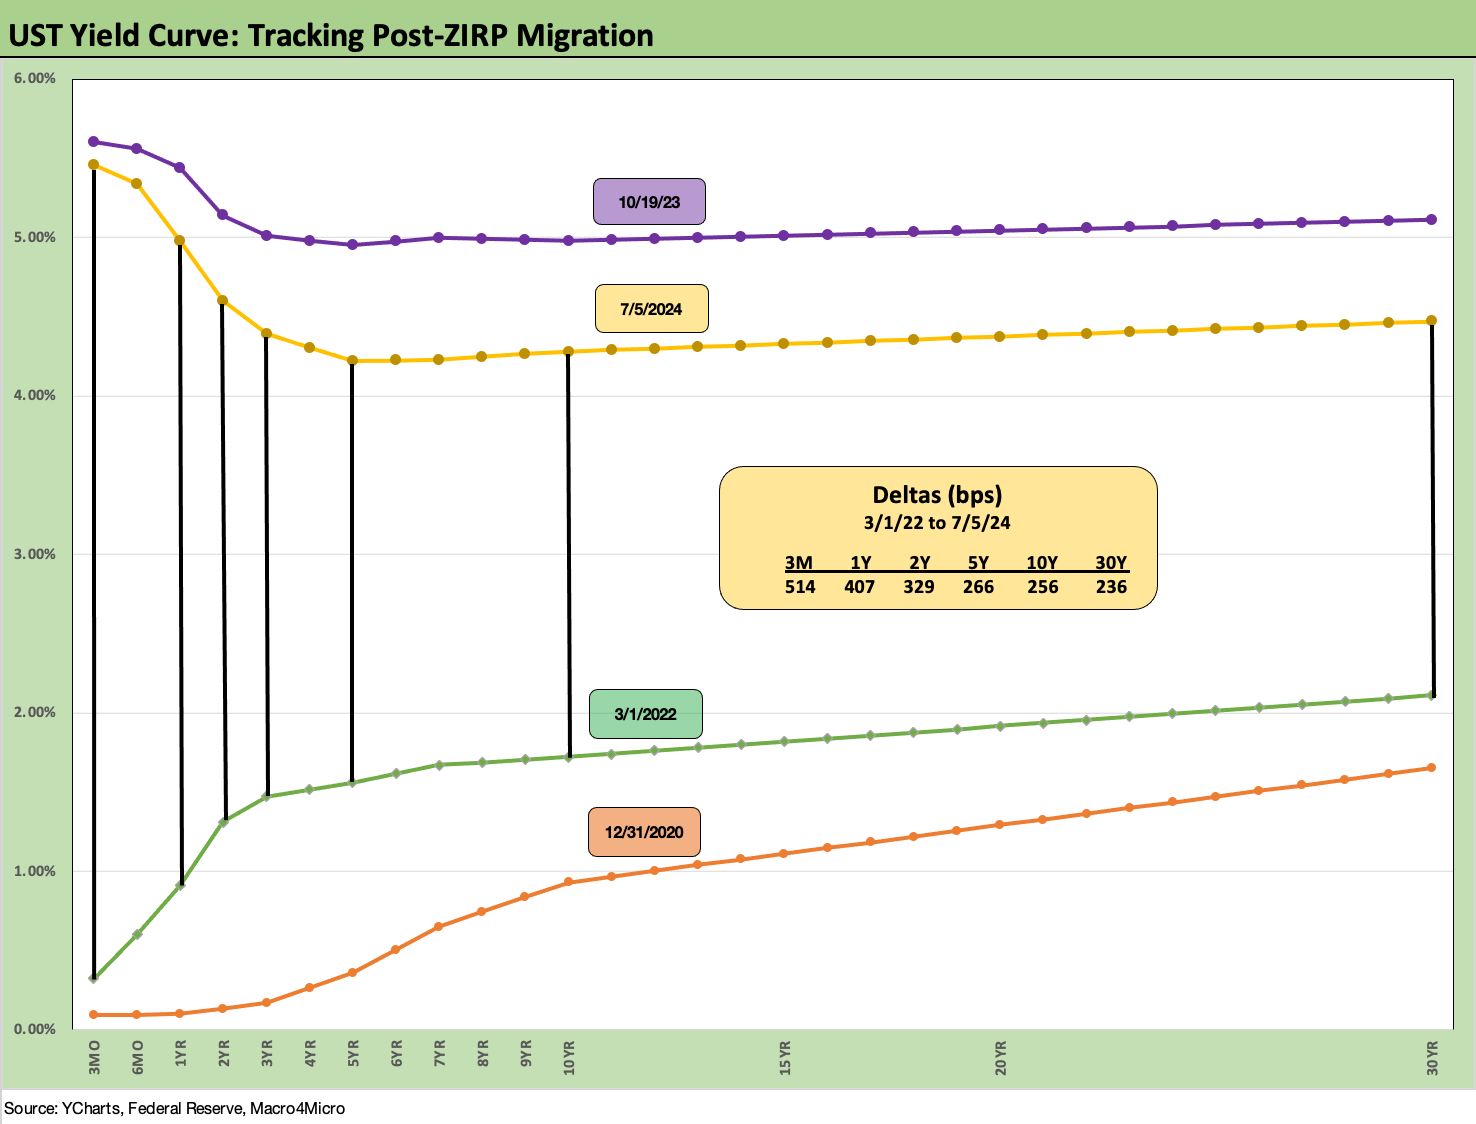
We wrap with our usual UST delta chart that tracks the changes from March 1, 2022, which is the month when ZIRP ended (effective 3-17-22). We also include the UST curve from the 12-31-20 date as the year of COVID came to an end and the 10-19-23 UST peak in 10Y.
The migration across a bear flattener into a bear inversion now has given way to debate over a bull steepener overall or a bull steepener on the front end with a bear’s head on the long end. Next week we’ll look for a gryphon.
We await the next round of CPI and PPI data this week and some more color from the banks on what they are seeing from the consumer and middle market borrowers, real estate performance, and loan loss provisioning needs.
See also:
Footnotes & Flashbacks: Asset Returns 7-7-24
The B vs. CCC Battle: Tough Neighborhood, Rough Players 7-7-24
Payroll June 2024: The Race Gets Confusing 7-5-24
JOLTS May 2024: The Jobs Oasis Still Has Water 7-2-24
Footnotes & Flashbacks: Credit Markets 7-1-24
Footnotes & Flashbacks: State of Yields 6-30-24
Footnotes & Flashbacks: Asset Returns 6-30-24
State Unemployment: A Sum-of-the-Parts BS Detector 6-30-24
The Debate: The China Deficit and Who Pays the Tariff? 6-29-24
PCE, Income and Outlays: Practicing Safe Growth? 6-28-24
HY Spreads: The BB vs. BBB Spread Compression 6-13-24
HY Spreads: Celebrating Tumultuous Times at a Credit Peak 6-13-24
Trade Flows: More Clarity Needed to Handicap Major Trade Risks 6-12-24
Miscellaneous histories:
Systemic Corporate and Consumer Debt Metrics: Z.1 Update 4-22-24
Credit Markets Across the Decades 4-8-24
Credit Cycles: Historical Lightning Round 4-8-24
Histories: Asset Return Journey from 2016 to 2023 1-21-24
HY vs. IG Excess and Total Returns Across Cycles: The UST Kicker 12-11-23
US Debt % GDP: Raiders of the Lost Treasury 5-29-23
Credit Performance: Excess Return Differentials in 2023 1-1-24