
Footnotes & Flashbacks: Credit Markets 6-9-25
Another rally week in credit brings spreads back to below 2018 cyclical lows as the macro picture signaled slow tariff impacts.


Which one has the trade war?
Spreads tightened across the ratings tiers last week with US IG tightening -4 bps and US HY tightening -22 bps, in line with equity benchmarks (see Mini Market Lookback: Clash of the Titans 6-7-25). The CCC tier bucked the trend widening +19 bps, weighed on by DISH bond underperformance amidst rumors of EchoStar Ch. 11 filing.
Tariffs remain the overriding factor in risky asset performance with the Big Beautiful Bill as critical variable #2. JOLTs and payroll data this week provided enough confidence that the impacts are in slow digestion mode rather than rapid indigestion (see Payrolls May 2025: Into the Weeds 6-6-25, Employment May 2025: We’re Not There Yet 6-6-25, JOLTS April 2025: Slow Burn or Steady State? 6-3-25). We await some commentary on today’s trade meeting between the US and China in London.
The market will see May data for CPI and PPI this week, and that could spark another round of debate on the breadth and magnitude of tariffs with the massive Section 232 pipeline and the resolution of the reciprocal tariff pause still ahead. The headlines often get misused by people in the administration who should know better on tariff impact timing and working capital cycles. The color from the industry sea level and various trade organizations is telling a negative story on tariff economics (price and cost impacts) and especially for small businesses who lack flexibility (see Footnotes & Flashbacks: State of Yields 6-8-25).
Barring another impulsive change to trade policy, budget legislation means a lot is at stake given the projected increases to budget deficits as a % of GDP and forward-looking expectations for debt % GDP. Basic supply and demand dynamics for US Treasuries will be a challenge.
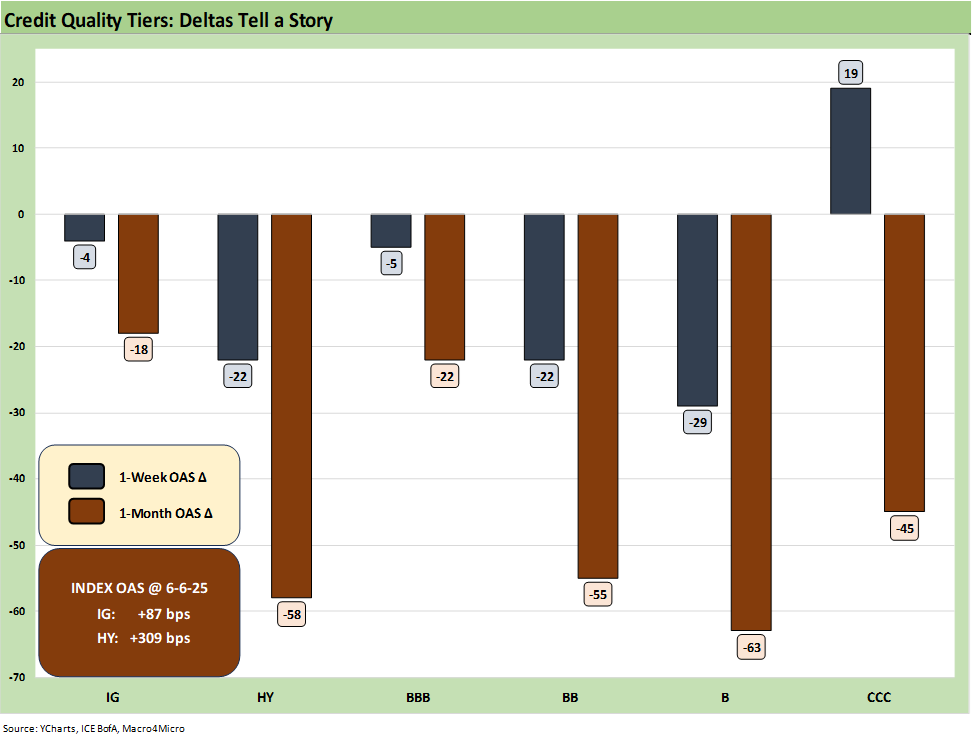
The 1-week and 1-month spread deltas across the ratings tiers are shown above with a -4 bps tightening in US IG and -22 bps tightening in US HY. Even with the Musk-Trump feud in the background, the positive news from JOLTs and payrolls and positive news on US-China trade talks were enough to reignite the rally. CCC is the only tier that did not see tightening on the week as pressure on DISH bonds was enough to pull the index wider.
The 1-month moves above still show the lasting relief rally in the wake of the initial tariff scare. As a reminder, spreads went as wide as +120 bps for US IG and +461 bps for US HY at the peak of the widening. Altogether, the whipsaw this year leaves spreads at +5 bps wider YTD for US IG and +17 wider YTD for US HY.
These current levels once again leave risks skewed to widening with so many trade issues still outstanding. The CPI and PPI releases this week provide another angle on where tariff effects have translated to transaction cost impacts and read through to how effectively they are managed so far. The expectation is that the slow burn nature will continue. The March and early April jitters in credit spreads showed the usual defensive reactions when equities get whipsawed, but the transmission mechanism to economic contraction and a default cycle is a much slower process. A total breakdown with China would accelerate that transition, but Trump appears to be ducking that worst case risk scenario.
The list of macro level risks grew again over the weekend with further governance concerns ignited with sending the National Guard into LA and threatening the use of Marines. Though it may not move the needle itself, it brings governance into focus at a time when budget talks already are causing concerns around US sovereign debt levels.
Eroding faith in the reliability in the US economic game plan (growth vs. consolidation of political control) and basic government competencies is not a recipe for success in funding costs. It raises even more questions when so many trade issues are stuck in pause mode with deals still awaiting details across the majority of US trade volumes (see US Trade in Goods April 2025: Imports Be Damned 6-5-25, Mini Market Lookback: Out of Tacos, Tariff Man Returns 5-31-25).
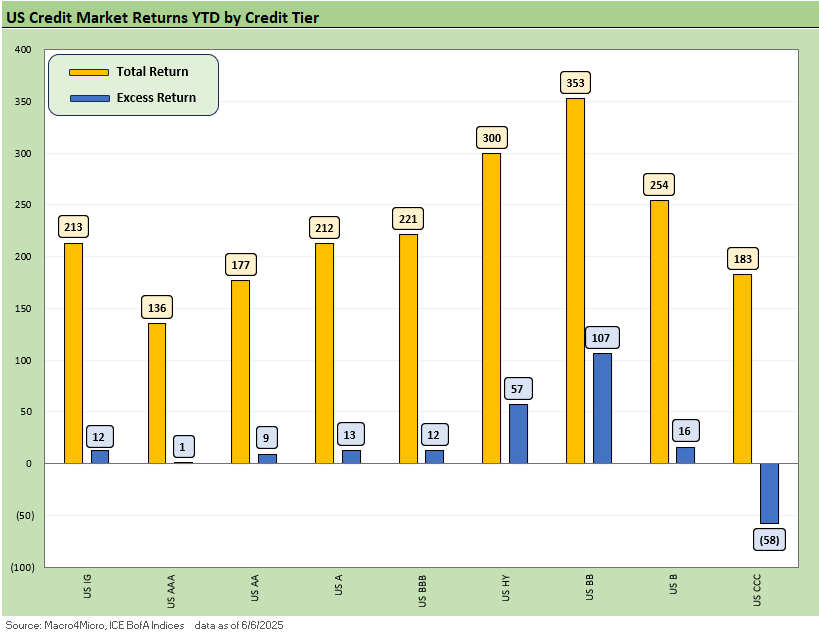
The return picture for the US credit markets shows continued improvement on the spread rally last week even with some detraction from the UST (see State of Yields). Excess returns have eked into positive territory across the board except for CCCs at -58 bps. BB remains the top excess return performer at +107 on YTD spread tightening and also tops total return given its curve exposure. That said, the 2025 YTD return picture still leaves a lot to be desired in an average total return year and barely positive excess return one.
The total return picture remains anchored by the 2Y-10Y rally YTD on UST and the outstanding discourse on the Big Beautiful Bill leaves a lot of risk in the market. IG return volatility thus remains high on curve risk with UST supply-demand dynamics back in question. This comes at a time when the largest foreign holders are being treated poorly in trade talks and the compounding risks leave plenty to worry about.
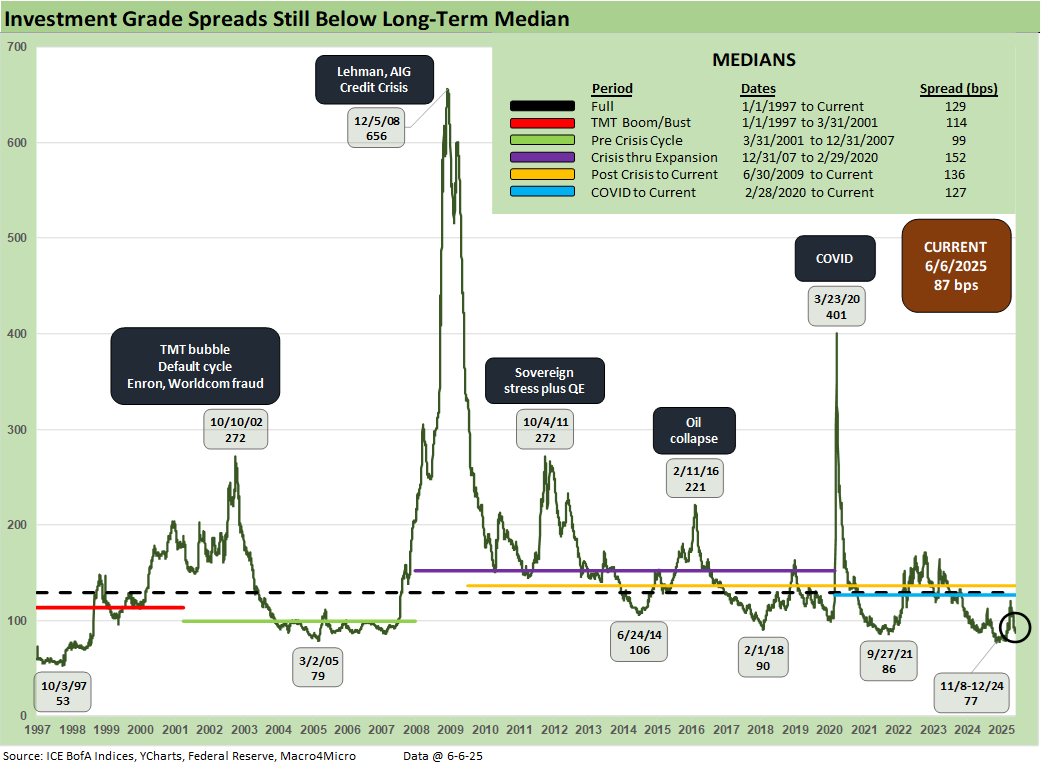
US IG spreads ended the week -4 bps tighter, well into the double-digit territory and +5 bps wider YTD. Spread moves for IG are increasingly insulated from tariff driven volatility, but the budget discussions place renewed pressure on spreads. With so many outstanding risks towards the long end of the curve, one only needs to flash back to 2022 to remember what kind of pain could ensue. This IG OAS level is likely a challenge to sustain with stagflationary risks heightened and new tariff headlines continuing to roll in (pharma, semis, aircraft/parts, lumber, copper etc.). Without clear signs, spreads remain range bound for now ahead of a busy summer.
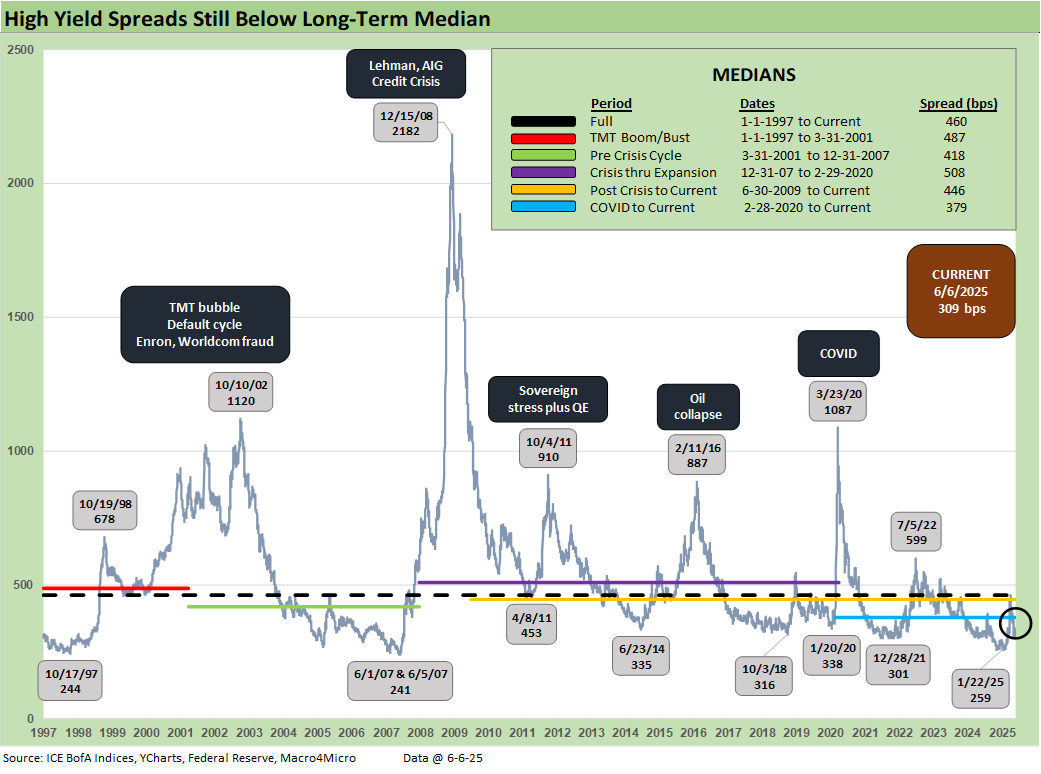
This week saw -22 bps of tightening for US HY down to +309 bps with spreads returning to the low +300 range. This week’s rally sees spreads below the 2014 and 2018 cyclical lows and need a lot to go right on the trade front to remain at these compressed levels. The pain came quickly in late 2018 with the Fed having leeway to come to the rescue in 2019. The extent of inflationary pain may curb their ability to do the same this time around if payroll impact lags as the impact of tariff policies largely remains a question mark (see Past-Prologue Perspective for 2025: Memory Lane 2018 6-5-25).
With a higher quality index now vs. past cycles, the recent history includes a stretch below the +300 bps OAS mark with the recent January low of +259 bps very close to the June 2007 lows.
As with US IG spreads, we struggle to see the resolution of trade issues without further hiccups. US HY spreads remain vulnerable to more volatility even if they continue to grind tighter until the headlines come. US-China talks moved in a positive direction last week but there is still more downside risk on trade deal outcomes with key partners as the 90-day pause windows start to elapse. Even if Trump extends pauses, the reality is that also can delay capital budgeting planning and slow consumer demand even more than we already have seen.
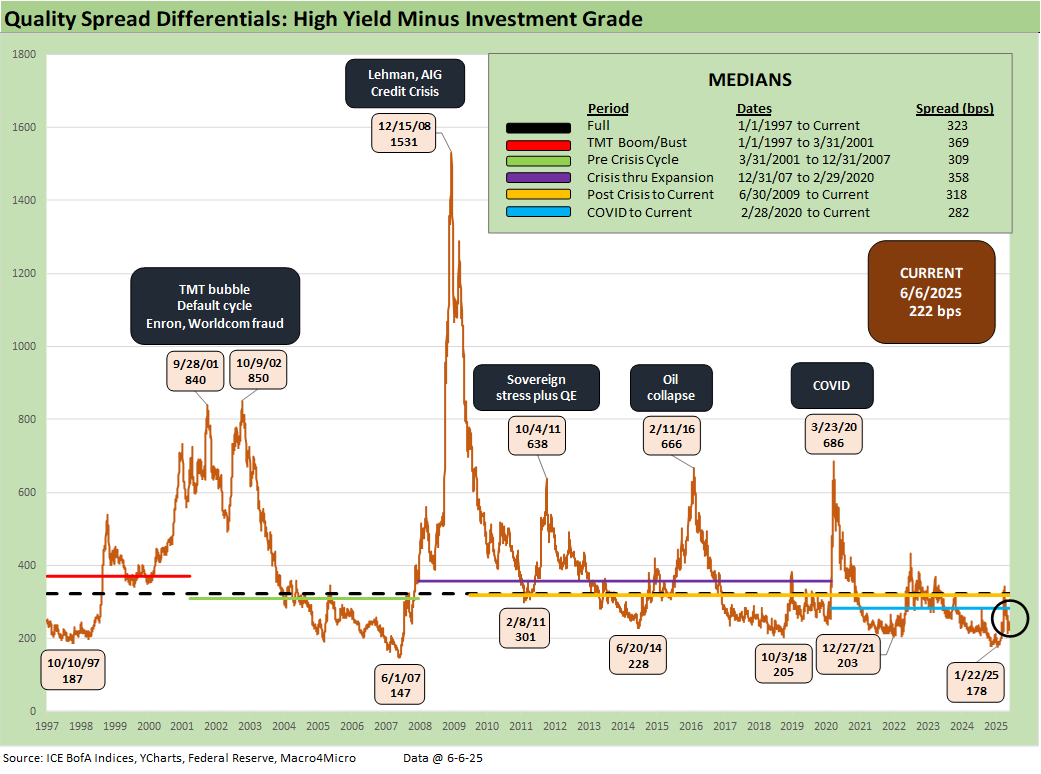
The differential between HY OAS and IG OAS (quality spreads) narrowed -18 bps this week as spreads rallied. This level remains tight in historical context, but the recent period sees these sharing a closer relationship given the IG quality shift towards BBB and HY quality skew towards BB. The decrease this week leaves this measure well inside the post-COVID median and now below the 2014 low of +228 bps but there is still room to the frothiest periods of cyclical histories. The +147 bps in June 2007 in the chart was one for the ages.
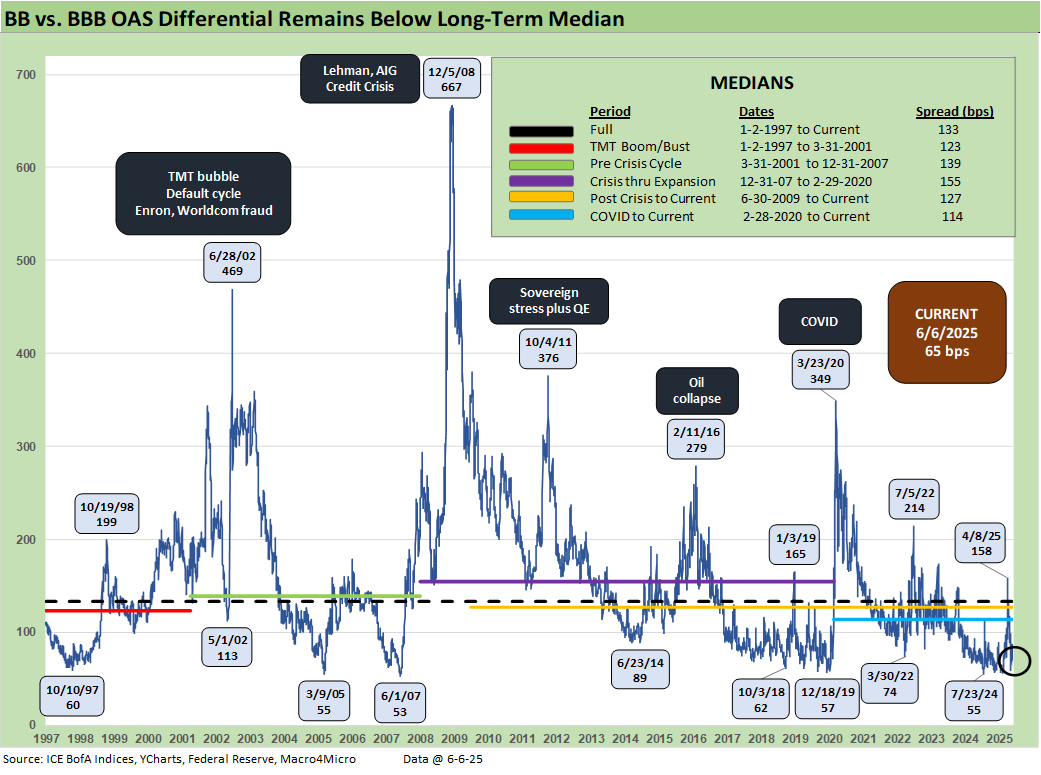
The “BB OAS minus BBB OAS” quality spread differential tightened -17 bps this week with a material BB move. The large move this week leaves this quality spread measure only +12 bps from the all-time low in 2007. This metric has stayed lower in recent history given the convergence in credit quality of the tiers and the core investor base, as the post-COVID history shows. At current levels we are one or two rally weeks away from record lows in this metric.
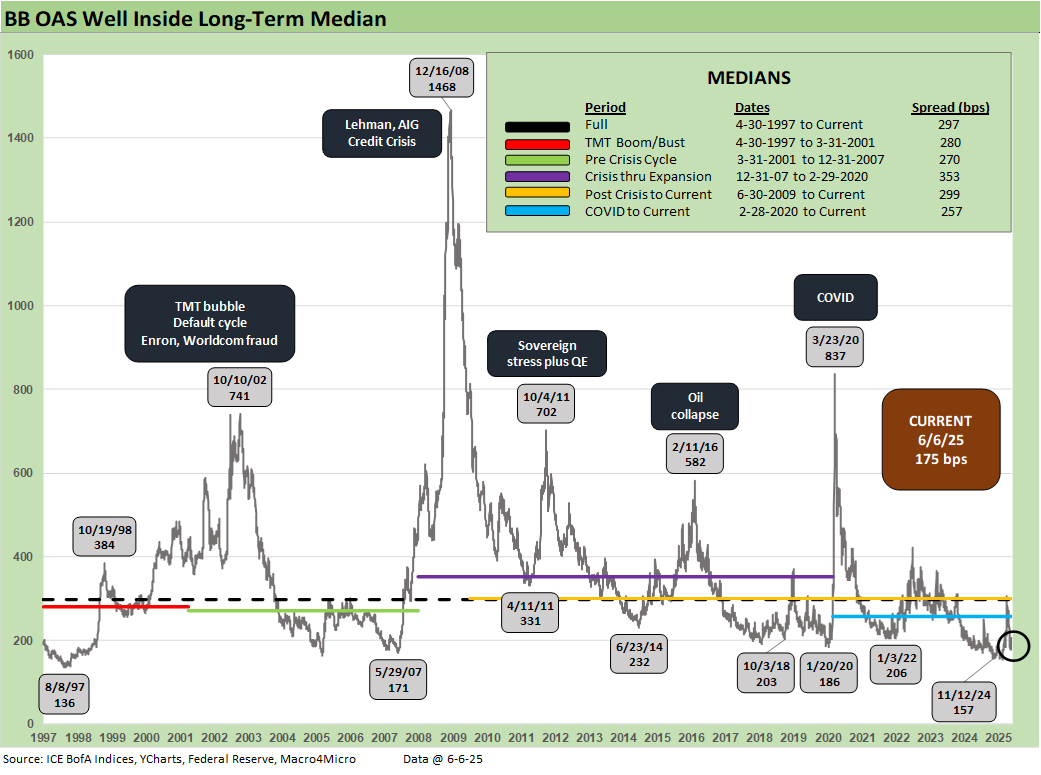
The BB tier tightened -22 bps since last week to +175 bps, well below the 2014 and 2018 cyclical lows and closer to levels seen in May 2007. The combination of low duration and a high-quality diverse mix of BB tier names leads to this being the best performer in credit this year. We had earlier addressed the decent total return performance and positive excess return given only -11 bps of tightening YTD.
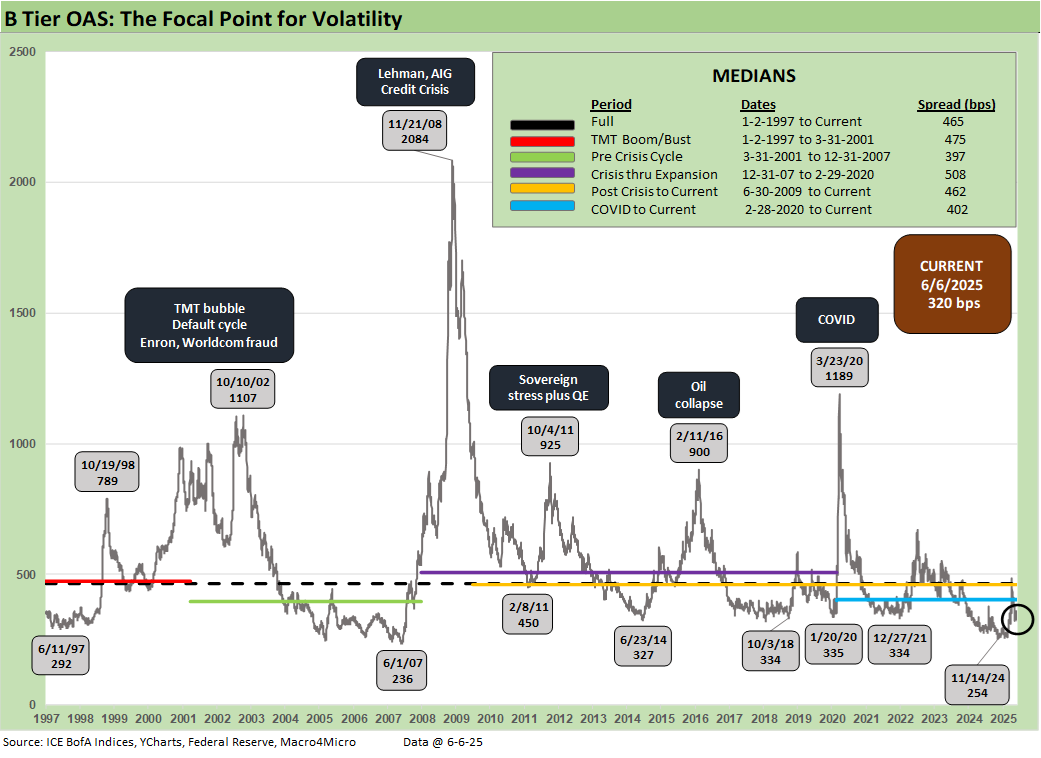
The B tier tightened -29 bps this week down to +320 bps. The reciprocal tariff whipsaw reminded the market how volatile this layer of credit can be as spreads briefly moved above the long-term median at +486 bps. The relief rally has recovered -167 bps tighter since. The current level returned back below 2014 and 2018 lows. At only +24 bps wider YTD, the risks appear skewed to widening again. We see these levels as offering inadequate compensation for the array of trade risks still in the market.
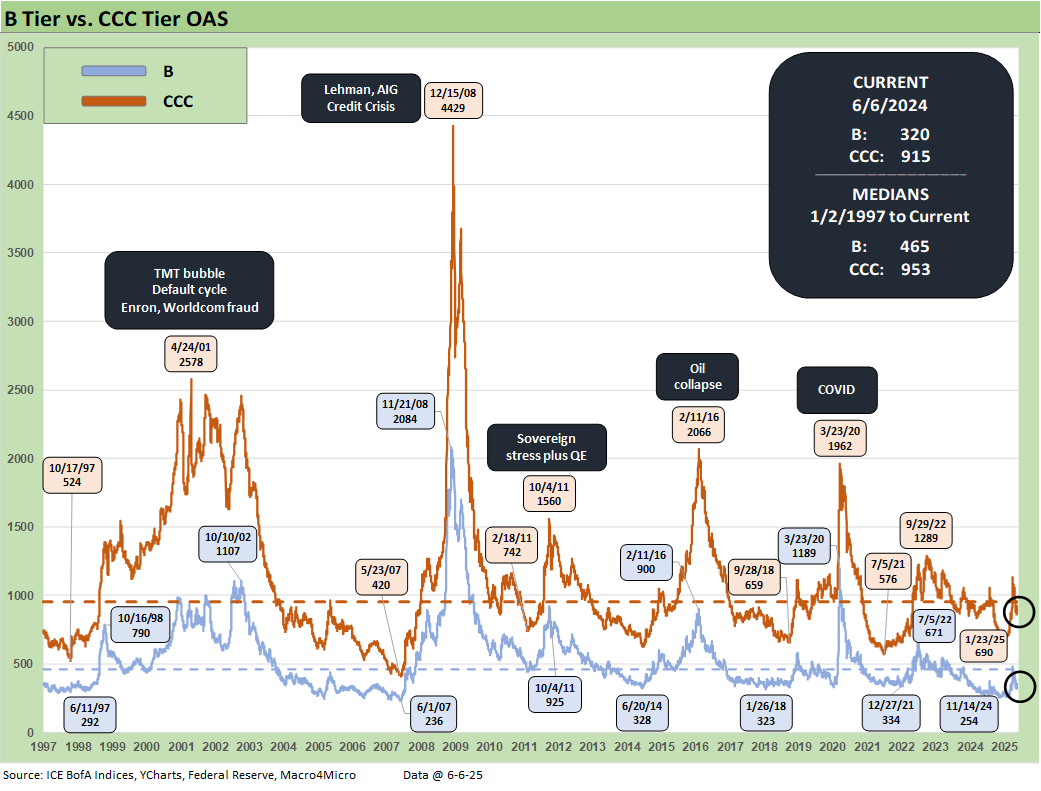
The B vs. CCC tier OAS time series is plotted above. The timeline for B and CCC spreads highlights the points of major divergence along the way (see The B vs. CCC Battle: Tough Neighborhood, Rough Players 7-7-24).
The current CCC tier OAS at +915 bps widened by +19 bps the past week though remained under the long-term median of +953 bps. The CCC YTW is just above the 13% line at 13.36% after being above 14% just last month, but the underlying constituents are widely dispersed across an 81.67 composite dollar price. The CCC tier is still in the pricing zone of equity risk-returns with such yields.
CCC investing at this point demands careful capital structure analysis and rigorous issuer-level relative value research with DISH Network a prime example of that this week. Subject to how the tariff policies play out and how the stagflation wildcard unfolds, the distressed players are warming up. Costs will still be rising even as pauses and deals start to roll in at some point.
The tariff wildcards for spread decompression…
The recent volatility was a brief reminder of the kind of B vs. CCC divergence that can happen in a hurry as markets reprice. Further tariff chaos still has the potential to repeat that volatility with recent US-China truce and EU tariffs flashpoints that are avoided for now.
The US has been getting a taste of what China trade means as shipping and port activity was in semi-collapse and the countdown to empty shelves was highlighted by major retailers. More recently, the production chain warnings and rare earths and magnet shortages was showing alarming threats highlighted by numerous companies and in the auto trade literature. It was framed as more threatening than the post-COVID semiconductor shortages that reduced auto production by 17 million units from 2021 to 2023 (source: Automotive News). The fact that semis are on the Section 232 list will keep a lot of risk in the picture ahead.
The potential economic damage that could come in the summer and into the fall is still a gathering storm with the wide array of tariffs in the queue. The scale of the China shutdown was more immediate and far more serious, and you cannot rule out that chaos coming back. A 50% EU tariff could have seen similar dislocation for many industries. At least the more extreme outcomes are lower probability (for now), and those hits to prices and expense lines are mitigated (but can be revisited in a tit-for-tat retaliation scenario).
Another increase in Section 232 tariffs on Steel and Aluminum raised the bar again for retaliation from major partners, especially EU and Canada (see Tariffs: Testing Trade Partner Mettle 6-3-25). We would argue that there is nothing quite like the China risk that was in evidence before the truce even if China is the #4 trade partner and EU #1.
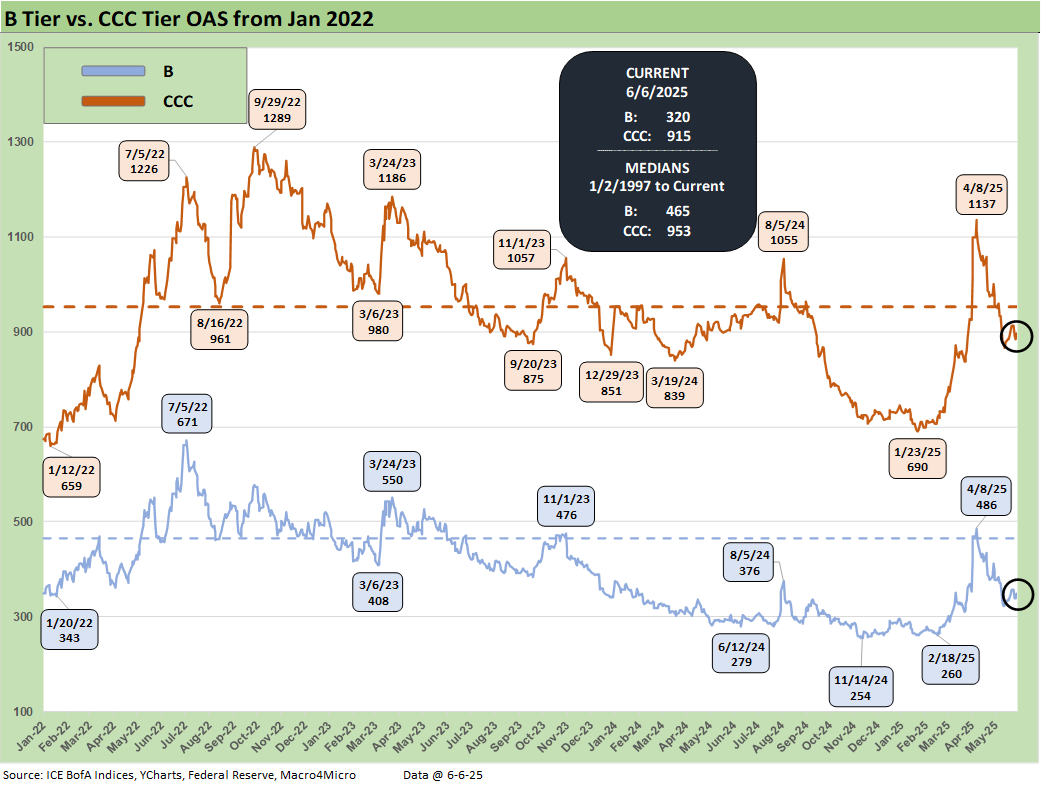
The shorter timeline from Jan 2022 just ahead of the end of ZIRP and start of the tightening cycle gives better granularity on the movements from a low for CCCs of +659 bps in Jan 2022 to a peak of +1226 bps in July 2022 and +1289 bps to end Sept 2022. Then spreads came down to the Jan 2025 tights of +690 bps ahead of the recent spike and whipsaw to current levels.
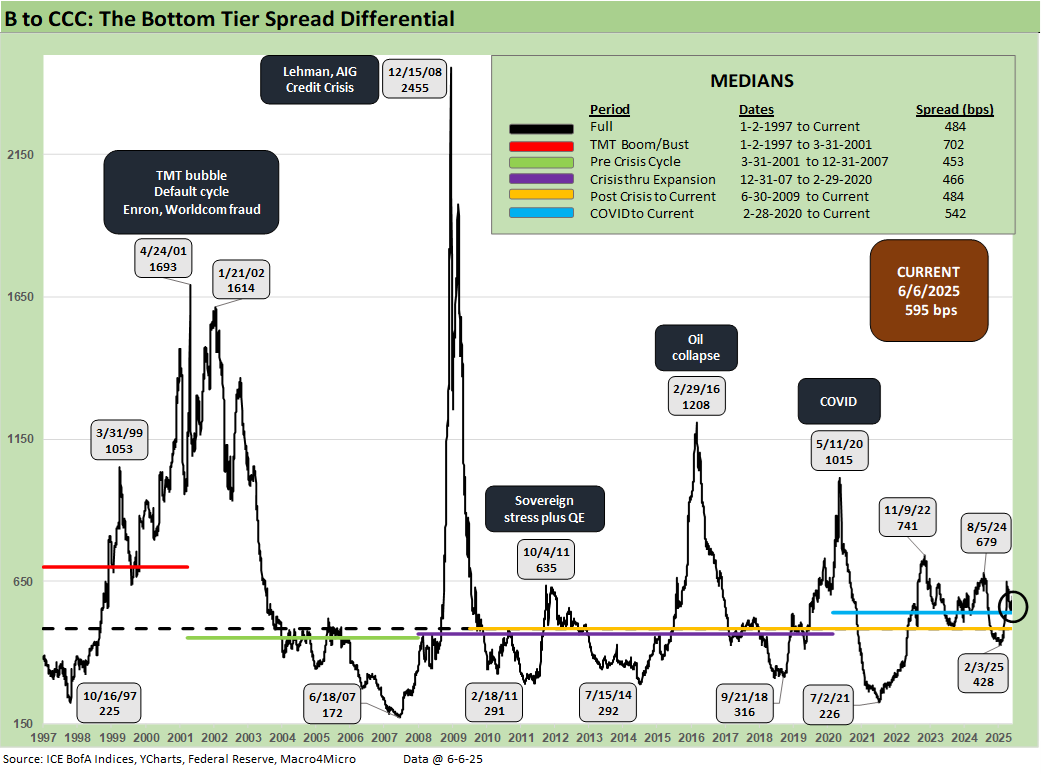
The B vs. CCC tier differential is broken out with the current +595 bps still higher than the long-term median and above the distinct market time horizons with the exception of the TMT HY credit cycle with its +702 bps median. The risks this year have seen CCC tier spreads remaining wider after the earlier whipsaw even as the rest of the tiers have rallied.
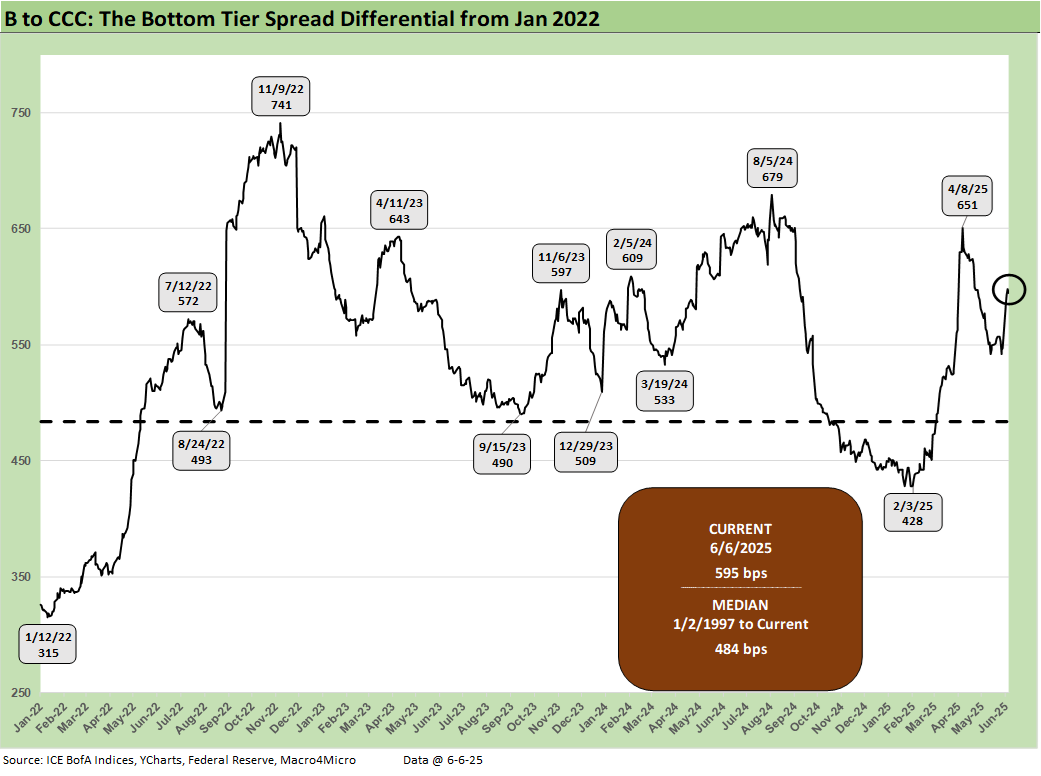
The above chart frames the “B vs. CCC tier” quality spread differential across the short timeline for better granularity. Spreads widened with a vengeance since the low of Feb 2025 at +428 bps even if quality spreads recovered from the early April spike to +651 bps on April 8.
A look at yields…
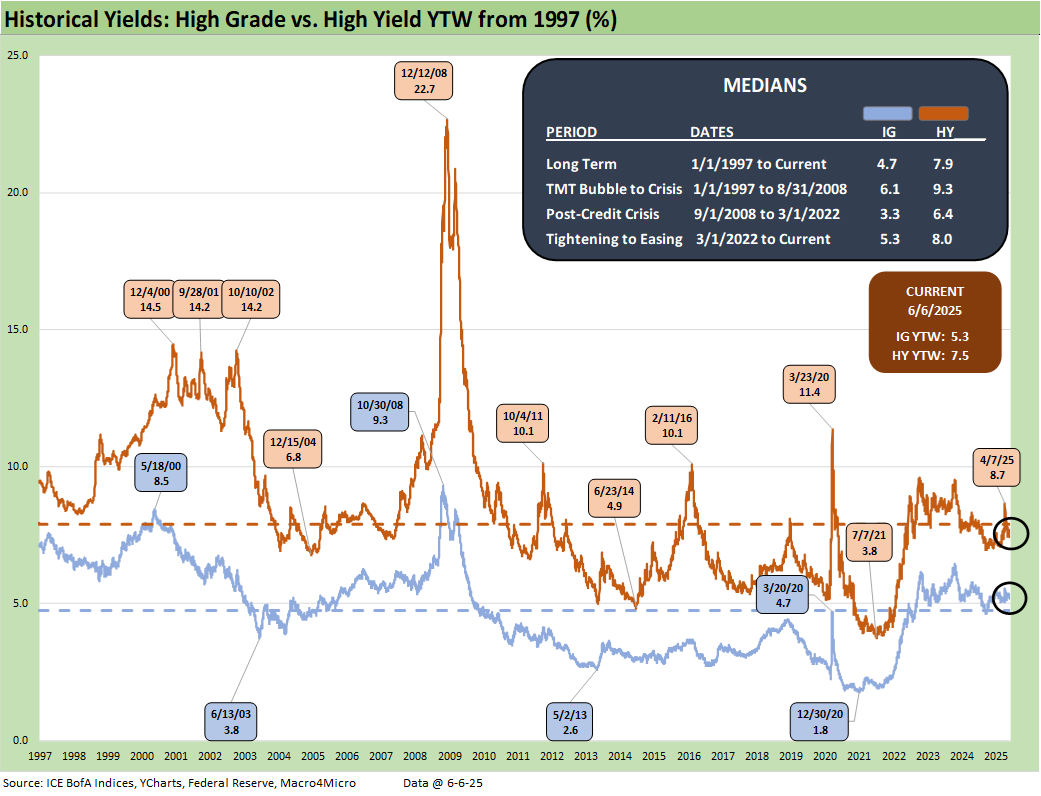
Moving away from spreads, which are well below long-term medians this week, yields for both IG and HY have a more complex story in historical context given the post-crisis distortions of ZIRP and “normalization.” The normalization period of Dec 2015 to Dec 2018 never really got on track with the economic weakness and Fed easing of 2019 followed by a COVID crisis and return to ZIRP in Mar 2020 (ZIRP ended March 2022).
The current IG YTW at 5.30% (vs. 5.21% last week) increased as the UST increase offset spread tightening but remains below the 6.1% pre-ZIRP median on overall YTD UST curve moves.
The HY YTW decreased to 7.45% (from 7.48%) vs. a pre-ZIRP 9.3% median. We consider the pre-ZIRP years the most rational frame of reference in light of the post-crisis ZIRP and QE as well as the COVID Fed reactions.
Spreads will remain a key swing factor for reaching those yield medians of pre-ZIRP years, and we just saw material volatility in credit risk pricing in HY since early April. UST yields are a tougher call with the tariff backdrop that still threatens stagflation as well as the potential for further technically driven upward UST curve shift on the supply-demand fears.
Stagflation risk remains in the debate. Away from stagnation + inflation, old fashioned recession risk would pressure UST rates lower and credit spreads higher, but this is no ordinary cyclical turn. We cover the UST shapeshifting in our separate Footnotes publication on yields as the UST curve rose this week on the economic data.
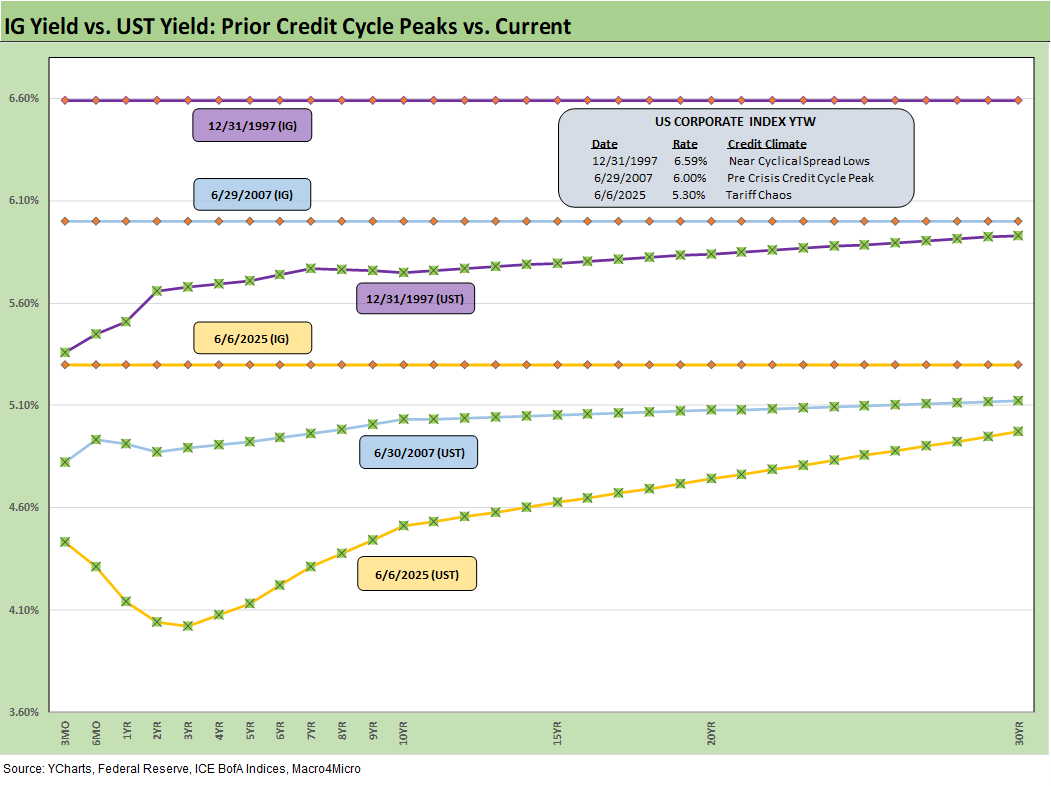
The above frames current IG index yields vs. previous credit peaks along with their respective UST curves. We include both prior credit peaks in June 2007 and Dec 1997 for context as prior peak credit cycles when high risk appetites saw investors chasing yields. Those 1997 and 2000 markets saw poor risk symmetry and low spreads.
Today’s UST curve is still low in those historical credit peak contexts. We just saw a glimpse recently of rising long yields and the return pain that comes with it. Continued focus on the budget this week will return that risk into focus given the possible size of deficit increase. Stagflation risks stay in the mix with the current market beyond the credit cycle peak after the tariffs, and long dated yields still could go higher with spreads widening again for another round of return pain.
The short to intermediate IG market is still the safest bond game for now. The funds that are asset class constrained to HY can take refuge in the higher quality layers, but overall corporate default risks in HY bonds remain in check (private credit is its own distinct story and mix).
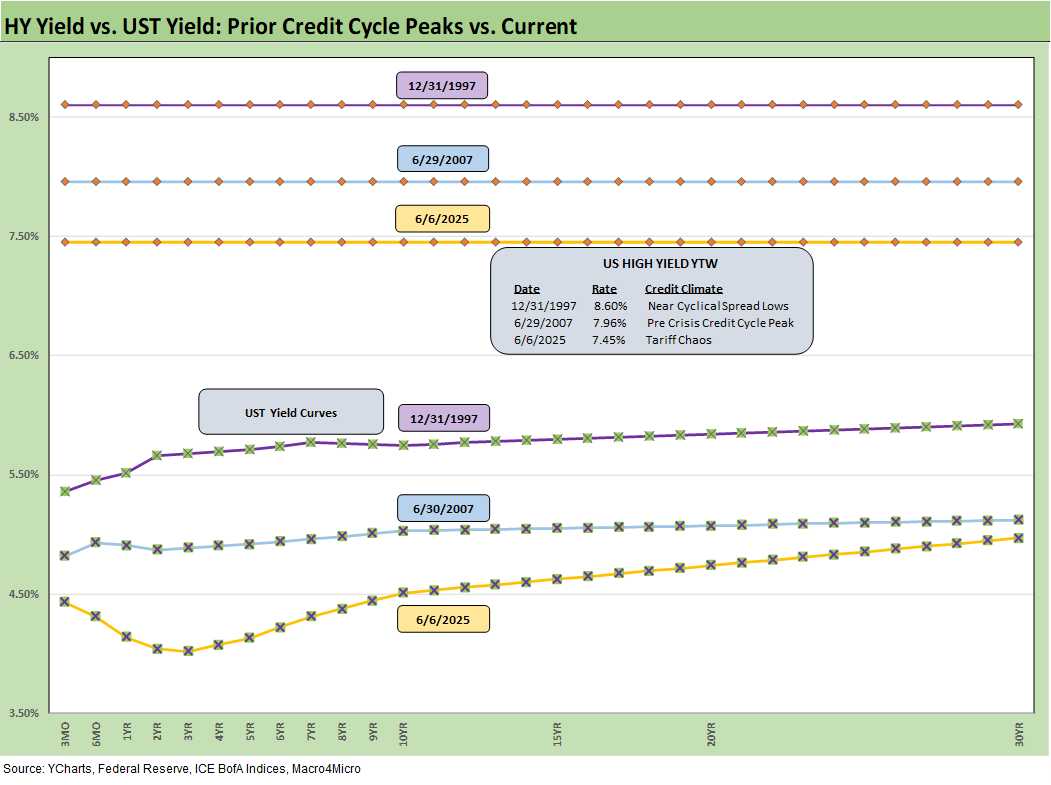
The final chart does the same 1997 and 2007 drill but for HY index yields. This week’s UST move leaves current HY index yields now below prior peak credit cycles at 7.45% vs. 7.96% in June 2007 and 8.60% in Dec 1997. The recent spread widening had moved HY index yields higher, but the recent reversal and rolling UST moves leave the current HY index YTW below both the 2007 peak and 1997 HY index levels.
The widening early this month gave flashbacks to the volatility and major spread moves of the 1997-98 and 2007-08 periods that also posted triple-digit widening months. The sheer speed of risk repricing has happened in earlier cycles even if those moves were for very different reasons.
Finding the catalyst for downside…
Below we roll forward some updated commentary on the credit cycle…
The challenge is identifying a fundamental transmission mechanism to more trouble for financial metrics and relative risks of default. Identifying a catalyst for pain now is easy with tariffs hitting the macro drivers (the consumer) and micro drivers (“buyer pays” hits margins or requires higher prices).
The recent tariff strategy is both unpredictable and unprecedented in modern capital markets, but at least the banks are much healthier. US-China trade talks on deck calm trade nerves again but the most recent Section 232 hike to 50% on steel and aluminum is still a fresh wound. Those are fighting words with key allies (see US Trade in Goods April 2025: Imports Be Damned 6-5-25, Tariffs: Testing Trade Partner Mettle 6-3-25).
The overall uncertainty in getting trade deals over the line remains a threat. Reciprocal tariffs could end up being “assigned” again rather than negotiated. The clock is ticking. Those tariffs will still need their day at SCOTUS based on the IEEPA challenge.
We also see higher quality levels in the HY bond index as a starting point vs. 2007 and the late 1990s TMT bubble years. The reality is the tariff impacts and supply-side disruptions are only now just beginning in substance. It is hard to reflect forward-looking risks when so few know (including the White House) what those risks will be as “pauses” start and could get better or worse. China was a rough lesson for the markets.
EU now joins China on the pause clock that can be terminated or extended with ease, but Mexico and Canada have outstanding trade war risk as the effects of the tariffs roll in and domestic political pressure picks up for leaders. It is useful for Trump to play his hand as the mood moves him in his own murky game theory plan, but corporate investment, big ticket purchase decisions by consumers, and FOMC policy setting can also take a protracted break beyond the pause.
The bad old days…
Looking back even more, the turn in the credit cycle always comes at some point and often with an external trigger or “assist” that can set it off. During 1990, securities firms started to collapse including Drexel’s Chapter 11 in Feb 1990 and bridge loan related bailouts of Shearson Lehman, First Boston, and Kidder Peabody. We do not face that type of financial intermediary meltdown risk here (at least not yet!). In a protracted stagflation bout, eyes will return to the regional banks.
The summer of 2007 was the start of major problems in the credit markets with asset risk and leveraged counterparty exposure and bank/broker interconnectedness risk soaring. Despite that backdrop that worsened in August 2007, the equity markets and S&P 500 and NASDAQ kept on rallying into Oct 2007. Later in the turmoil and well after the fact, the start of the recession was tagged as Dec 2007 (see Business Cycles: The Recession Dating Game 10-10-22).
The 2007 experience reminded the market that credit leads the cycle and equity lags. The same was true in 1999 with the HY default cycle underway and NASDAQ at +86% that year. This time around, the credit markets did not expect the tariff insanity and is still making up its mind. The real economic effects are more geared to the periods ahead when tariffs will be rolling in at the transaction level. That will be the reality point. We expect HY to stay unhappy and spreads to average wider as the tariffs roll into actual corporate fundamentals.
There are no frictionless wheels in high tariffs. The buyer pays the tariff at customs (literally writes the check). How that gets spread around the seller to buyer to customer chain has a lot of moving parts. The “seller pays” and “selling country pays” has been a clear lie from the Trump camp, and he admitted as much when he demanded that Walmart “eat” the tariff cost. Why would there be anything to eat if the seller pays? Shady and misleading discourse is never new to Washington.
The problem is that Trump recently highlighted yet again the hundreds of billions he collected from selling countries. We cannot tell what Trump remembers as a fact and what he made up. Until the tariff deals are put to bed, outsized “surprise risk” in tariffs remains high on the list. Since he breached the USMCA, even a deal is not a reliable deal. Congress has allowed him to declare an emergency at will. Now SCOTUS will need to decide.
See also:
Footnotes & Flashbacks: State of Yields 6-8-25
Footnotes & Flashbacks: Asset Returns 6-8-25
Mini Market Lookback: Clash of the Titans 6-7-25
Payrolls May 2025: Into the Weeds 6-6-25
Employment May 2025: We’re Not There Yet 6-6-25
US Trade in Goods April 2025: Imports Be Damned 6-5-25
Past-Prologue Perspective for 2025: Memory Lane 2018 6-5-25
JOLTS April 2025: Slow Burn or Steady State? 6-3-25
Tariffs: Testing Trade Partner Mettle 6-3-25
Footnotes & Flashbacks: Credit Markets 6-2-25
Mini Market Lookback: Out of Tacos, Tariff Man Returns 5-31-25
PCE April 2025: Personal Income and Outlays 5-30-25
Credit Snapshot: Meritage Homes (MTH) 5-30-24
1Q25 GDP 2nd Estimate: Tariff and Courthouse Waiting Game 5-29-25
Homebuilder Rankings: Volumes, Market Caps, ASPs 5-28-25
Durable Goods Apr25: Hitting an Air Pocket 5-27-25
Mini Market Lookback: Tariff Excess N+1 5-24-25
New Home Sales April 2025: Waiting Game Does Not Help 5-23-25
Existing Home Sales April 2025: Soft but Steady 5-22-25
Credit Snapshot: Lithia Motors (LAD) 5-20-25
Home Starts April 2025: Metrics Show Wear and Tear 5-19-25
Industrial Production April 2025: CapUte Mixed but Time Will Tell 5-15-25
Retail Sales April 25: Shopping Spree Hangover 5-15-25
Credit Spreads: The Bounce is Back 5-13-25