

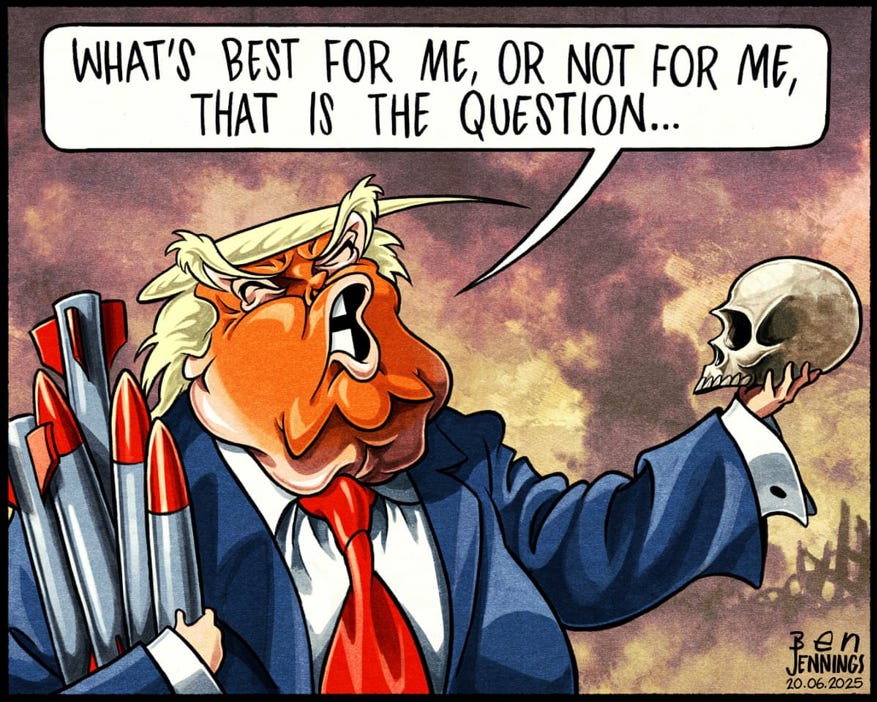
The wild swings in oil continue with some UST gyrations that will face a fresh round of PCE data this week along with an update of 1Q26 GDP.
The “game theory” (a euphemism) of the Trump-Iran to-and-fro process continues with concerns around a ticking clock still very significant to the world economy but also to what the lag effects will be for oil prices and thus the UST curve shape. For now, the odds of a cut in 2026 are framed at 0%.
The semiconductor and AI ecosystem trade keeps on rocking with Micron joining the trillion dollar club and market breadth a more distant memory.
The SaaS-based service players and software names are seeing some mount a slow, limited comeback, but the numbers remain grim YTD.
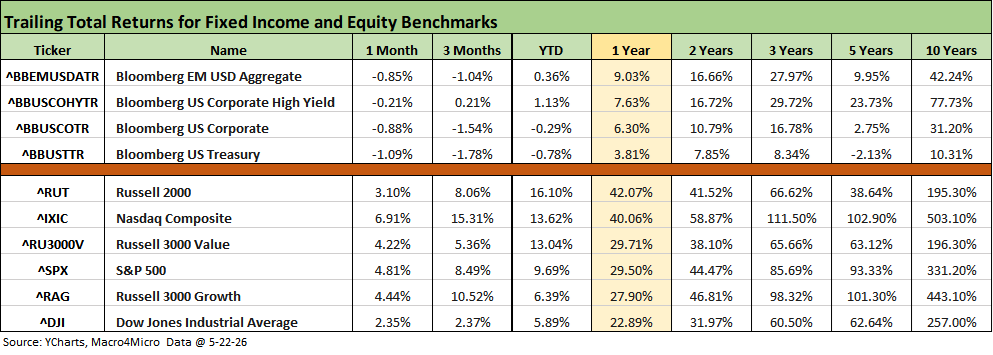
The above table updates timeline returns for our usual equity and debt benchmarks. We see all fixed income lines in the red for the 1-month period with only HY making it into positive range (barely) for 3 months. The duration impact is also evident in the YTD returns for UST and IG corporates with its longer duration.
Iran fallout has slowed equity progress even with techcentric benchmarks holding in well for the trailing 1-month period. The moves from here face an important series of pivotal points ahead for the Strait of Hormuz and how the cost pressures from the energy spike will flow into inflation directly (energy CPI/PCE) and indirectly through materials costs or surcharges in freight and logistics.
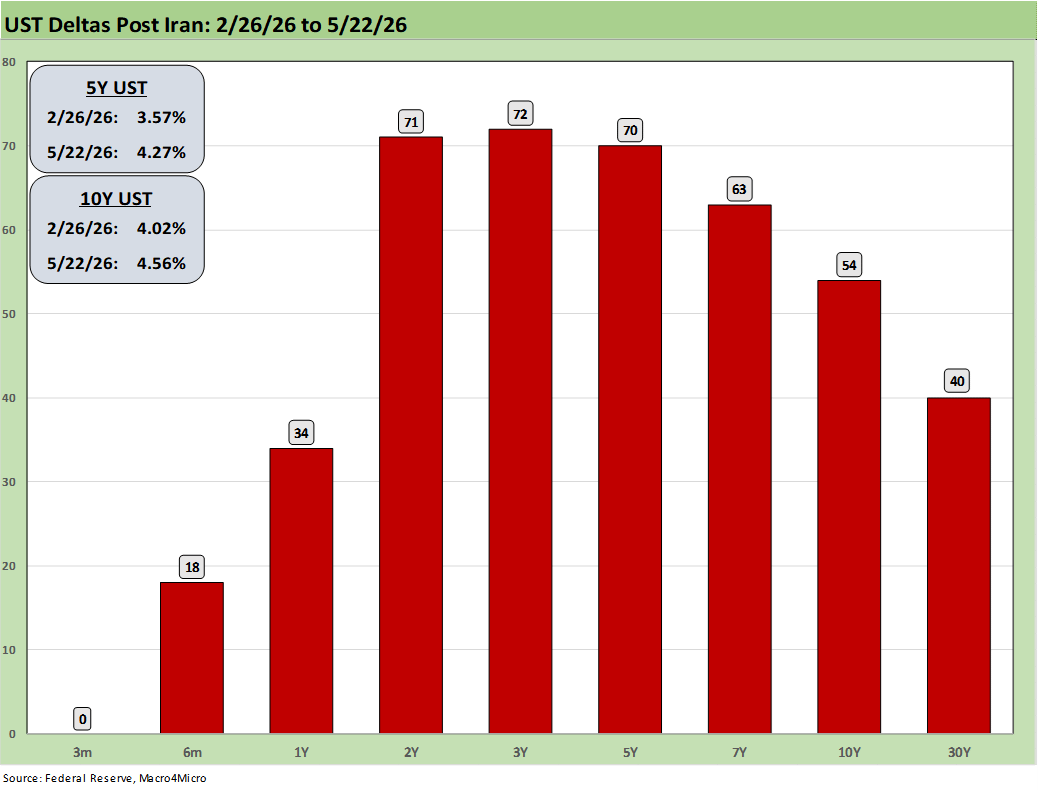
The above chart updates the UST deltas since the Iran bombing kicked into gear. It is an ugly move considering how 2026 began with debates around FOMC easing with “how many and how soon.” It is now a question of hikes.
As we go to print today, the FedWatch odds of easing by the FOMC Dec 2026 are now posting 0%. The odds of no change by Dec 2026 are now 49.5% while 1 hike stands at 38.7% and 2 hikes at 10.6%. These probabilities have been whipping around. One week ago, the probability of 1 hike was ahead of unchanged.
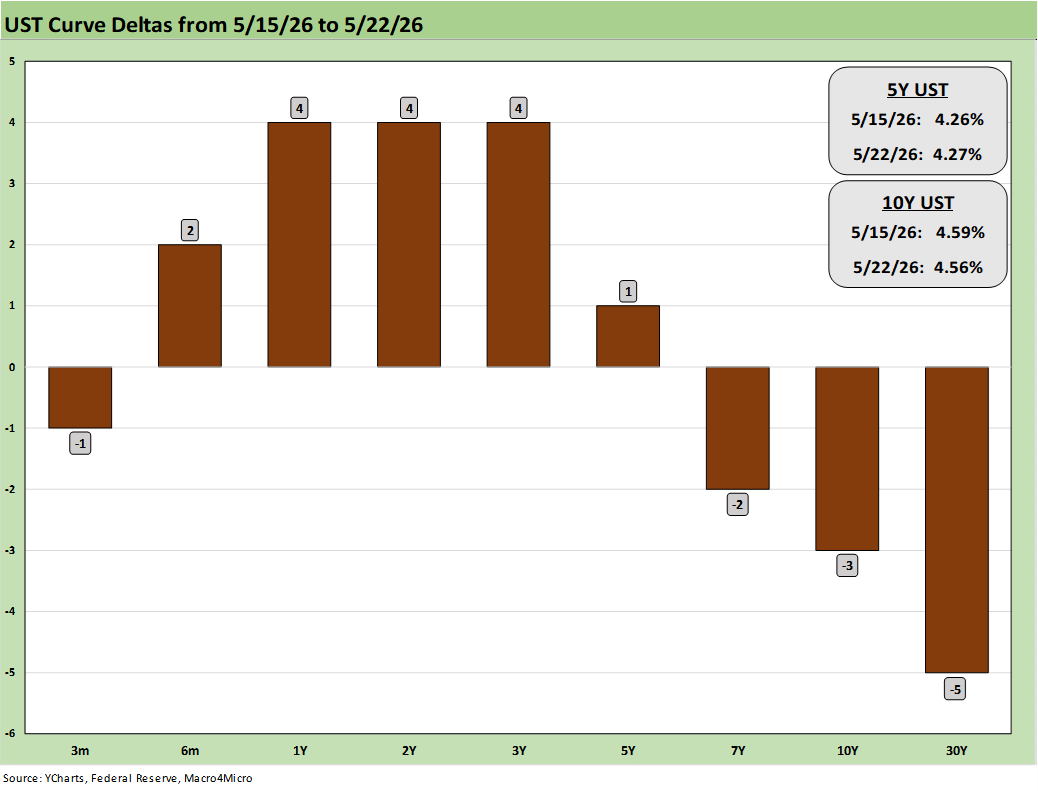
The above chart updated the 1-week UST deltas as a modest rise on the front end contrasted with a slight decline on the long end as oil pulled back. The potential for a bear steepener or upward shift may be more tied to a satisfactory outcome with Iran and the Strait, but the near-term inflation outlook is not an optimistic one after last month’s turn for the worse in inflation (see Producer Price Index April 2026: Heat Rising on Cost Inputs 5-13-26, CPI April 2026: 4.1% All Items Less Shelter, 30Y UST 5% 5-12-26).
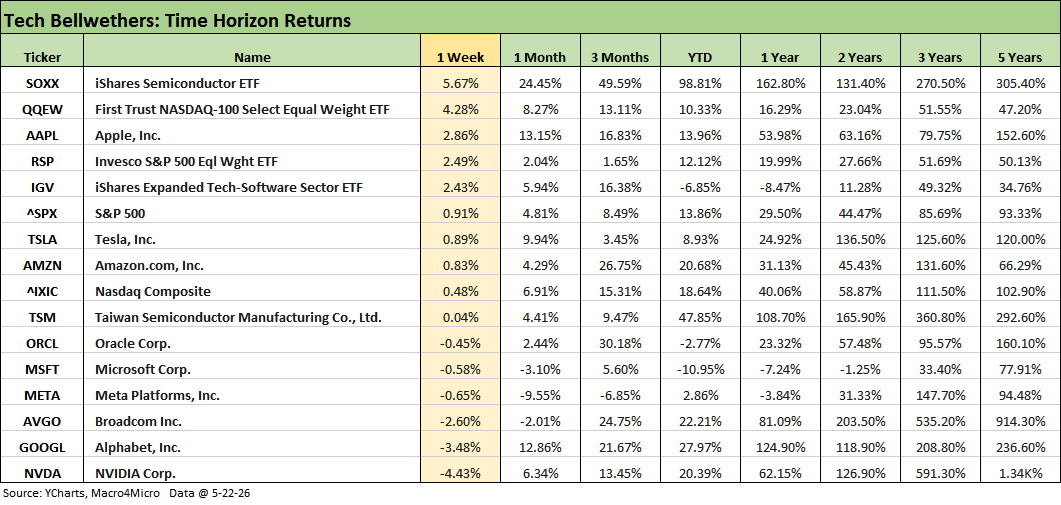
As we covered in our weekly tech check posted on LinkedIn and reposted below, the tech bellwethers weighed in with a mixed week with a few of the bellwethers such as NVIDIA, Alphabet, and Broadcom having an off week as NVDA beat estimates but faded quickly in the market. The Semiconductor ETF (SOXX) still delivered a 5.67% week in the #1 spot despite NVDA sitting on the bottom.
The following is a cut and paste of our weekend LinkedIn post with some edits:
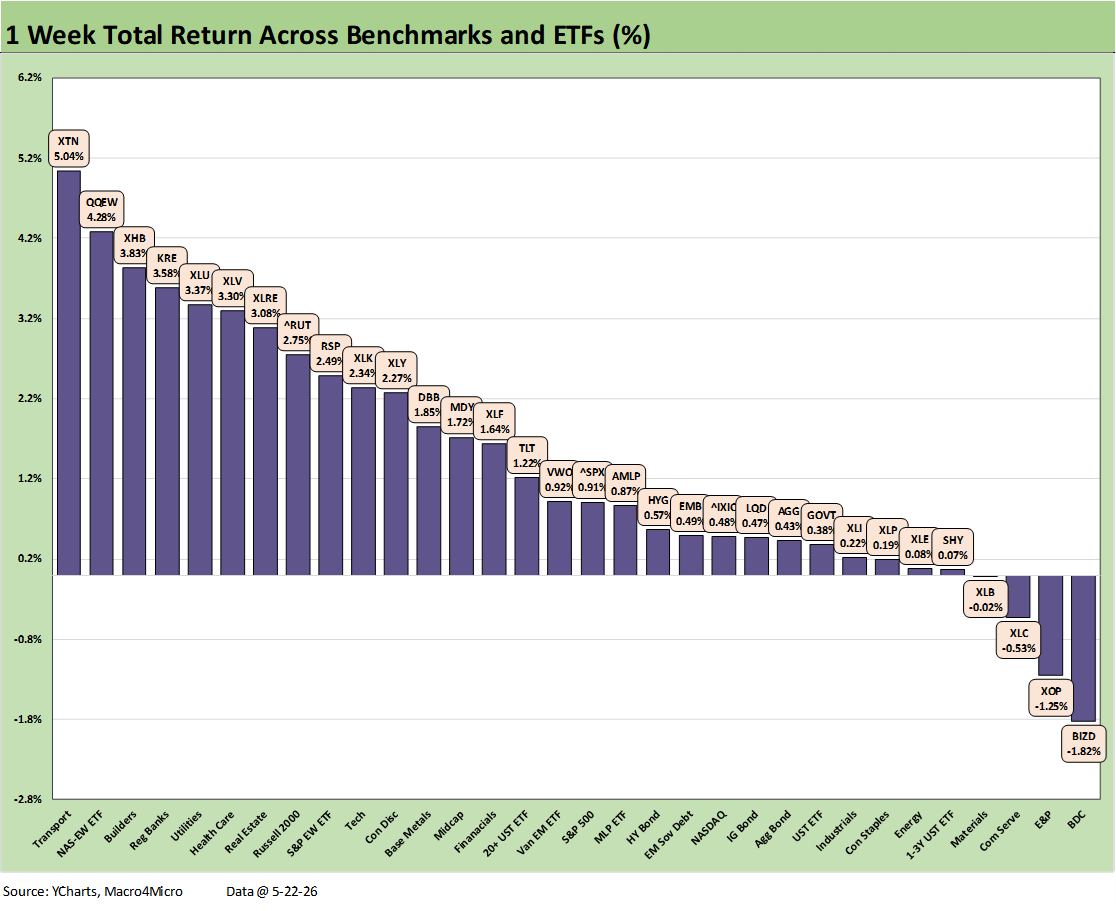
We update weekly returns for the 32 benchmarks and ETFs we follow. Political dysfunction so far is not derailing winning streaks or intermittent record highs for major benchmarks. Iran escalation risk, inflation worries, UST curve migration, and handicapping consumer fallout are the main events with a wide range of potential outcomes.
The score of 28-4 in the chart shows all bond ETFs positive. The long duration UST ETF (TLT) led the way despite bearish commentary.
Legislative turmoil is a risk and took a bad turn the past week as Trump handed himself immunity from the IRS at a time when his billions have multiplied since he became President. The Trump plan would generate “1,776” million ($1.8bn) to dispense checks to a range of “characters” that include those who beat police and sacked the capitol.
The House and Senate went fleeing from votes for the holiday weekend to avoid going on record. Hopefully they visited some Memorial Day monuments and rubbed them a few times to perhaps get a remote sense of courage – or consider what real sacrifice is for those with the mettle they lack.
The question of whether the US is becoming more like an emerging market of the 1970s is getting answered. This “1776” abomination is not good news. Some see it as a thug retainer for the midterms and a signal to state houses to take “legal risk” (i.e. break election laws).
If you believe policy=politics=economics=finance, then in theory lunacy in Washington should flow into policy anxiety, deficit fears, and potential for more erratic behavior in the geopolitical realm (NATO, Greenland, Cuba, anything Europe, USMCA review). The Iran strategy signals a divorce from the reality of secondary and tertiary effects as well as a lack of respect for unintended consequences. We have moved beyond the usual political hate mongering into hot wars and believable threats of annexation (Greenland, Cuba, Alberta next?). Legitimate fears of election interference by Trump are spiking.
A strong earnings season has been a source of support. Debates around consumers stabilizing has some hard number support pushing back on the “soft” consumer sentiment index that hit fresh record lows this past week. Walmart’s and BJ’s earnings brought some negative color that hammered their equities as proxies, but some retail earnings were “beats” and drove stock rallies such as Ross Stores and TJX. Retail equity performance is relatively good 2026 YTD and this past week as we will look at separately (see Retail Equity Comps: Looking for Signals 5-26-26).
The Trump game of picking daisy petals (“I will bomb them, I will bomb them not”) can wag $10 swings in oil each week, but the bridge to a deal between the parties is really hard to envision. Oil saw WTI drop down to a $96 handle to close Friday from $105 the prior Friday, but the UST curve only saw modest relief by the end of the week. As of Tuesday, WTI is just under $94 handle as we post this.
We covered the ugly UST deltas since Iran in our Substack commentaries (Macro4Micro.com) and LinkedIn posts. There is no hiding from more of the same UST pain and bearish inflation expectations until there is clarity on Iran and the Strait.
The following is a cut and paste of our weekend LinkedIn post with some edits:
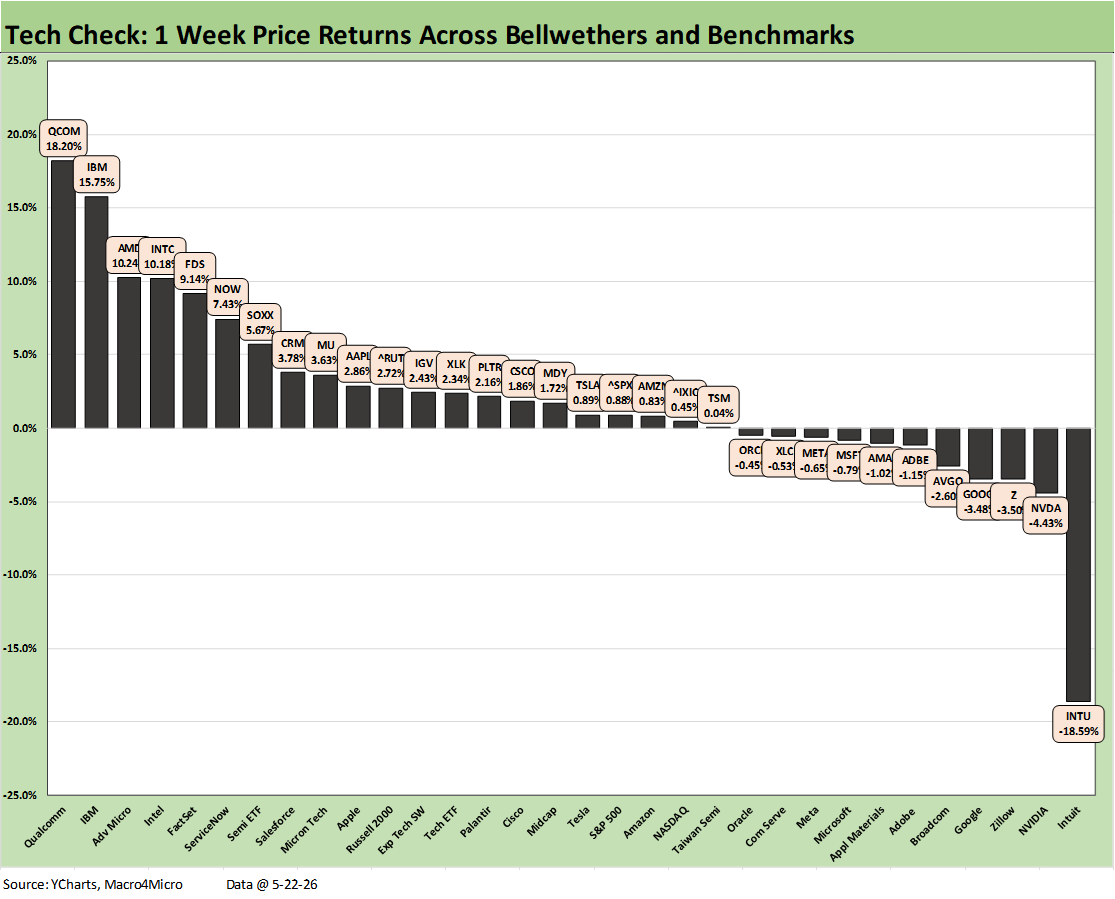
We update the weekly returns on our “Tech Check” list in what has been a volatile market for the winners and losers. The price returns were mixed even if we see the usual pattern of Hi-Lo outliers with semiconductors crushing the market and some SaaS-based companies taking a beating. The score this week was 21-11 with 3 of the Mag 7 in the bottom quartile, 3 in the 3rd quartile, and 1 in the 2nd quartile.
Most of the major tech names beat the NASDAQ and S&P 500 this week with those benchmarks in the 3rd quartile. In contrast, the Russell 2000 small cap benchmark was in the upper half of the 2nd quartile. The top quartile was half semis with 3 SaaS-based names and 1 diversified tech (IBM). That was a more balanced mix than in recent weeks.
We see 4 names with double-digit returns on the week with Qualcomm (QCOMM), IBM, Advanced Micro (AMD), and Intel (INTC) in that group. IBM had been one of the names tagged as vulnerable to AI displacement and remains in the bottom quartile YTD even if at the top of the YTD bottom quartile with a -14.3% return. IBM’s boost this week was tied in part to the headlines around government support for quantum computing and supercomputers with talk around direct investments by the US. Market commentary included some jawboning of parallels to the Intel comeback that came after US government investment and support.
On the downside, the market saw Intuit (INTU) slaughtered with a -18.6% week. On a YTD basis, that puts INTU in last place in price return at -51.7% just behind Zillow (Z) at -46.7%. Zillow joined INTU in the bottom quartile again this week in the bottom 3 and were surprisingly joined by NVDA in second to last after an earnings report beat.
On a YTD basis, NVDA was positioned in the lower half of the second quartile with a wide range of semiconductor peers and AI-sensitive names. We look at the YTD and other asset return horizons separately.
We see some notable software and SaaS-based names clawing back up the ranks lately with FactSet (FDS), ServiceNow (NOW) and Salesforce (CRM) in the top quartile this week. All three of those are in negative range for YTD returns, so it has been a long road back. The Software ETF (IGV) was positive this week but still negative YTD.
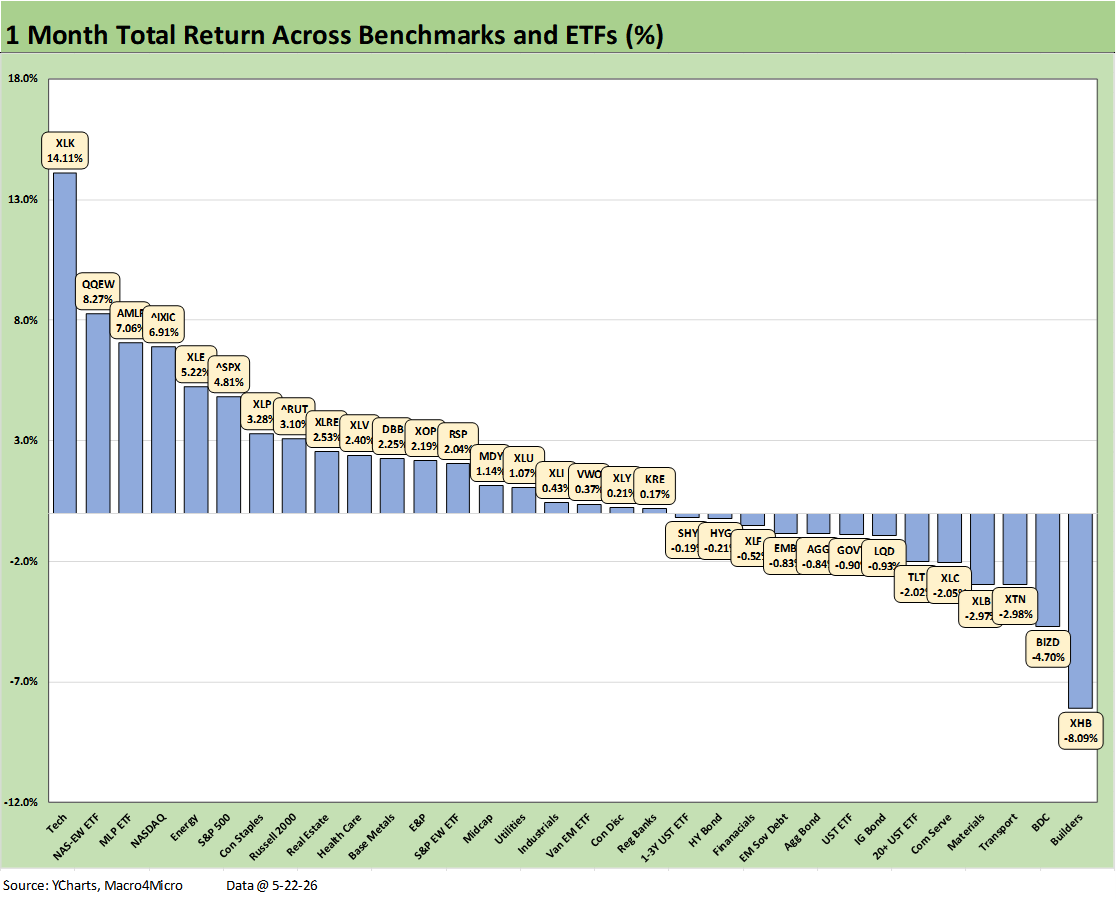
The 1-month horizon reminds us that the equity market has been a case study in resilience with a score of 19-13 even with troubling inflation numbers and Iran turmoil leaving some critical variables subject to highly uncertain geopolitical deal outcomes. Escalation scenarios are ugly, but the peaceful end game is encumbered by radical religious extremism on one side and geopolitical incompetence and pathological delusion on the other. That makes for some challenging ground to cover in the context of global capital markets. Just sayin’.
The UST curve action has been unkind with all 7 of the bond ETFs in the red zone. Duration is mounting a comeback to start the shortened post-Memorial Day week on Tuesday, but the oil price swings could go either way and in dramatic fashion. The energy trade rags are conveying competing stories around how long the tail pain in oil prices will be for upstream and downstream energy if the situation lasts (in some scenarios even if it does not last).
Looking back at the winners through Friday, we see the Tech ETF (XLK) well out in front followed by the Equal Weight NASDAQ 100 (QQEW) and NASDAQ in 3 of the top 4 slots with energy (XLE, AMLP) comprising the other 2 of the top 5 slots.
The major tech heavy benchmarks are killing the breadth story but holding up headline price action and index “new highs.” The tech heavy S&P 500 and small cap Russell 2000 are in the top tier with the more defensive and dividend-focused Consumer Staples (XLP).
Besides the 7 bond ETFs in negative range, we see Homebuilding (XHB) on the bottom with builders reporting shaky earnings and guidance, BDCs (BIZD) under a dark cloud with more fraud headlines and second guessing on the downside for marks, and some pressure on Transports (XTN) and Cyclical Materials (XLB).
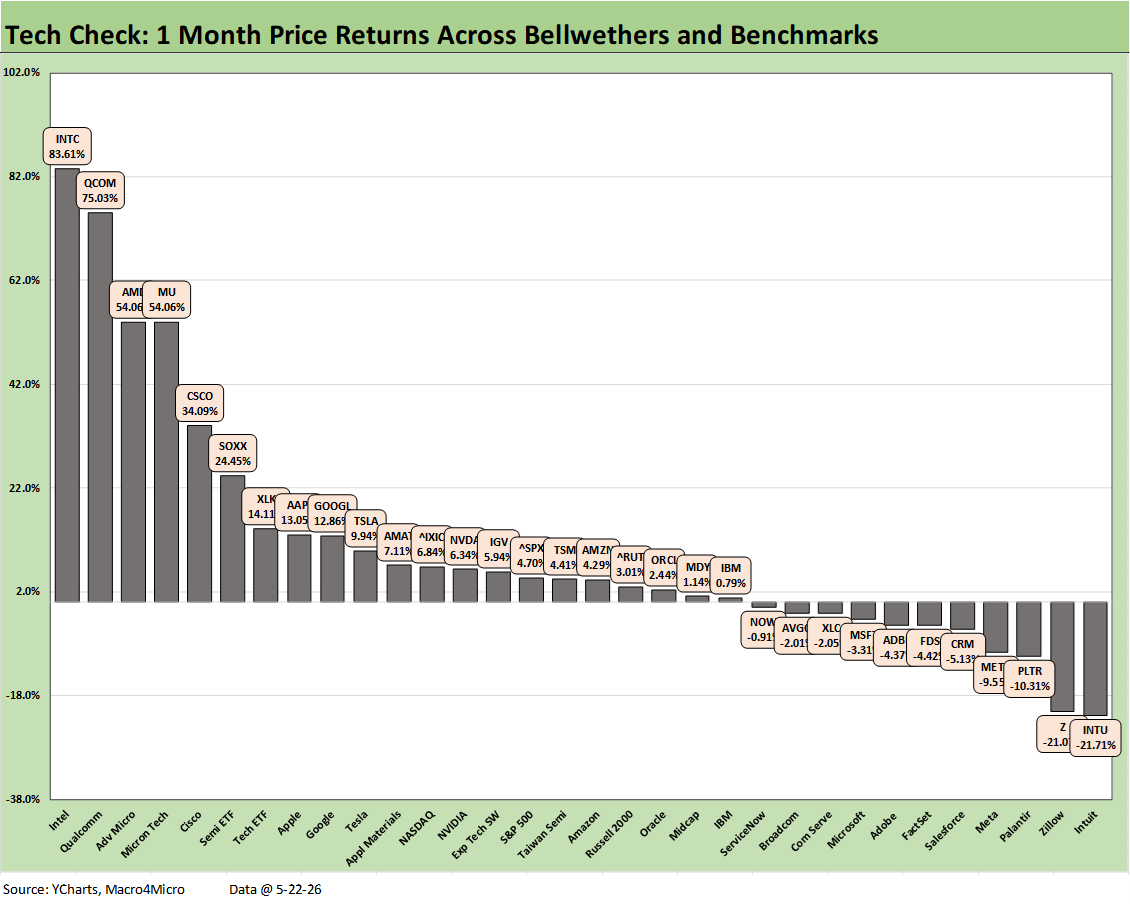
The 1-month Tech Check list is no surprise and in line with the recent price action we frame each week with Semiconductors the big winner. We see the entire top quartile comprised of tech even with no broad market tech-centric benchmarks in the top tier (NASDAQ and the S&P 500 are in the second quartile).
Intel (INTC), Qualcomm (QCOMM), Advanced Micro (AMD), Micron (MU) were well ahead of the pack through Friday with Cisco (CSCO), the Semi ETF (SOXX), the Tech ETF (XLK), and Apple (AAPL) rounding out the top tier. Micron ran wild again on Tuesday as we go to print and is up 19% on the day with NASDAQ and S&P 500 hitting all-time highs and MU joining the $1 trillion market cap club.
The bottom dwellers are still the SaaS-based services operators and software names. We see Intuit (INTU) at -21.7% in last place with Zillow in 2nd to last at -21.0%. Palantir (PLTR) at -10.3% and Meta at -9.6% are also in a hole with Microsoft (MSFT) in the bottom quartile and in the red. The software ETF (IGV) has managed to claw its way back into the middle of the second quartile over the month.
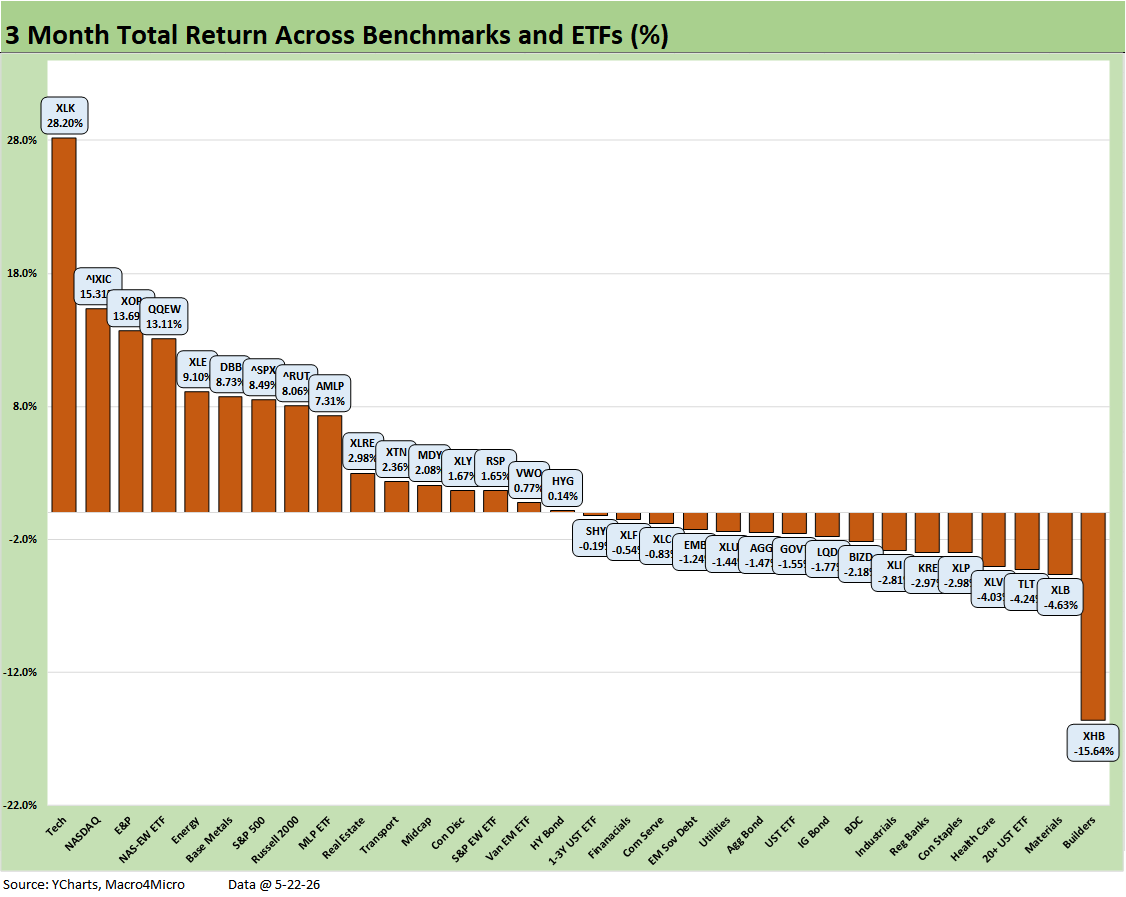
The 3-month timeline is essentially an Iran time horizon. The positive vs. negative score is a tossup at 16-16. We see some obvious trends such as the E&P ETF (XOP) and Diversified Energy ETF (XLE) charging ahead and the Tech ETF (XLK) well ahead at #1 with the NASDAQ and Equal Weight NASDAQ 100 (QQEW) rounding out the top 5.
The surge in Base Metals (DBB) is also directly tied to the Strait shutdown as aluminum supply-demand imbalances sent aluminum soaring directly on supply while the Strait has also undermined the supply of sulfur/sulfuric acid for global copper production.
For bond ETFs, we see 6 of 7 negative with the long duration UST ETF (TLT) generating the worst returns of the pack. The shorter duration US HY ETF (HYG) managed to land in a very slight positive range on coupon income and spreads. Spreads tightened by around 24 bps from 2-26-26 through recent days (5-25-26 at +274 bps). Those spreads are compressed by any standard.
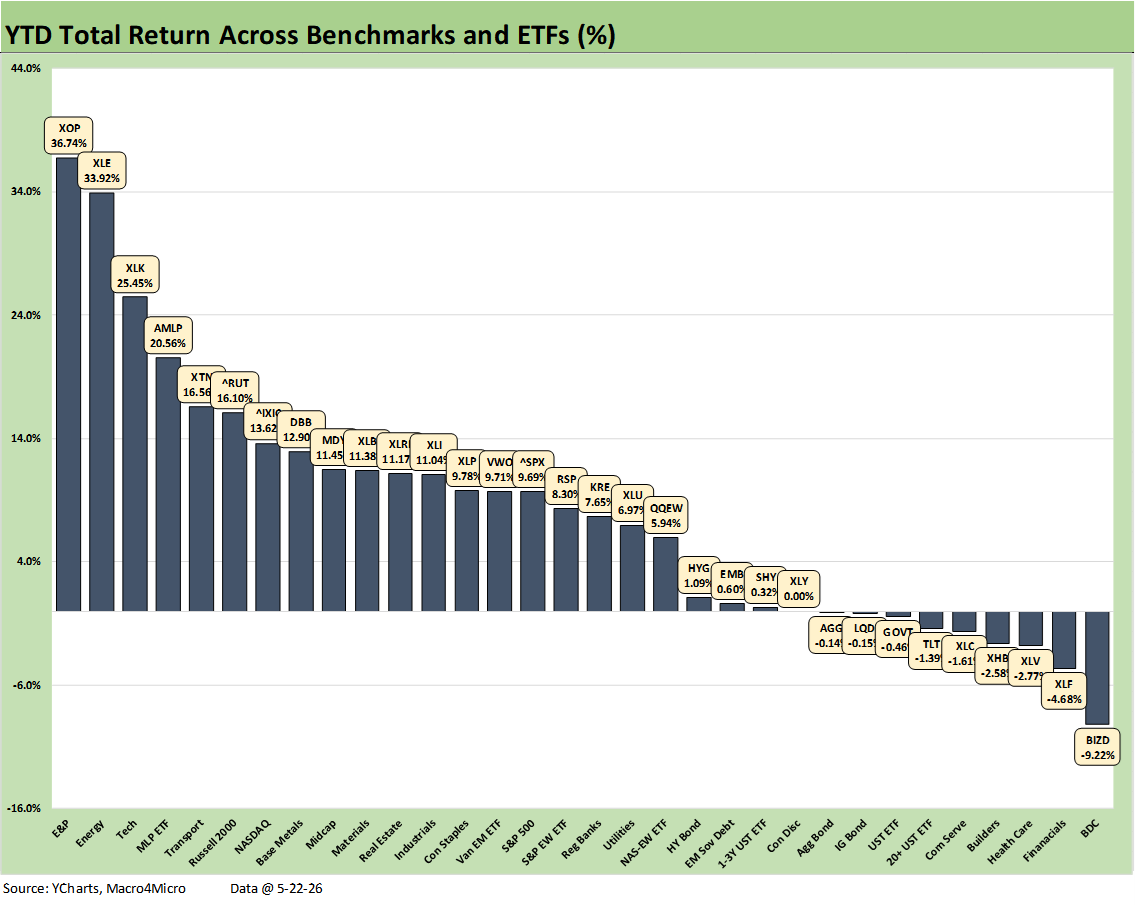
The above chart frames the YTD for the diversified group of 32 and we see the positive bias at a score of 23-9. Bond ETFs comprise 4 of the 9 asset lines in the red. The others in negative range include BDCs (BIZD) in last place with Financials (XLF) 2nd to last below Health Care (XLV), Homebuilders (XHB) and Communications Services (XLC).
Energy has grabbed 3 of the top 4 slots with only Tech (XLK) splitting up the streak at #3. E&P (XOP) is #1, Diversified Energy (XLE) is #2, and Midstream (AMLP) is #4. The overall top tier mix might surprise with Transports (XTN) at #5 and Russell 2000 small caps at #6. NASDAQ in the top tier at #7 is logical as is Base Metals (DBB) with all of the Gulf disruptions.
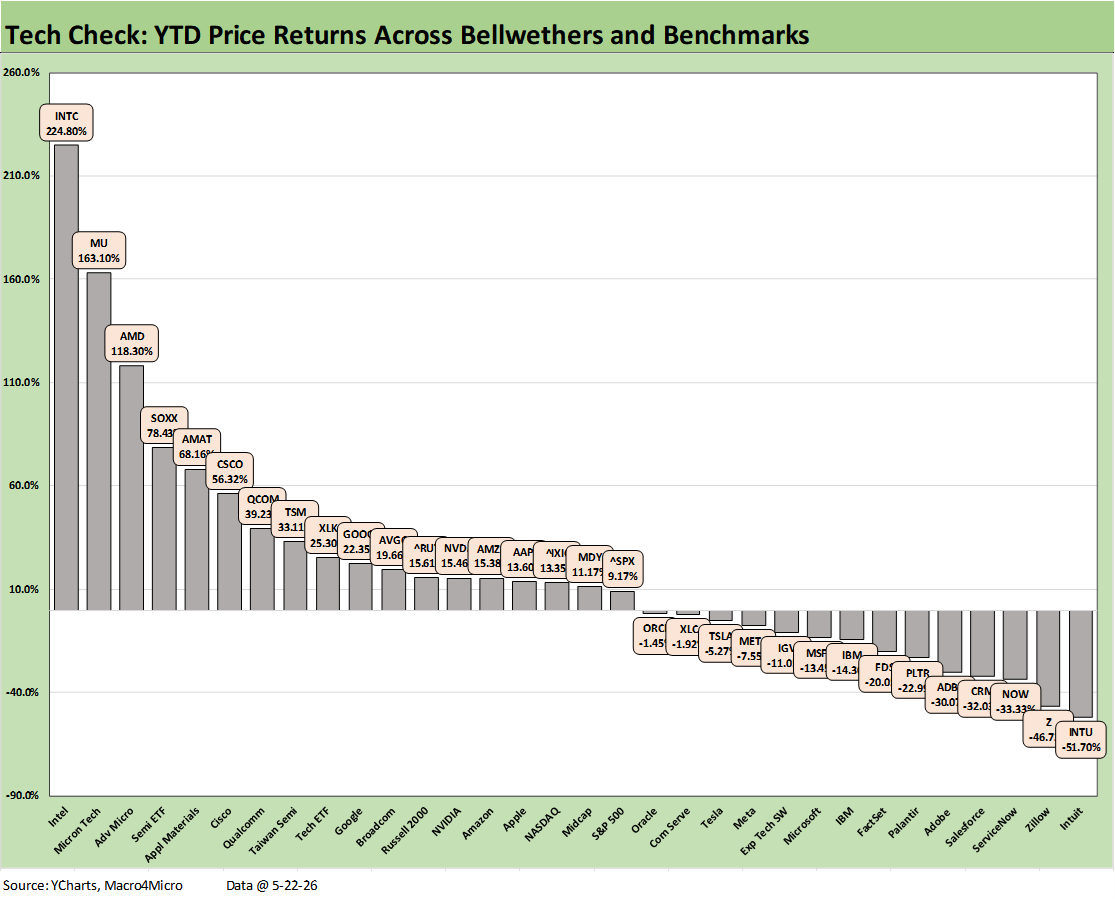
The above chart details the YTD returns on the Tech Check list. We see a score of 18-14 with the semiconductor and an array of names tied to the AI infrastructure and data center expansion themes. The capex boom and “all the trimmings” that go with those fixed asset investments have fortified many investors to look past the Iran, oil, and yield curve chaos – for now. There is still a lot of revenue model evidence in the AI themes that will need to get tested.
The word “tech” is clearly not magic as the bottom quartile demonstrates with the returns on many software and SaaS-based service names deeply in the red. The bottom quartile bracket runs from -14.3% for IBM to -51.7% with Intuit (INTU). We have been covering those issues in the weekly Tech Check commentaries on LinkedIn and in earlier asset return comments.
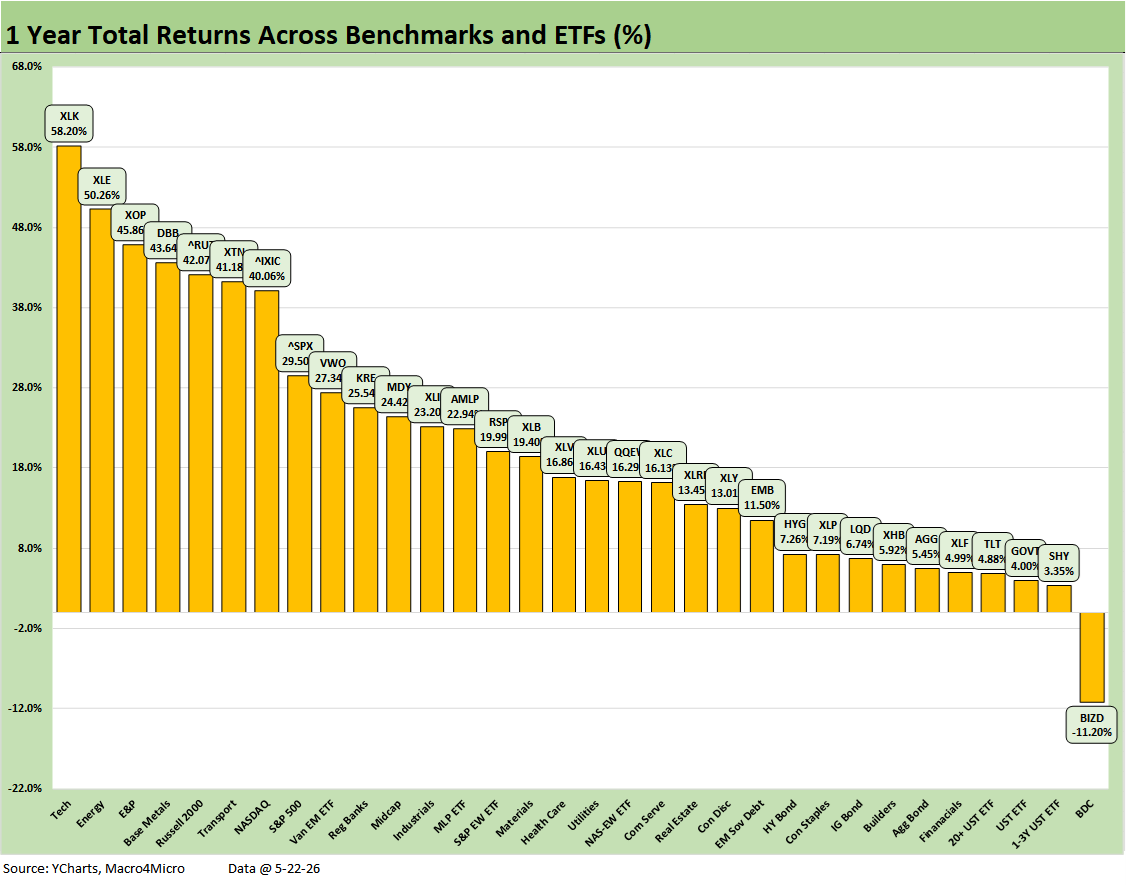
The running LTM asset returns are a reminder of a great run in equity markets for many industry groups and broad benchmarks. We see only the BDCs (BIZD) in the red. We see 5 of the 8 in the bottom quartile comprised of bond ETFs. They join the BDCs (BIZD), who sit in last place, with Financials (XLF) and Homebuilders (XHB) in the bottom tier.
It took a very impressive 29.5% to make the top quartile but that jumped to 40.0% to be #7. Those results in the top tier are healthy multiples of the long-term return on the equity asset class. The LTM median return on the list is around +16.6%.
See also:
Retail Equity Comps: Looking for Signals 5-26-26)
Housing Starts April 2026: Soft Starts in Single Family 5-22-26
D.R. Horton: Financial Powerhouse Despite Cyclical Softening 5-20-26
Market Commentary: Asset Returns 5-18-26
Taiwan: Stakes are High, US Awareness is Low 5-17-26
Industrial Production April 2026: Bringing a Lift 5-15-26
Existing Home Sales April 2026: Steady or Clinging? 5-14-26
Producer Price Index April 2026: Heat Rising on Cost Inputs 5-13-26
CPI April 2026: 4.1% All Items Less Shelter, 30Y UST 5% 5-12-26
Employment Situation: April 2026 5-8-26
New Home Sales March 2026: Favorable Volume, Weaker Prices 5-5-26
JOLTS March 2026: Openings Down, Hires Up, Layoffs/Discharges Up 5-5-26
PCE Inflation, Income & Outlays March 2026: Inflation Anxiety Level? 5-3-26
1Q26 GDP Advance Estimate: Consumer Fade, Investment Boom 4-30-26
Synchrony Financial: Favorable Consumer Credit Signals 4-24-26
Existing Home Sales March 2026: New Beginnings or New Ends? 4-15-26
4Q25 GDP: More Adverse Revisions in the Golden Year 4-9-26
The US as an Aspiring Emerging Market: Fiscal SNAFU, Political FUBAR 4-6-26
UST Deltas: Elevation Realities 3-29-26
Market Lookback: Confusion Reigns, Dislocation Pours 3-22-26
Market Lookback: The Gulf of Cause and Effect 3-15-26