
Producer Price Index April 2026: Heat Rising on Cost Inputs
PPI for April has not rattled the bond and equity markets much despite some “worst since” headlines citing the dreaded 2022 comp.

The cost inputs for producer pricing strategies are starting to flow into goods and services in a bigger way even if at a lag that will keep playing out subject to Iran War fallout, tariff effects, and labor expectations as “real wages” take a pummeling on rising CPI and PCE (see CPI April 2026: 4.1% All Items Less Shelter, 30Y UST 5% 5-12-26, PCE Inflation, Income & Outlays March 2026: Inflation Anxiety Level? 5-3-26).
The sharp upward moves along many PPI lines – especially since March – tell a story of either higher prices ahead or eroding profit margins unless the “magic pill” of AI can offset the effects (see Producer Price Index March 2026: Heater or Curve Ball? 4-14-26). April PPI posted the kind of moves you cannot dance around. The UST curve action has been restrained, but FedWatch odds have shifted notably against easing of late with “hike odds” rising. “No change” is still the heavy favorite in calendar 2026.
Whether you believe PPI is a reliable leading indicator or not, the logic of inflationary pressures ahead in goods and services shown in CPI/PCE metrics is a well-traveled conceptual path. The MoM move of +1.4% is double March while the 6.0% YoY is up from +4.3% (revised) in March.
The +1.4% increase in Final Demand was the highest since March 2022 and the 1.2% increase in Final Demand Services MoM was the highest since March 2022. Any time the comparisons are made to 2022, it is a bad thing. Then again, personal consumption and payrolls were strong in 2022 and a recession was avoided. The tests are still in the consumer sector, corporate earnings, and hiring (see Employment Situation: April 2026 5-8-26, JOLTS March 2026: Openings Down, Hires Up, Layoffs/Discharges Up 5-5-26).
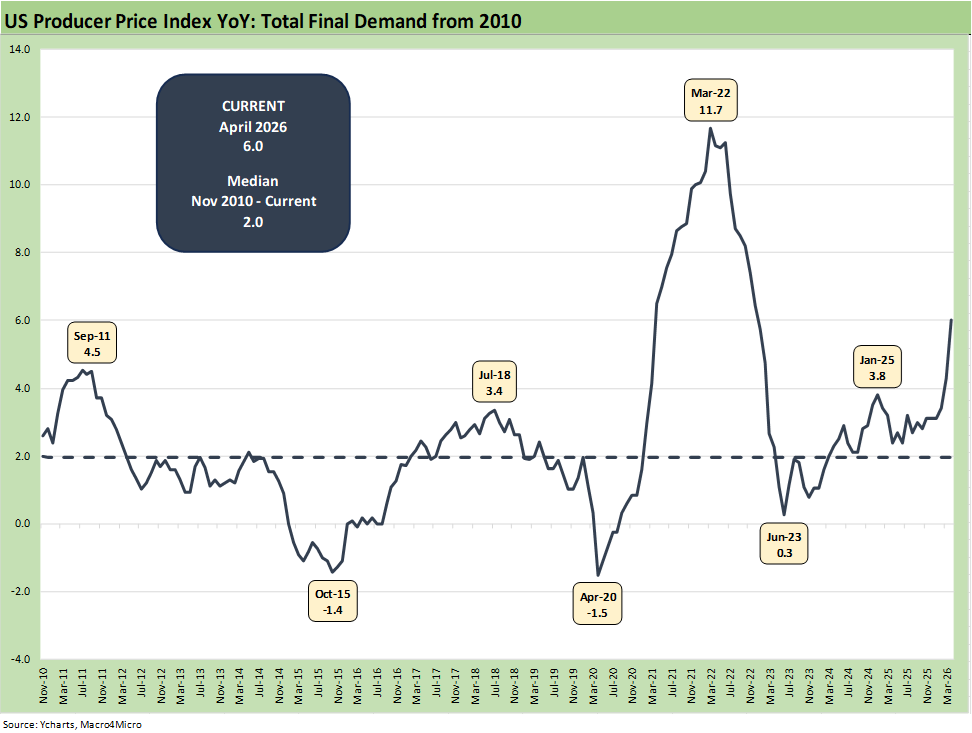
The time series above posts the PPI index level for Final Demand, and April is running at 6.0% or 3x the long-term median. That can only be seen as a negative. The theory is that will flow into PCE inflation levels and will send Warsh to the local hardware store for a high volume “mean trimmer” as the FOMC plot thickens. Changing the data strategy will not change the prices of goods and services.
The chart shows a PPI rise to 3.8% in January 2025 with a dip that followed before the inexorable rise into 2026. The move to 6.0% YoY in April from 4.3% (revised) in March, 3.4% in February, and 3.1% (revised) in January sure looks like a trend. That rise is not to be taken lightly. The market was looking at 2% handles in 2Q25.
The 6.0% YoY level is the highest since Dec 2022. Some will lay off April PPI on energy, but there is no shortage of line items outside energy in the data-intensive PPI release signaling setbacks. Final Demand Core PPI of 5.2% is up from the 3.8% reported in March.
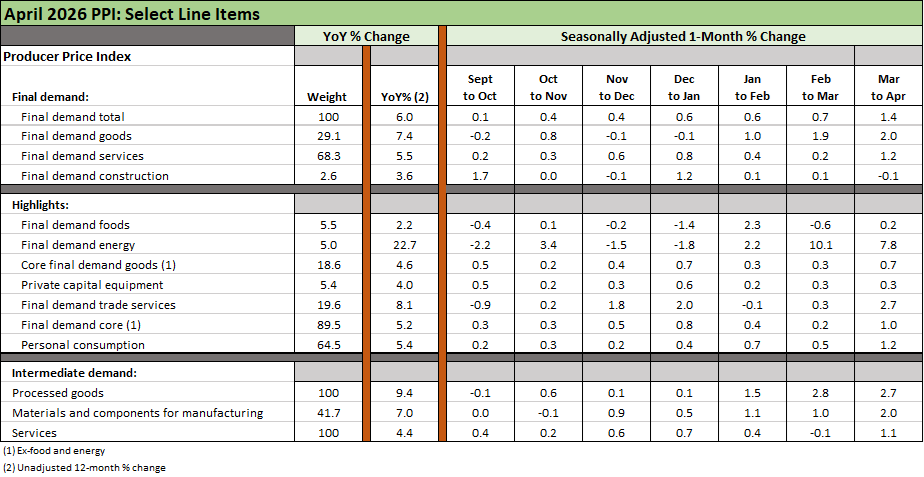
The above table breaks out some of the important metrics in PPI we monitor plus a few smaller line items we like to watch (Construction, Private Capital Equipment). The YoY column tells a story of inflationary trends and the March to April numbers are on balance moving in a distinctly negative direction.
The equity and bond market reaction was relatively muted, but the 2Y UST has been climbing over the trailing month and 6M period. That said, the 2Y UST is 3.99% today as we post vs. a 3.99% open. The 10Y at 4.48% as we go to print is a minimal move from the 4.47% open. In contrast, the “Vegas line” over at FedWatch seems to be wiping out odds of a cut in 2026. Those probabilities are essentially telling Warsh to “brace for impact” (Truth Social impact that is).
The FedWatch odds of a cut by the Dec FOMC meeting is now down to 1% with a 64% chance of unchanged fed funds by then and a 30% chance of 1 hike. The odds of a hike were less than 1% a month ago. Looking out to the next April (2027) FOMC meeting, the odds of unchanged by then is 42%, 1 hike is 39%, and 2 hikes is 15%. The odds of 1 cut at a 325-350 bps range is less than 1%.
For today, the fact that the Strait of Hormuz remains closed and negotiations are stalled with Trump in China (and seemingly detached from hopes of Iran progress) has not helped those odds. The PPI trend lines remind us that energy costs, tariffs, and producer pressures to protect margins will flow into inflation unless demand takes a major hit. The 1Q26 earnings season did not signal broad weakness in the economy and payrolls have been steadier. That means pricing power is still there for many as producers face tariffs (in whatever form they end up taking) and the Iran cost effects get felt directly and indirectly in the economy.
See also:
CPI April 2026: 4.1% All Items Less Shelter, 30Y UST 5% 5-12-26
Market Commentary: Asset Returns 5-10-26
Employment Situation: April 2026 5-8-26
New Home Sales March 2026: Favorable Volume, Weaker Prices 5-5-26
JOLTS March 2026: Openings Down, Hires Up, Layoffs/Discharges Up 5-5-26
PCE Inflation, Income & Outlays March 2026: Inflation Anxiety Level? 5-3-26
1Q26 GDP Advance Estimate: Consumer Fade, Investment Boom 4-30-26
Synchrony Financial: Favorable Consumer Credit Signals 4-24-26
Industrial Production March 2026: Mixed Picture, Big Questions Ahead 4-16-26
Existing Home Sales March 2026: New Beginnings or New Ends? 4-15-26
Producer Price Index March 2026: Heater or Curve Ball? 4-14-26
4Q25 GDP: More Adverse Revisions in the Golden Year 4-9-26
The US as an Aspiring Emerging Market: Fiscal SNAFU, Political FUBAR 4-6-26
UST Deltas: Elevation Realities 3-29-26
Market Lookback: Confusion Reigns, Dislocation Pours 3-22-26
Market Lookback: The Gulf of Cause and Effect 3-15-26