


Gasoline and health care premiums can be a zero-sum factor…
With more investors locked in on gauging the health of the consumer, the wider expanse of retailers has held up reasonably well in the equity markets. We look at a wide cross-section for 1-week and YTD returns. We use a mix of Retail ETF holdings to frame a representative checklist of single names.
During a period when the consumer is under scrutiny and is always the linchpin to achieving decent GDP growth (PCE is around 68% of GDP), it is worth watching how the broader peer group of retailers are being viewed in the equity markets. After all, someone owns them and is studying them in what is a large, diverse, and fragmented sector.
We get the second GDP estimate for 1Q26 this week. We also get fresh updates on personal income and outlays along with PCE inflation. That should offer some infill on how the consumer is spending (PCE) in the face of real disposable income (DPI) facing higher inflation in the “household basket.” Meanwhile, a slew of other retailers report earnings this week led by mega cap Costco.
We are coming off a mixed week in retail earnings in a market that is hypersensitive to any signals of weakness or retrenchment in consumer behavior. We heard some caution at Walmart and BJ’s. Both of those retailers serve as sentiment-shaping indicators and bellwethers for the price-sensitive shopper. We saw a -10.1% return last week for BJ’s stock, which was in last place in our peer comps below the -8.5% for WMT in 2nd to last. There were also some good performers last week as detailed below.
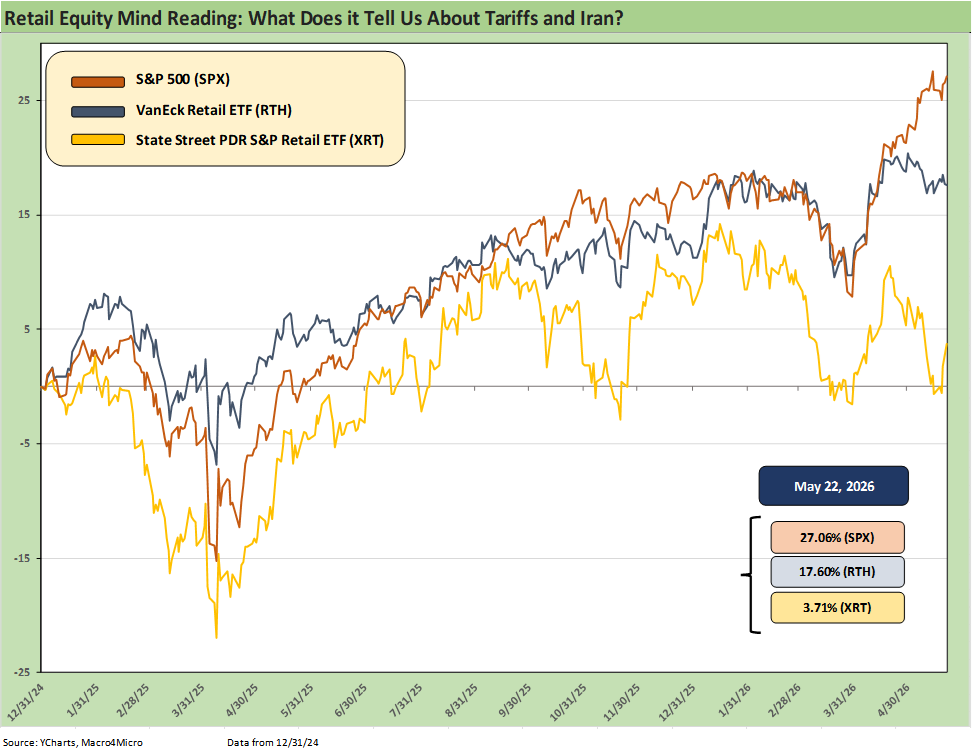
The above chart frames two Retail ETF performance histories vs. the S&P 500. We plot the running returns of VanEck Retail ETF (RTH) and State Street Retail ETF (XRT) against the S&P 500 from the end of 2024. The timeline captures the onset of the Trump tariff policies, including the turmoil of the initial reciprocal tariff shock in April 2025. That was ugly before the tariff policy backpedal set in to relieve the market stress. Later those IEEPA tariffs were ruled illegal by SCOTUS, but Trump continues to try his hand using legally established tariff laws (Section 122, 232, 301). Even those efforts have had mixed results in court.
The April 2025 “reciprocals” brought material selloffs in the S&P 500 and retail names alike (see Reciprocal Tariff Math: Hocus Pocus 4-3-25, Tariffs, Pauses, and Piling On: Helter Skelter 4-11-25). The challenge for retailers and tariffs is the lag time and uncertain flow-through effects across working capital cycles. Then there are the strategies implemented by retailers and wholesalers to deal with such risks while mitigating the pain in profit margins.
The Nov 2025 sell-off in the chart was arguably more about interest rates and how that would flow into the consumer sector (see Market Commentary: Asset Returns 11-23-25, The Curve: Slopes Can Get Complicated 11-26-25). The other swoon in the chart in 2026 came with the Iran attack and the intrinsic burden on consumers. Discretionary household cash flow and its impact on households is the consumer story – not economic theories on inflation and monetary guesswork.
The lower probability of FOMC easing matters. That flows directly into working capital financing costs for retailers and higher borrowing costs for consumers (notably in durables and housing-related financing whether for homes or home improvement etc.).
Retail ETFs influenced by mix…
While there is little question that retail equities overall have underperformed the broader market, the ETFs and leading issuers offer some signals. For ETFs, it is important to check on material variances in company or sub-sector mix. That clearly applies to Retail ETFs.
We prefer XRT for our purposes as we attempt to gauge how the equity market might serve as a proxy for many underlying names in these portfolios. The retail subsector mix and relative performance ties into equity holders watching fundamental trends. XRT is very well diversified with the top holdings showing less than a 2% share of the total portfolio across a very wide range of names including small caps and value plays.
In contrast to XRT, RTH shows an asset concentration of Amazon shares totaling almost 24% of the ETF and almost 12% in Walmart. In other words, over 1/3 of the portfolio performance is set by a single Mega Cap (Walmart) plus the mother of all Mega Cap retail names (Amazon). RTH can offer a useful way of tracking retail industry leaders, but XRT covers a wider range of names and thus reflects a broader mix of customers, products, and markets.
The daunting aspect of “retail” as a bucket is the wide array of sub-industries across auto retail (from cars to aftermarket parts supplies), apparel, broadline retail, food retail, consumer staples, tech and electronics, and general merchandise. That is why the securities firms in the “old days” would have so many retail equity analysts.
Framing peer groups…
In the names that we select in the chart below, we leave out auto vehicle retail since we tend to look at those through the prism of the OEMs and their independent dealer networks (e.g., see Credit Crib Note: Lithia Motors 9-3-24). The ETFs include some of those franchised dealers and also Carvana as a unique (and still evolving) auto retailer.
Suppliers such as O’Reilly and AutoZone are typical retail holdings and fit the traditional retail model. The auto chain is important to the consumer, but we try to get a read on the new and used markets more directly from the OEMs in terms of what they reflect about the consumer.
Questions to ponder…
With tariffs as a fact of life for retailers and now oil spikes flowing into inventory pricing considerations, there is no shortage of moving parts as we try to gauge how those factors can impact inventory costs and operating costs. That can translate into retailer pricing strategies (as in higher prices) to recoup costs.
There are also tariff mitigation strategies that result in cost cutting (headcount reduction, store closings, etc.). The mix of inflation pressures and payroll setbacks (unemployment broadly) are just part of the Newtonian realities of higher supplier chain cost. If costs go higher, someone will bear that cost whether the customer or the retailer or the shareholder.
In contrast to the White House, the retailers and wholesalers know the “seller” does not pay the tariff. The importer writes the check. Some retailers have more flexibility and resilience by not being the importer (e.g. stock through a wholesaler), but the reality of rising inventory cost pressures do not disappear. It gets absorbed somewhere along the chain.
Given the high number of retailers and very wide array of product sourcing by region/country, there are a handful of questions to consider for different sub-industries and outlying winners and losers in the retailer lists:
Are tariffs pressuring inventory costs?
Does the retailer have other lower cost alternatives from a different country?
Has pricing alone been sufficient to offset tariff margin damage?
How are apparel retailers dealing with the old or new/evolving tariffs placed on the low-cost textile players (notably in Asia, see Tariffs: Some Asian Bystanders Hit in the Crossfire 4-8-25)?
Will the coming USMCA review be a major risk?
How does the company see the downstream materials cost pressure (petrochemicals) flowing into inventory costs across a range of goods?
How are freight costs trending? Have diesel costs and warehousing costs been impacted so far? How do they see those trending with holiday ordering decisions on the horizon ahead of back to school, fall and winter holidays, or the usual seasonal lead times?
The array of retail sub-industries and diverse product offerings can be overwhelming, but some random sampling is always worth some effort in the transcripts and press releases. There is also the simple question of how the stock price action is framing up in the group. This reporting season is getting warmed up with more this week (Costco, Burlington, Dollar Tree, Best Buy, GAP, Dick’s Sporting Goods, and more).
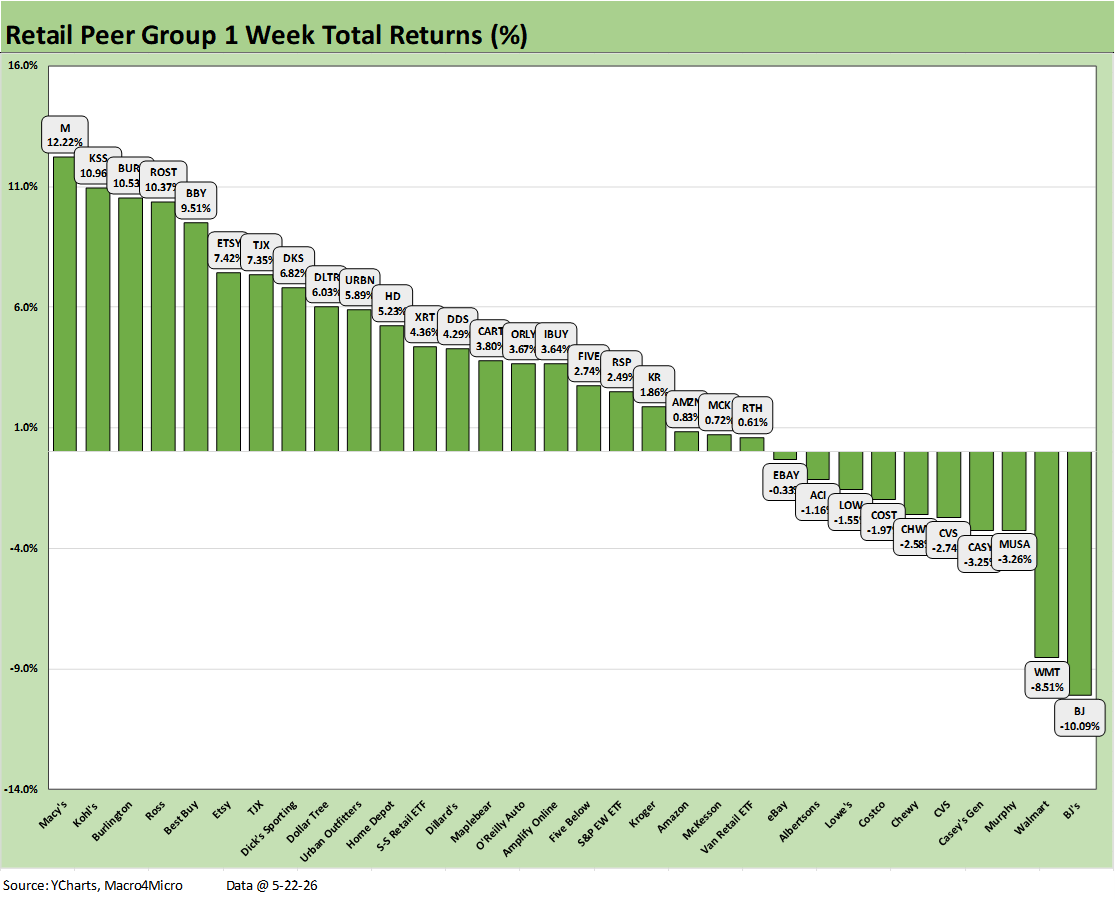
The retail sector the past week had some notable releases with Walmart, BJ’s, Ross Stores and Home Depot at the top of the list. We put together a “comp list” to track 32 asset lines including two retail ETFs as we detailed earlier.
Over half of the names are in the large cap bucket with most of the rest being midcaps with only one name smaller than $5 bn in market cap (Kohls, KSS). We will fine-tune the list in future commentaries. This is our first cut at a broad retail peer group to track. There were some interesting ones left off, but we will adjust the list over time for material moves.
The score for the week of 22-10 was a good sign all things considered. That is despite the bellwether low price players Walmart and BJ’s taking a beating on the week. Getting a read on the trade-offs of cost pressures vs. consumer behavior will take more digging into the transcripts than we can do for today’s commentary.
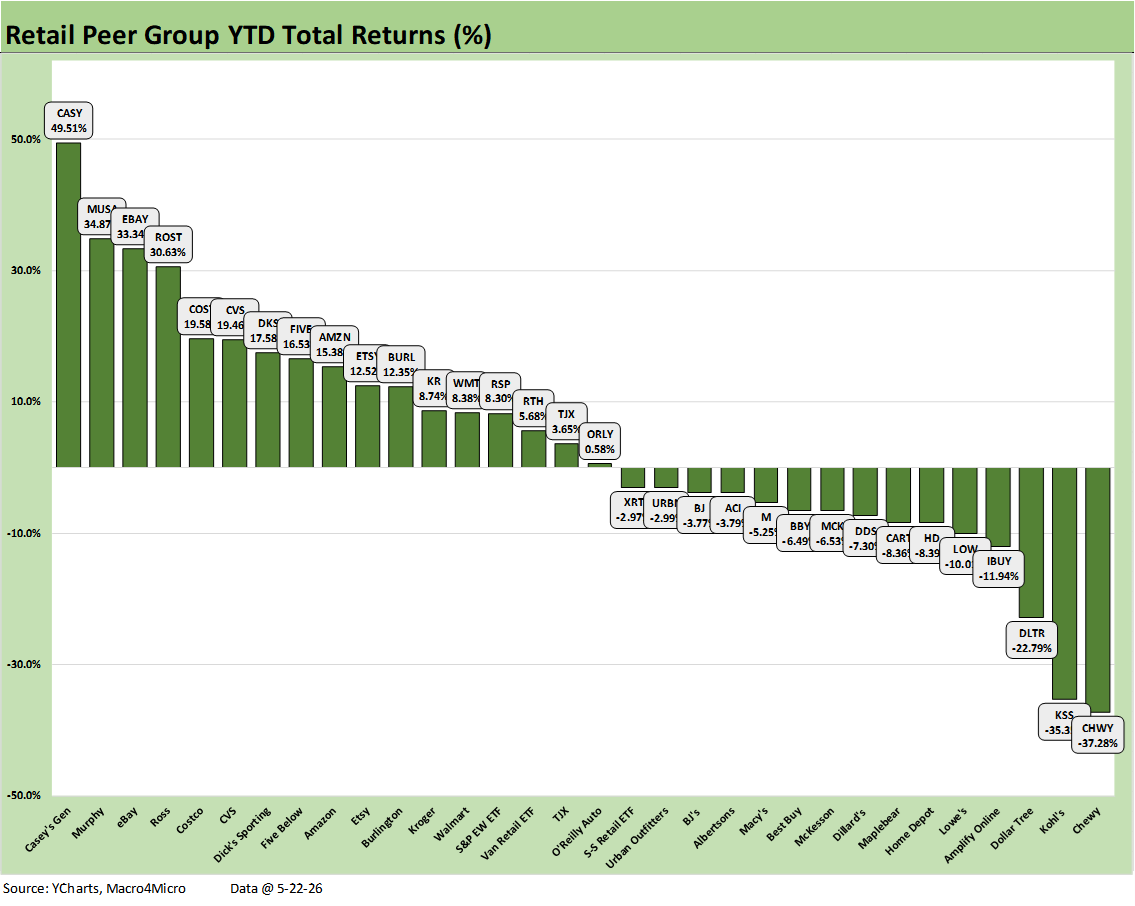
The YTD profile of total returns in retail shows a mix of winners and losers that was essentially evenly divided with a score of 17-15. There were “only” 5 double-digit losers in the bottom quartile.
The good news was that it took +16.5% to make the top quartile. The median in the 32 asset lines is barely positive, so it is not exactly a cause for celebration. For those of us who grew up on the credit side of the business, the question for retail exposure was often simply “Who will Walmart or Amazon bankrupt next?” Those retailers who have adapted to the digital world and found the right formula for their strategies to succeed and adjusted to the changing times have performed well. One of the ETFs we have not given much focus to is the small IBUY ETF with names such as Maplebear (ticker CART, Instacart owner), Carvana, Etsy, and eBAY among others.
The only certainty for the retailers is that every year will be brutally competitive as they adapt to the world of tariffs while keeping an eye on their core product offerings, cost structures, and financial risk profiles.
The array of bellwether legacy brand bankruptcies and/or liquidations is well known to the retail world and investors across the years (JCPenney, Nieman Macrus, Saks, etc.). It does not take much of a Google or AI search to see the retail sector financial carnage across the cycles. It is a long list of Chapter 11 stories and liquidations.