
D.R. Horton: Financial Powerhouse Despite Cyclical Softening 5-20-26
As the #1 US homebuilder by units, D.R. Horton numbers offer a good gut check on a weak housing cycle.


D.R. Horton (DHI) is the perennial #1 builder by units ahead of Lennar. As we saw in the most recent fiscal quarter, DHI is also occasionally #1 by quarterly home sales revenues. DHI also is by far the #1 homebuilder in market capitalization value at over $38 bn (5-20-26) vs. $20 bn for Lennar and $21 bn for Pulte.
The breadth of DHI’s scale and low average ASPs vs. major peers offers a good vantage point on the health of national homebuilding. Regional ASPs run from around $296K in the South Central geographic segment to $543K in the Northwest segment.
As an industry proxy, DHI results show the moderate softening in homebuilder fundamentals with gross margins facing pressure, pricing softer, and incentives still a key source of support. The result broadly has been weaker gross margins.
DHI’s 2Q26 and 1H26 period (DHI 9-30 fiscal year) show lower home sales revenue, a lower average selling price, and mixed volumes by region. At least sales orders and backlogs are higher YoY.
The slower market allows DHI to stay aggressive on share buybacks as working capital demands are muted. That still supports strong discretionary free cash flow generation. Volumes for the remainder of 2026 will be subject to cyclical factors and how mortgage rates play out against FOMC policy with UST curve trends facing Iran and tariff effects on inflation. For now, mortgage rates have moved 75 bps higher off the lows to 6.75% this week before easing back to 6.67%. FOMC odds for now favor hikes over easing.
Balance sheet trends at DHI feature impressive asset coverage with home inventory over 6x total homebuilding debt. The intrinsic cash flow flexibility of DHI’s working capital management presents strong single A tier credit risks for a company that has proven itself across myriad macro backdrops after a wild cycle since 2019 with a pandemic, an inflation spike, Fed tightening, and adverse tariff impacts on supplier chain costs.
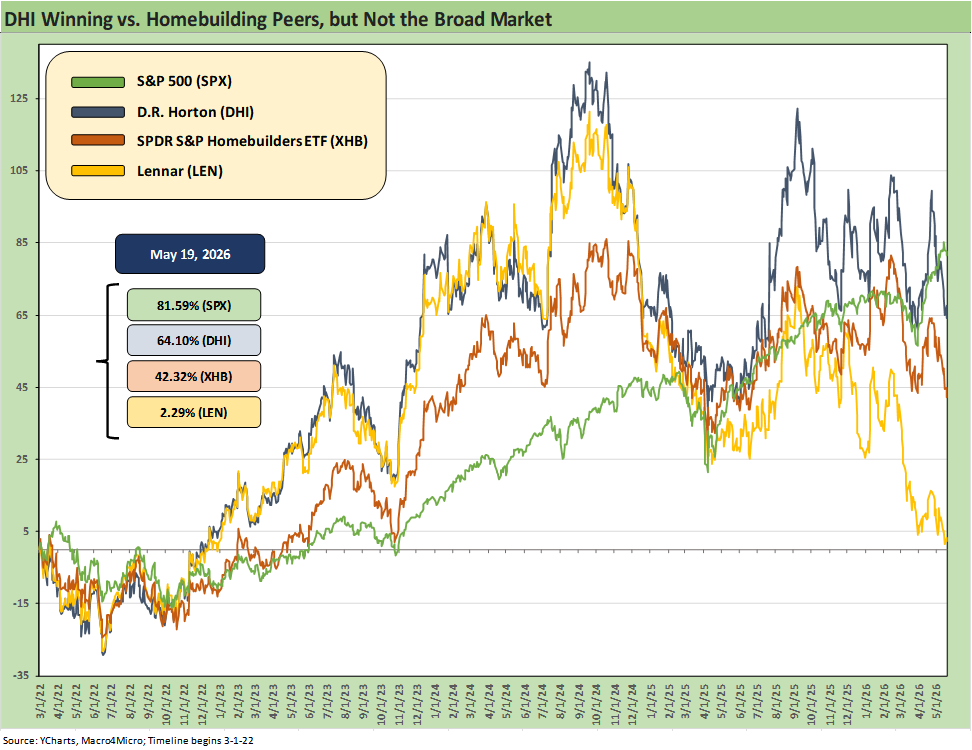
The above chart frames the equity return performance of DHI since the start of March 2022 during the month ZIRP ended. The visuals are a bit too busy, but the boxes on the left cover the hard facts. The housing bill that is supposed to support affordability brought some good headlines today that saw the homebuilders pop with DHI and LEN up over +5% and XHB at +4.3%. Mortgage rates have tailed off slightly from this week’s highs.
The homebuilders have lagged the broad market S&P 500, but DHI has been a superior performer vs. the Homebuilding ETF (XHB), which includes suppliers. Of the biggest two homebuilders by revenues, DHI materially outperformed Lennar. We look at the broader peer group and more time horizons in the next table.
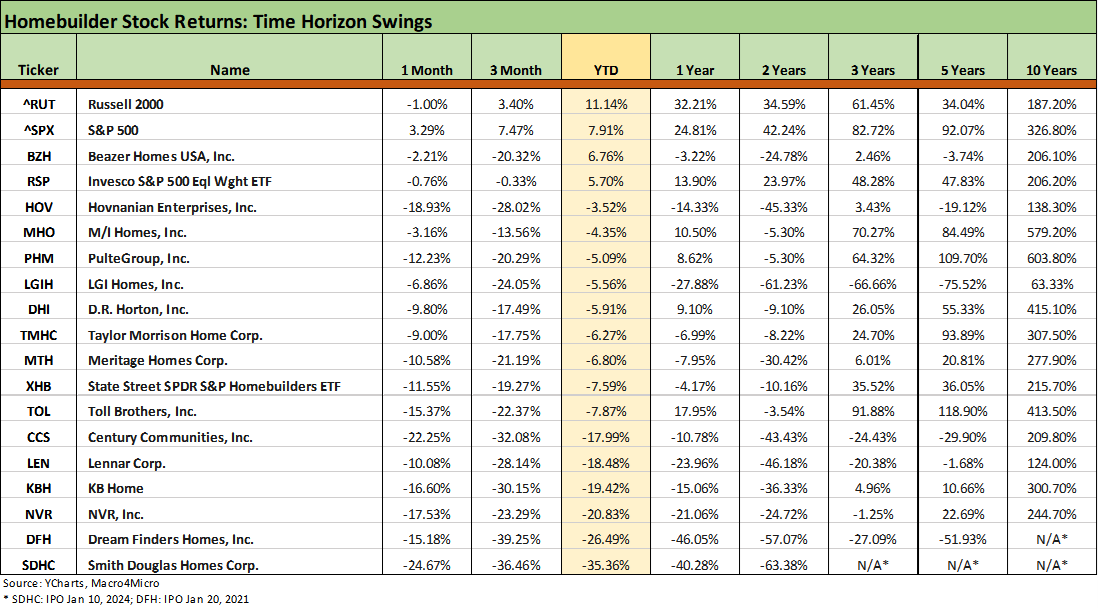
The timeline and peer returns show a wide range with very little good news in 2026 for homebuilders. All the builders are negative YTD ex-Beazer which comes with the asterisk of a takeover attempt (by DFH) of a company that has posted negative returns over the trailing 5 years. The worst performer in the pack has been low cost/low price operator LGI Homes. Beazer (BZH), Hovnanian (HOV), and Smith Douglas (SDHC) show the smallest market caps and are closer to the half billion mark.
The weak performance of Lennar (LEN) as a major national builder is a sign of builder trouble. The same is true with NVR and KBH with less regional diversity relative to DHI.
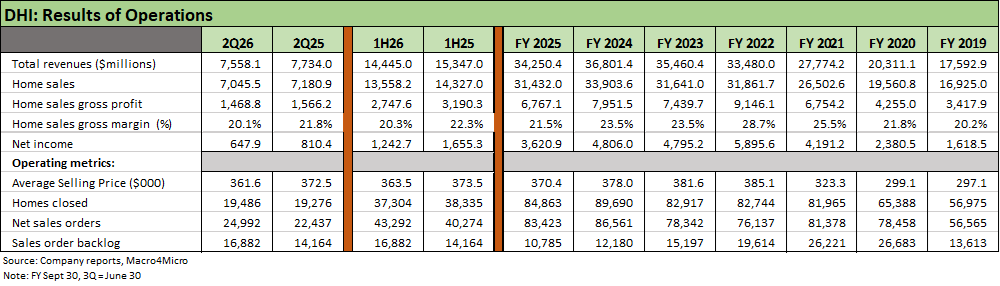
The above table details the trends for the revenue and earnings lines. The home sales gross margin history shows a move from a 20% handle in 2019 up to a FY 2022 peak just below 29% and now back to the 20% area in 2Q26 (20.1%) and 1H26 (20.3%). The 1Q26 and the 2Q26 gross margins benefited from lower-than-expected warranty and litigation costs that added 40 bps to gross margins. That explains the slightly lower guidance below the 20% threshold for 3Q26.
DHI is guiding to 19.7% or higher in 3Q26 as the seasonal peak continues into the summer. The cost side of the equation in FY 2026 has been construction cost savings but modestly higher lot costs. Profitability metrics overall are solid even if below the distorted levels of the post-COVID period of 2021-2022.
We have reviewed DHI results across the post-pandemic years in the links at the bottom of this commentary. The fact remains that total revenues and gross profits have almost doubled during the period since 2019 in a very impressive performance considering the mortgage rate swings. “Homes closed” rose by almost 50% from FY 2019 to FY 2025 and average selling prices are higher by around 22% into 2Q26 vs. 2019.
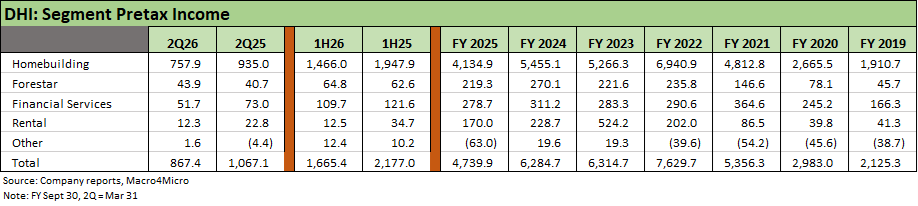
The above table runs through the income mix for the “Operating Segments” before we detail the Homebuilding “Reporting Segments.” Homebuilding is clearly the dominant operating segment with majority-owned Forestar (62% owned, ticker FOR) a separate, publicly traded company. FOR is an important part of the homebuilding land/lot supply chain but still one that provides only a small minority of DHI’s requirements.
We get an impressive amount of revenue and profit disclosure across the business lines in the consolidating financials presented each quarter. Those individual segments are distinct business line operations with stand-alone funding. Those units are borrowers with no guarantees from the homebuilding operations. We produce a sample consolidating balance breakdown in the last chart.
The DHI operating segments are all focused on homebuilding and related activities along the builder supplier chains from finance to land/lot development. The Rental segment is part of the build-to-rent (BTR) business.
Build to rent is a small business in the overall mix…
The pending housing legislation in Washington (21st Century ROAD to Housing Act) has been a challenge in terms of reaching legislative consensus. The Senate bill attempted to deter institutional capital from expanding their housing holdings and thus reducing affordable supply.
The Senate bill as written undermined the economics and attractiveness of the BTR business without appearing to grasp the distinction between total new housing supply and legacy existing home supply for sale. The simple guideline should be how to increase housing supply overall – not limit housing stock growth while limiting rental options.
The House version justifiably pushed back on rules such as mandatory sale of the home by year 7 in addition to other disincentives. The “forced sale” provision came under withering criticism since BTR strategies expand the housing stock as well as consumer choice. The House took that out after discussions with the White House. A few senators still seem to object, so the bill is not done yet per the headlines today. Now that the House version is done, it needs a fresh sign-off by the Senate.
Housing interests mounted very rational and economically coherent arguments detailing how such actions on BTR are bad for housing supply (see NAHB Applauds Lawmakers’ Push to Remove Harmful Mandate from Major Housing Package 4-23-26). The mere existence of such a provision would be damaging to new home investment potential, undermines credit availability for the space, and damages exit strategies for those who have invested.
For DHI, this threat was not a material risk, but it would chill new projects in the industry. Buying existing homes into investment funds makes sense to curb given the goal of the bill (available supply to buy), but building new supply supports longer term housing supply-demand dynamics. As the smoke clears on the back and forth of the bill language with the White House and Senate, final language still needs to be voted on by the Senate and then the White House.
Per Politico (5-19-26)
The updated text of the 21st Century ROAD to Housing Act includes changes to a provision aiming to limit Wall Street’s ownership of single-family homes so it now more closely resembles the Senate’s version. The House version still strikes the Senate language requiring single-family homes that large institutional investors built as long-term rentals to be sold within seven years to individual homebuyers.
While BTR is a very small part of the DHI total business, the compromise is favorable for long term supply and poses a much smaller threat to the supply-demand dynamics of the existing home sales levels that dominate total housing inventory.
The bigger problem is the question of Congress mastering the basics of supply and demand and allowing homebuilders to decide how to make investments that work for them as well as housing needs and consumer choices. If Congress watched the deficits more closely and discouraged geopolitical policies that spike oil costs and negatively impact the UST curve, mortgages would be more affordable.
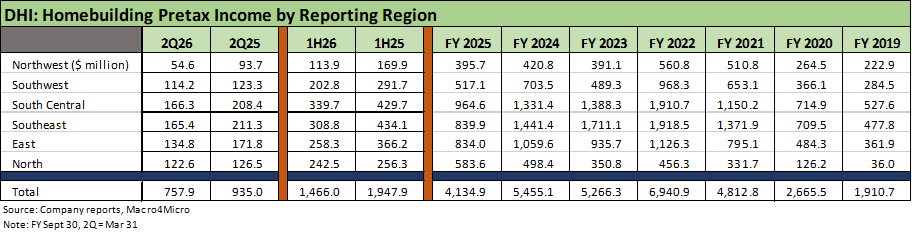
The above table details the earnings of the regional reporting segments for homebuilding. The next two tables cover the volumes and average sales prices. While volumes will necessarily track the largest housing markets, the ability of DHI to sustain steady organic growth over the years has been impressive.
DHI has not been an active M&A leader on the scale of Lennar but just keeps on growing. The company even cited a move into some of the lowest price tiers in Texas on the earnings call. There are ample opportunities to expand, and they also cite the North region as one where they have the opportunity to grow share.
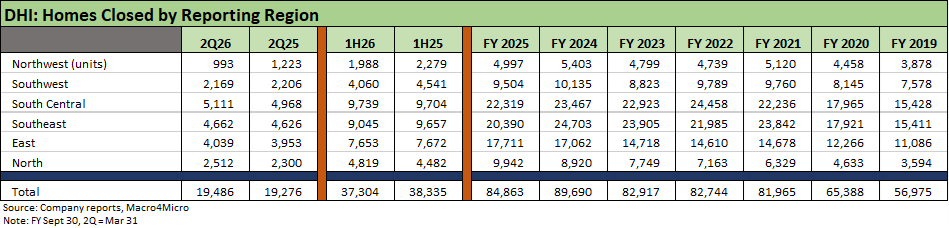
The above table details the sales volume of homes closed by region. Homebuilding is in its simplest terms a “price x volume” business with an analytical framework that wraps around gross margins and the working capital cycles and cash flow deployment.
Longer term volumes are heavily driven by favorable demographics, but short-term demand sensitivity can be heavily influenced by monthly payment trends even more than ASPs since the sensitivity of affordability is more tied to mortgage rates.
Mortgage rates just hit 6.75% this week after making brief “attempts” to get below 6.0% across the current cycle. They edged down today to 6.67%
The South Central region is out in front at #1 in the geographic segment that includes Texas. The Southeast ranks #2 in the segment that includes Florida. We break out the mix of states and how they roll up into the segments in the next table.
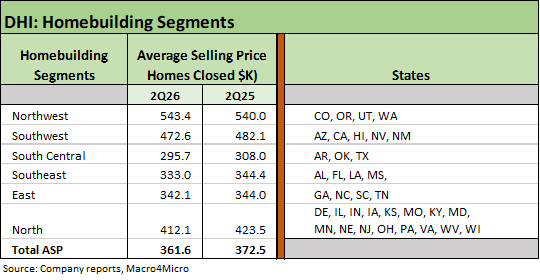
The above table details the DHI average sales prices across its various geographic regions. We also show which states are in which regions since homebuilders can often be “creative” in how they classify the map.
As the builder with the largest scale by units and a broad national profile, DHI also posts the lowest aggregate ASPs of the majors. DHI was even lower than LGI Homes this quarter. As noted in the chart, the highest ASP was posted in the Northwest segment at $543.4K and the lowest ASP is South Central at $295.7K. That shows a diverse range of product offerings in the broader national homebuilding operations.
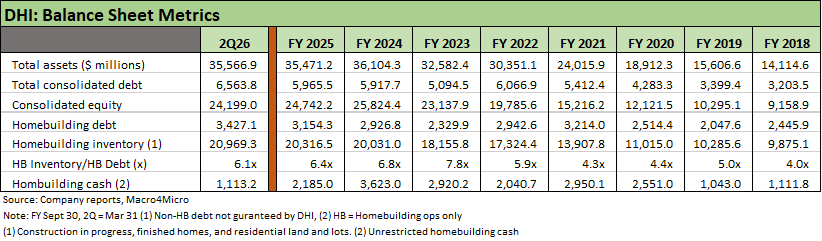
The above table details the timeline on the asset base and the steady expansion across a cycle since 2019 that saw macro conditions and mortgage rates vary in dramatic fashion with the pandemic, inflation, tightening, and ensuing easing ahead of this latest round of mortgage rate pressure.
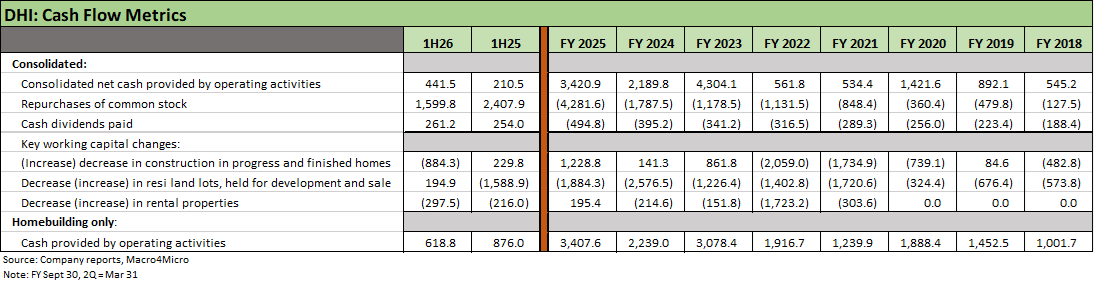
The above table updates the running cash flow metrics of DHI and once again reinforces the extraordinary resilience of discretionary free cash flow across a wide range of economic backdrops.
The easy generalization is that markets which are slowing down generate free cash flow. In contrast, ramping up construction and inventory of lots reduces cash flow given the high investment. That gets back into “old school” inventory turnover trends which the homebuilders routinely discuss as they make their cases for their improving efficiency.
The line in the table for “repurchases of common stock” makes a statement on how cash gets deployed, and that is at a time when homebuilder equities are under pressure. As we have discussed in earlier commentaries, the running returns on the Homebuilding ETF (XHB) saw a LTM near +70% return in the fall of 2024 before life got challenging again with the UST curve steepening into 2025 and homebuilder returns getting undermined (see Footnotes & Flashbacks: State of Yields 9-29-24 , Footnotes & Flashbacks: Asset Returns 10-27-24). As DHI rolled into 2025, we see the shareholder rewards line get more important in the direction of the cash flow deployment.
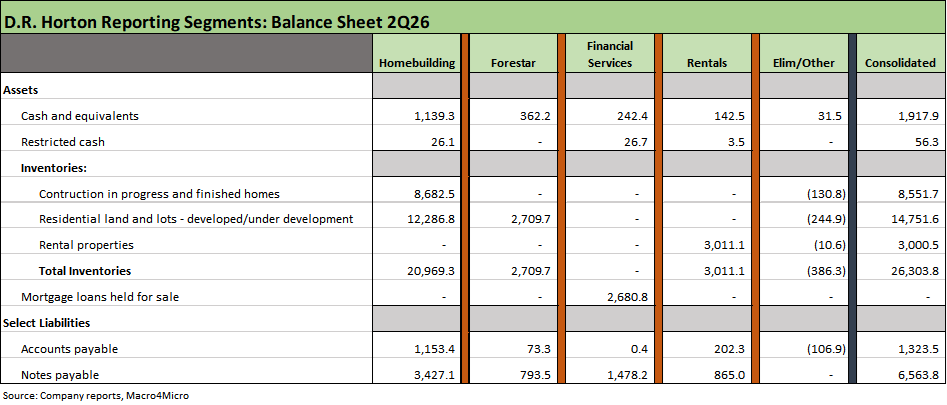
The above table is provided as a sample of how the balance sheet line items cut across the business lines. The different business units outside the Homebuilding segment are not guaranteed by the homebuilding entities. That makes the asset protection for DHI bondholders much stronger.
We covered those non-guarantor details in an earlier Credit Profile on DHI (see D.R. Horton: Credit Profile 8-4-23). The income statement has the same type of breakouts each quarter, but in substance all the units are about building, financing, or renting homes.
See also:
D.R. Horton 3Q25: Material Slowdown Still Good Enough 7-22-25
Credit Snapshot: D.R. Horton (DHI) 4-28-25
D.R. Horton: #1 Homebuilder as a Sector Proxy 1-28-25
Credit Crib Note: D.R. Horton (DHI) 8-8-24
D.R. Horton: Ramping Up in 2024 Despite Mortgages 4-19-24
D.R. Horton: Credit Stronger Even if Stock Takes a Step Back 1-29-24
D.R. Horton: Credit Profile 8-4-23
Single Family Rental: A Major D.R. Horton Asset Sale 6-6-23
D.R. Horton 2Q23: Company Comment 4-21-23
D.R. Horton: Bellwether Leader Weighs in but Real Test is Ahead 1-27-23