
CPI April 2026: 4.1% All Items Less Shelter, 30Y UST 5%
The CPI report confirms some ugly numbers with headline CPI up to 3.8% and slamming real wage growth.


We are still a long way from the Weimer or the 15% handle 10Y and 30Y UST of 1981.
· Headline CPI at 3.8% and Core CPI at 2.8% remain well below 2022 but will complicate Warsh’s sales pitch to the FOMC. Warsh probably cannot “trim those means” in PCE fast enough to help his case to ease. In the meantime, energy costs will be flowing into operating costs and raw materials while eating into discretionary consumer household cash flow and confidence.
The rise in the “All item less shelter” CPI to 4.1% vs. 1.9% in Dec 2024 (Biden’s last month) is an eye opener with Services CPI still sticky and Energy CPI lines spiking. We see more upward pressure on “Food at home” as YoY levels rose MoM by more than a point to 2.9%.
Even if the 17.9% CPI for Energy total and 28.4% for gasoline steals the headlines, that stubborn and steady electricity inflation at 6.1% is one that is going to be hard to shake and is not directly tied to the Strait of Hormuz (even if Hormuz seems to tie into almost everything these days).
There is always a desire to want to dramatize higher interest rates and inflation despite the fact that 2022 did not even bring a recession under Biden and the UST curve we see today is dwarfed by the early 1980s. That does not change the fact that both are bad news right now, and the impact on the consumer and economics of valuing projects could also flow into the valuation of growth equities.
One angle for the half-full crowd is that pricing power can be good for equities even if bad for bonds as long as there is confidence that US-Iran and the strait will get resolved sooner rather than later. Trump stating that he did not even read the whole Iran proposal fails to inspire confidence even if it reminds us why he closely protects his education transcripts (reading helps).
The Iran-US gap on terms and current vacuum leaves a lot of room for dire scenarios if the Strait stays closed into the early summer and peak driving season kicks into gear. There is also the risk of Congressional action to curb exports of refined products to relieve the US consumer, which in turn would be a disaster for some trading partners.
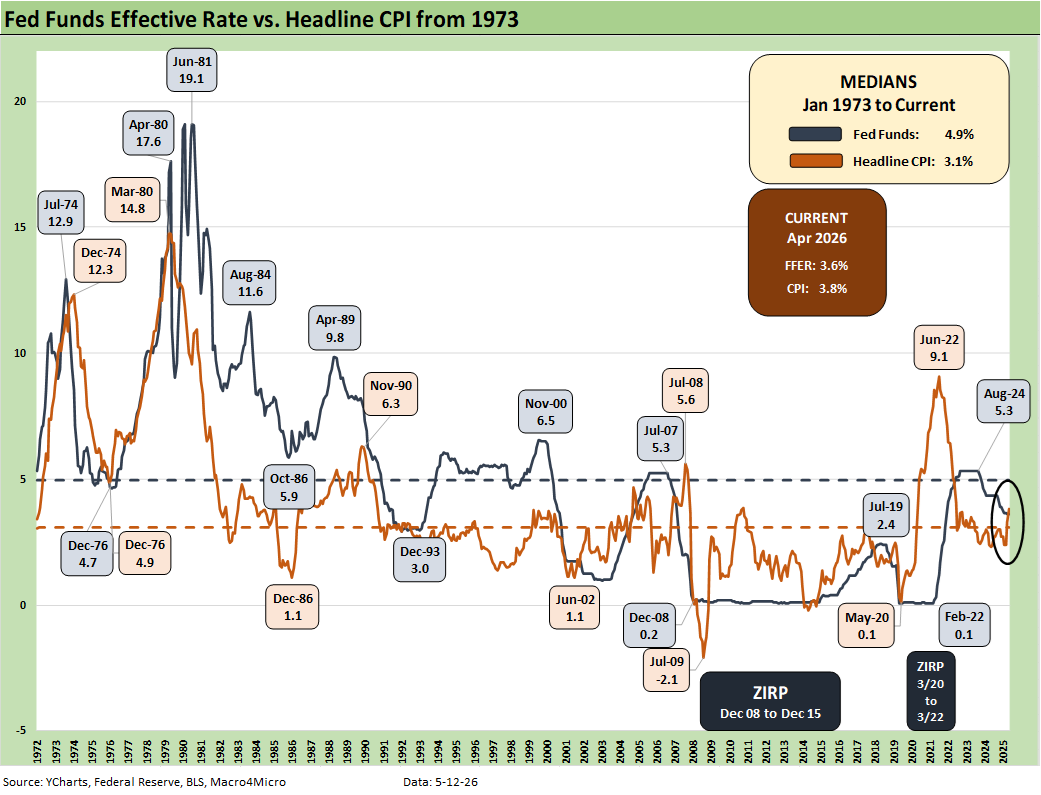
The above chart plots the historical time series for fed funds vs. headline CPI, and the headline CPI just moved higher. We also include the long-term medians, which underscores that this is “not normal.” You can tell the consumer that “core is all that matters” but just don’t do it while he is filling up his gas tank on the way to the grocery store.
“Core” (or PCE more than CPI) may be more significant to the debate around inflation (as defined by economists and monetary junkies), but the purchasing power and the relative affordability of the household basket is about real wages and what in that basket may have to change.
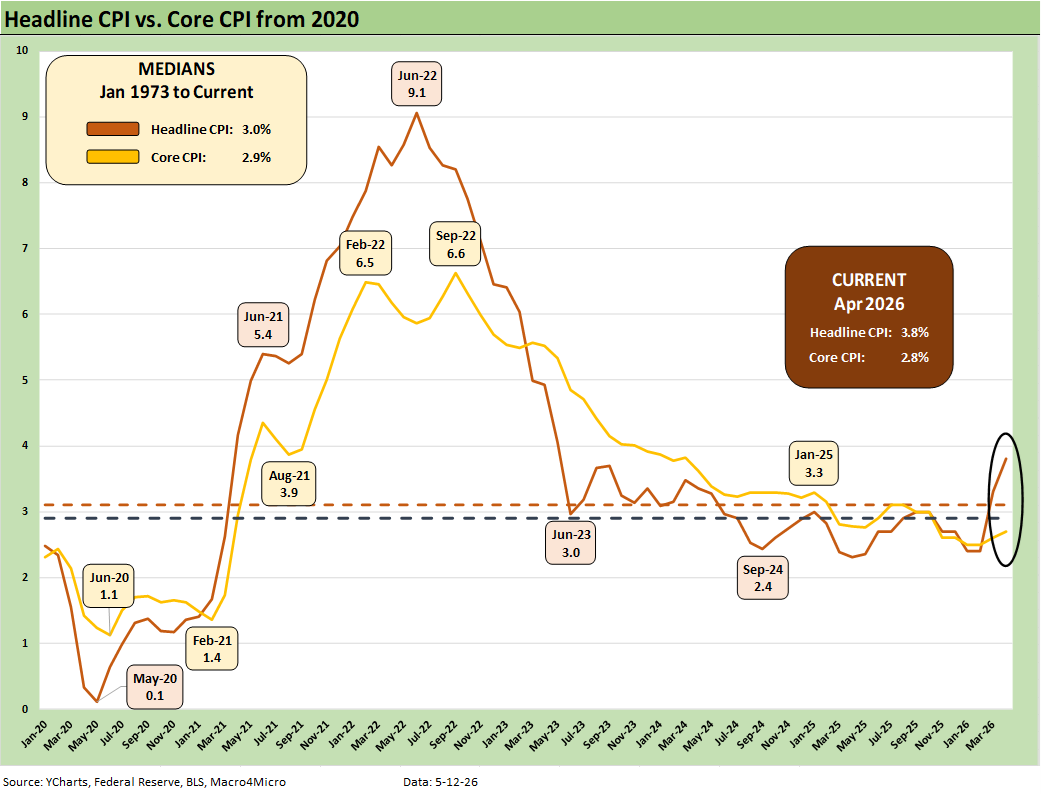
The above time series for headline CPI vs. Core highlights the divergence of the two in this market backdrop. We see some of the highs and lows of the post-COVID timeline with 2.4% Sept 2024 headline level that should call for treating Powell with a little more respect rather than giving him (and the collective FOMC) the electric chair (which now costs much more to operate).
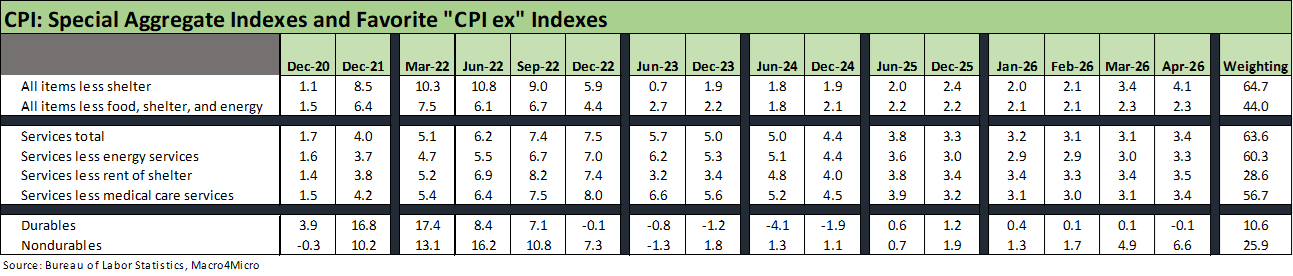
The above table updates some of our favorite special aggregate CPI indexes. While we see some good news from durables this month, the nondurables line is closer to 7% than 6%. Services remain sticky in the 3% range but are now trending higher again after a period of moving lower.
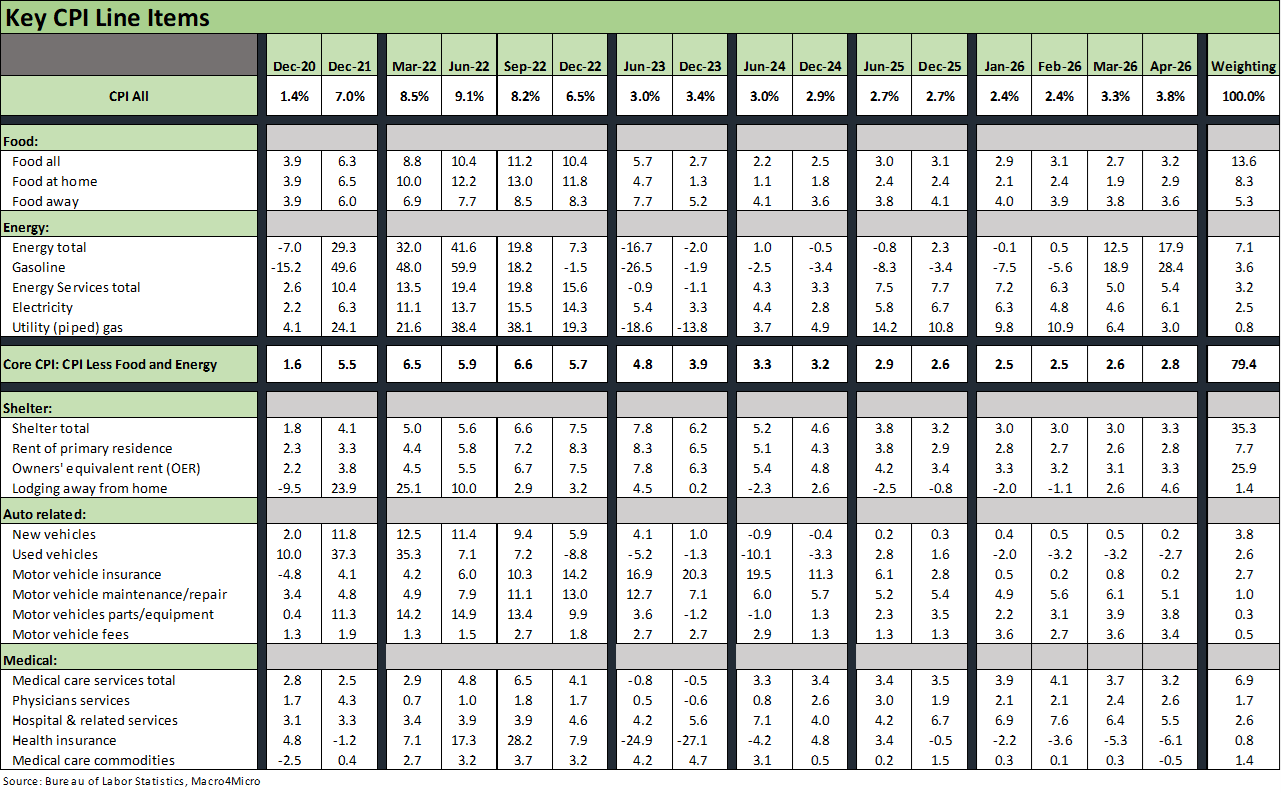
The above table details our Big 5 subsectors for CPI. These roll up to around 75% of the CPI index, so overall this mix is the main event. We will not replay our reluctance to embrace some of the lines that are derived and not consistent with the household checkbook experience” (notably shelter and the deflationary health insurance) but the lines speak for themselves.
The energy and food buckets are the clear adverse moves and the higher costs of housing (when including financing and the monthly payment pain). With many households crushed by health care premiums (notably ACA), they are not “feeling the deflation” in health insurance seen in the chart. Those that struggle with coverage then get held hostage to the rising costs of services as broken out. The 5.5% for “hospital and related services” is not rising but it is high.
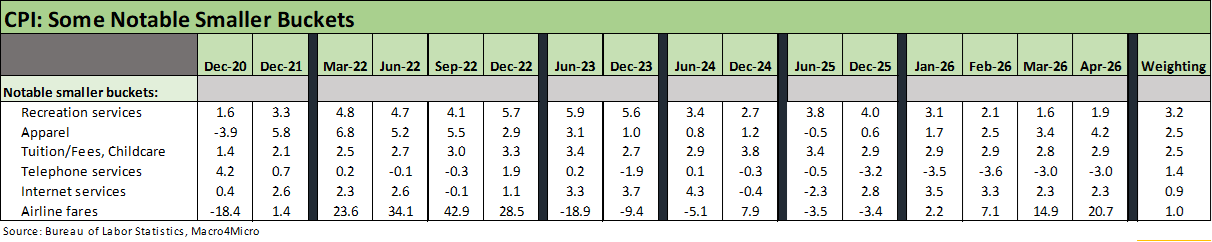
The above table breaks out some product lines near and dear to households. We see 4 of 6 higher in April and 2 flat to March. Recreation Services have moderated from the higher levels seen over the recent cycle. That is “good news, bad news” since it might also imply a softening of the consumer sector. Driving or flying to the destination certainly costs more now. Apparel might get some more relief from the arbitrary tariffs slapped on low cost “labor arb” countries that dominate apparel.
See also:
Market Commentary: Asset Returns 5-10-26
Employment Situation: April 2026 5-8-26
New Home Sales March 2026: Favorable Volume, Weaker Prices 5-5-26
JOLTS March 2026: Openings Down, Hires Up, Layoffs/Discharges Up 5-5-26
PCE Inflation, Income & Outlays March 2026: Inflation Anxiety Level? 5-3-26
1Q26 GDP Advance Estimate: Consumer Fade, Investment Boom 4-30-26
Synchrony Financial: Favorable Consumer Credit Signals 4-24-26
Industrial Production March 2026: Mixed Picture, Big Questions Ahead 4-16-26
Existing Home Sales March 2026: New Beginnings or New Ends? 4-15-26
Producer Price Index March 2026: Heater or Curve Ball? 4-14-26
4Q25 GDP: More Adverse Revisions in the Golden Year 4-9-26
The US as an Aspiring Emerging Market: Fiscal SNAFU, Political FUBAR 4-6-26
UST Deltas: Elevation Realities 3-29-26
Market Lookback: Confusion Reigns, Dislocation Pours 3-22-26
Market Lookback: The Gulf of Cause and Effect 3-15-26