
Housing Starts April 2026: Soft Starts in Single Family
April total housing starts down MoM and up YoY, completions up MoM and down YoY, permits up MoM and down YoY.


The headline starts number is mixed across single family vs. multifamily with single family starts declining by -9.0% MoM from March and -2.4% YoY. All four regions saw starts decline MoM. On a “not seasonally adjusted basis,” we see single family YTD at -5.1%.
Multifamily had a good month on starts with +14.3% MoM and +23.3% YoY on a SAAR basis. On a “not seasonally adjusted basis, the YTD change for multifamily is +22.7%. The West region posted a major increase in multifamily YoY with total starts at +49% YoY but only +7.3% YoY in singe family.
Permits were up in total MoM by +5.8% and down slightly YoY at -0.2%. Permits were down -2.6% in single family MoM and -5.5% YoY.
The housing headwinds are only in part about mortgage rates since the 6.51% for Freddie Mac 30Y this week is worse sequentially but is still framed against 6.86% this time last year for that benchmark rate. The Mortgage news Daily survey today is 6.65%.
We looked at industry leader D.R. Horton (DHI) this week as a good bellwether indicator of what is going on in the housing markets. DHI is the perennial #1 in units sold and occasionally the #1 in dollar terms as well (including the most recent quarter). With the lowest average selling prices of the major homebuilders, DHI offers a good angle on the “real world” in homebuilding volumes and prices across regions (see D.R. Horton: Financial Powerhouse Despite Cyclical Softening 5-20-26).
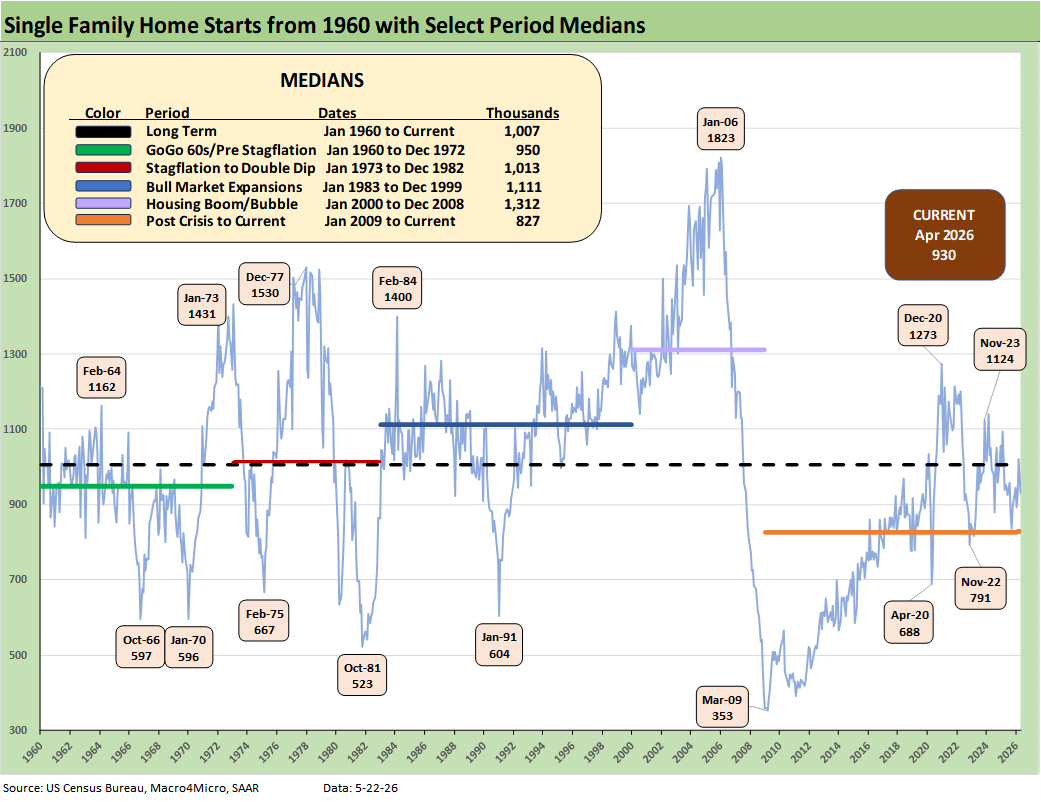
The above chart offers a clear reminder of the wild single family residential construction cycles across the decades. With favorable demographics for housing demand, the current starts run rate of 930K is still well below the long-term median and below all the timeline medians posted. The exception is the current median for the “post-crisis” period (crisis = housing sector bubble, RMBS shock, and near meltdown of the bank system).
The current backdrop includes mortgage rate pressures on the affordability of monthly payments that are likely to get worse from here. That comes after seeing mortgage rates flirt very briefly with crossing below the 6.0% line on Feb 26, just before the Iran War. This past week hit the 6.75% area before the modest rally of the UST curve.
Even if the FOMC shifts its policy back toward easing under Warsh (good luck with that FOMC vote count), the potential for a UST curve steepening would remain a material risk factor as the inflation variables work their way through the system. The bear steepening risk is alive and well as is the case with an upward shift of the curve.
As we go to print today, the “Vegas line” (i.e. FedWatch) shows a 0% chance of a cut by the Dec 2026 FOMC meeting. In a major setback for “easing bulls,” the odds of 1 hike is at 42.5% and now greater than the “no change” odds at 30.7%. For 2 cuts, we see a 21.5% probability. Those odds will jump around but are signaling a drag on the housing sector as Iran effects play out.
As noted in the bullets, single family starts were soft in relative terms vs. headline total starts with multifamily starts rolling along favorably (detailed further below).
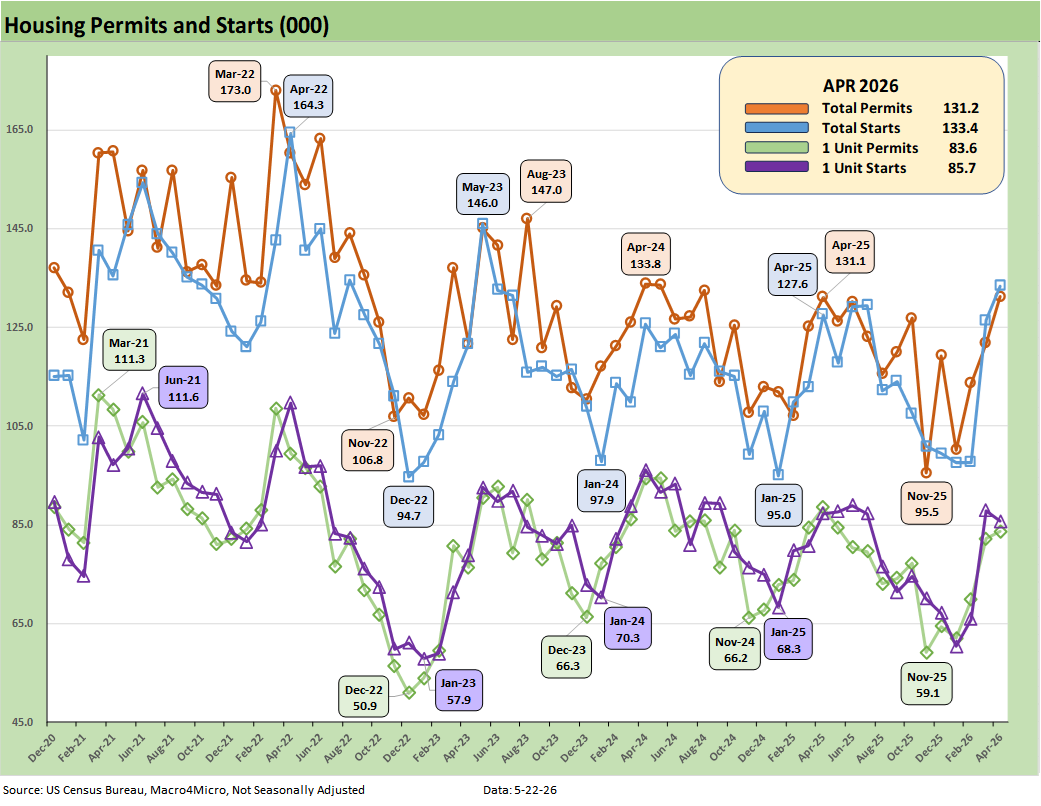
The above chart plots total permits and total starts on a Not Seasonally Adjusted (NSA) basis. NSA is viewed as closer to what is going on in the trenches without the SAAR model assumptions.
For April 2026, we see NSA total permits essentially flat YoY and single family permits down by -5.5% YoY. For MoM, total permits were +7.7% with single family permits up +1.7% MoM.
For total starts and single family starts on an NSA basis, we see total starts up by +5.5% MoM and single family NSA starts lower by -2.5% MoM.
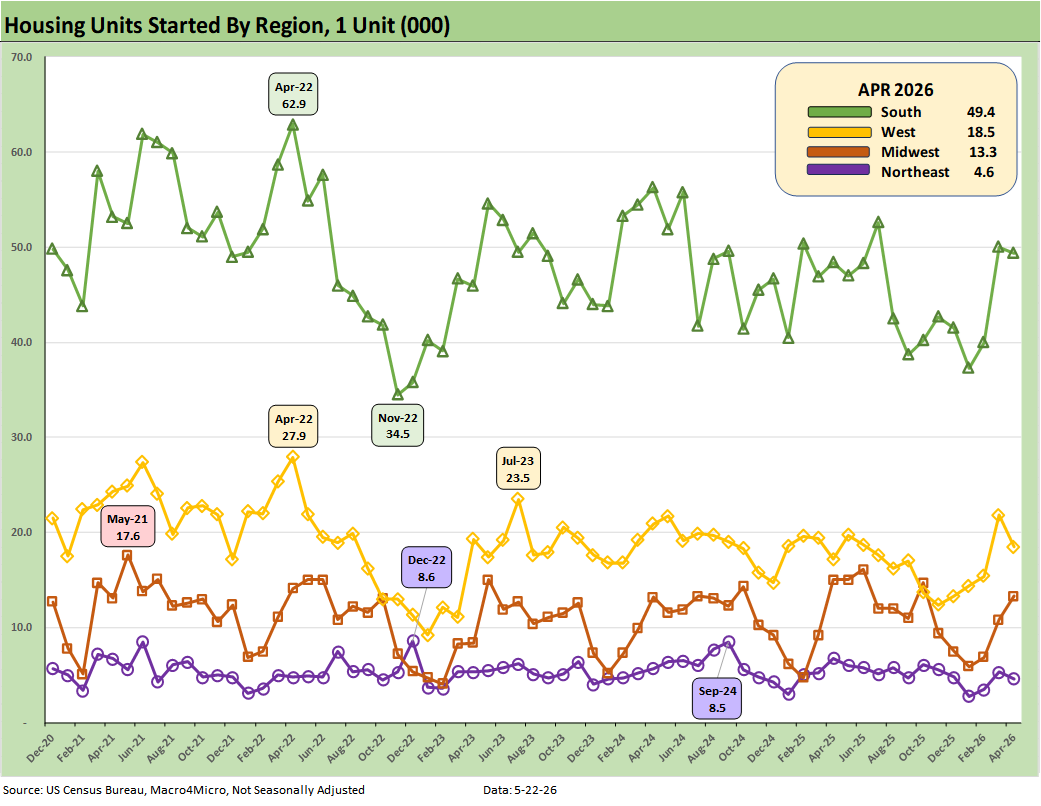
The above plots the single family starts by region (NSA). On a MoM basis, the critical South region (totals almost 49% of total NSA starts and over 57% of single family starts) was down slightly in single family by -1.2% MoM and up by +2.2% YoY. The West as the #2 single family market was down MoM by -15.1%. The Midwest region MoM in single family was +23.1% with the small Northeast market at -13.2% MoM. The YoY NSA starts were mixed with the South and West both higher among the big two regions. The Midwest and Northeast were lower YoY.
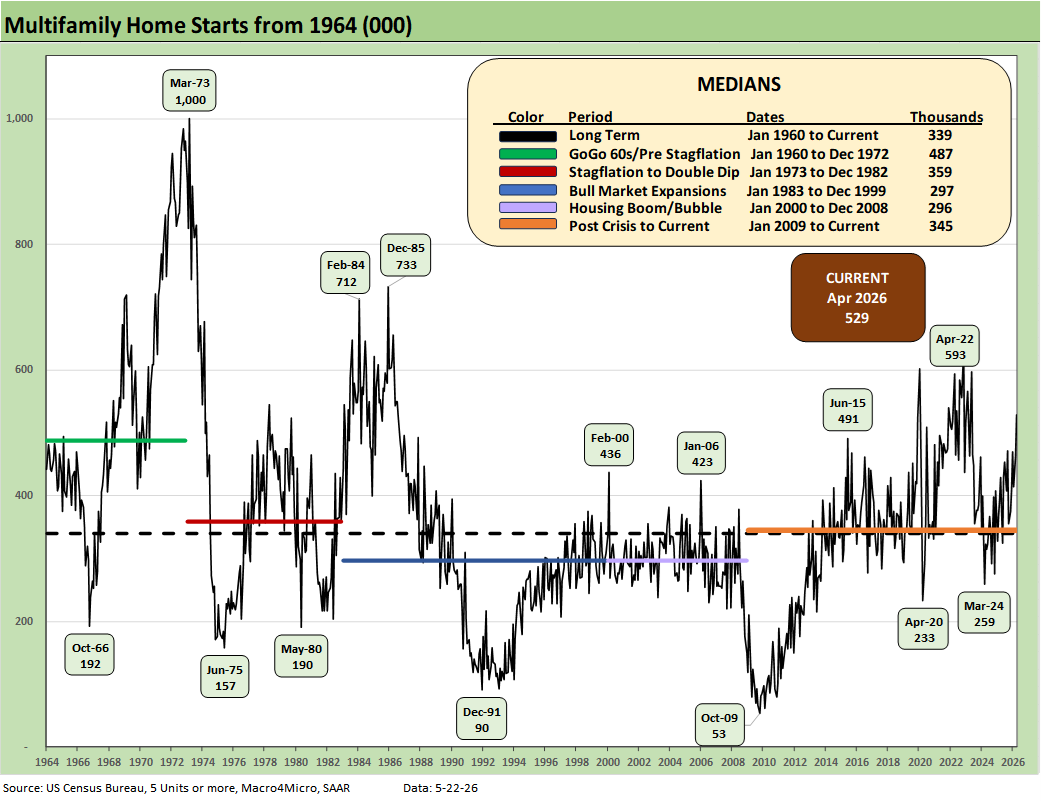
The above chart updates running multifamily starts. At +529K (SAAR), April 2026 rose by +14.3% MoM and by +23.3% YoY. The 529K is well above the long-term median of 339K, above the median from Jan 2009 to current (345K), and above the median from 2000 to 2008 (296K). April 2026 even exceeded the median of the 1960s boom (487K).
The 1960s was a period of explosive growth for multifamily with the back end of the baby boom, the postwar rise of urbanization, and the high racial migration from the South to the North all part of the multifamily tailwinds. Immigration also played an important role.
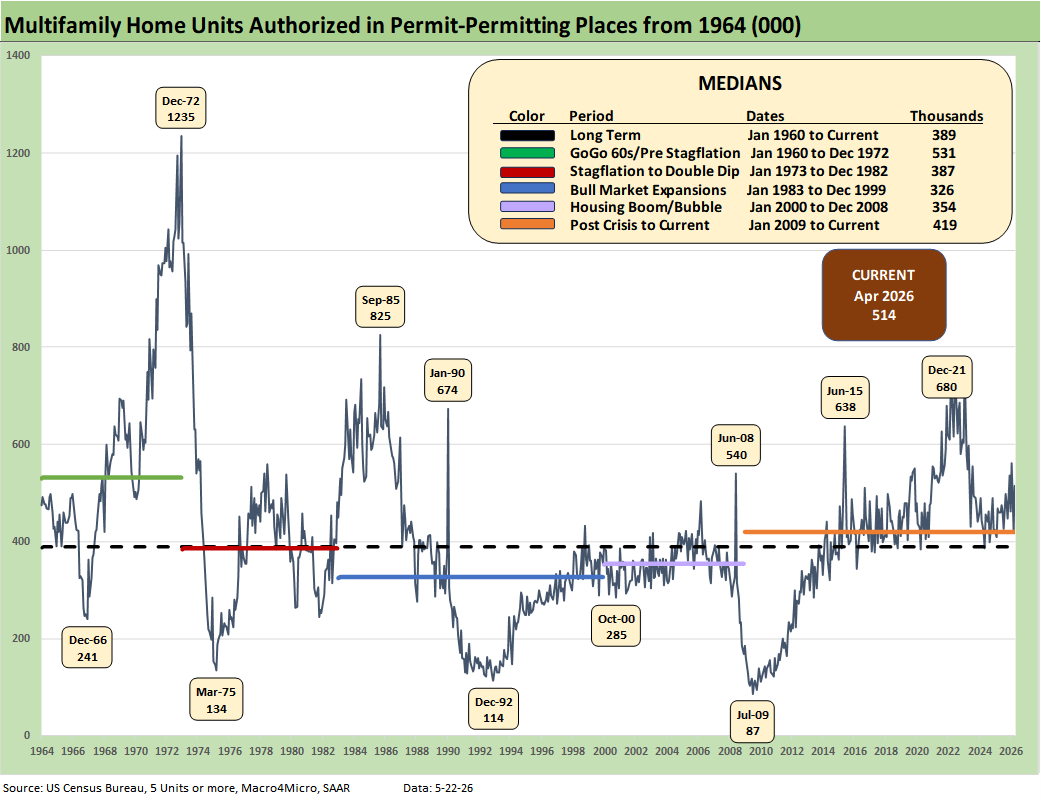
The above chart updates Multifamily permits (SAAR). The 514K in April 2026 multifamily permits rose by +22.7% MoM and by 11.5% YoY.
The bottom line on home starts as we wade into the peak selling season is that 2026 is shaping up as a mediocre year for homebuilders. This is consistent with the guidance we are getting from the major homebuilders.