
Industrial Production April 2026: Bringing a Lift
April industrial production numbers finally bring some walk with the talk, but that still does not say “ease.”


After some very mixed industrial production and capacity utilization metrics booked in March in the aftermath of the Iran War shock, April sequential trends show a recovery (see Industrial Production March 2026: Mixed Picture, Big Questions Ahead 4-16-26).
We see MoM industrial production move +0.7% higher (+1.4% YoY) for the highest sequential move to date in 2026 and up from -0.3% in March 2026. Across industry categories, Final Products production bounced back to +1.1% from a weak March that saw -0.6% with Business Equipment in April being the best performing category in that mix at +1.5% MoM and +6.0% YoY.
Total Industry and Total Manufacturing capacity utilization moved higher after a soft March overall. Durables capacity utilization moved up along with the largest manufacturing industry groups as most logged YTD highs (including Motor vehicles and parts, Aerospace, Computers and electronic products, and Fabricated metals). Nondurables ticked slightly lower as Utilities rose and Mining was essentially sideways.
The good news of an uptick in manufacturing capacity utilization is tempered by the reality that the long-term average from 1972 is 2.4 points higher, with the shortfall being a common feature across the durables industry groups.
As we have covered in past research (see Industrial Production March 2026: Mixed Picture, Big Questions Ahead 4-16-26), there have been a half dozen recession periods with higher utilization levels than what we see today. The ability to generate acceptable margins at lower utilization rates is part of the breakeven volume story lines and how unit costs (including supplier chain tariff effects) along with pricing and product mix trends unfold across various industries.
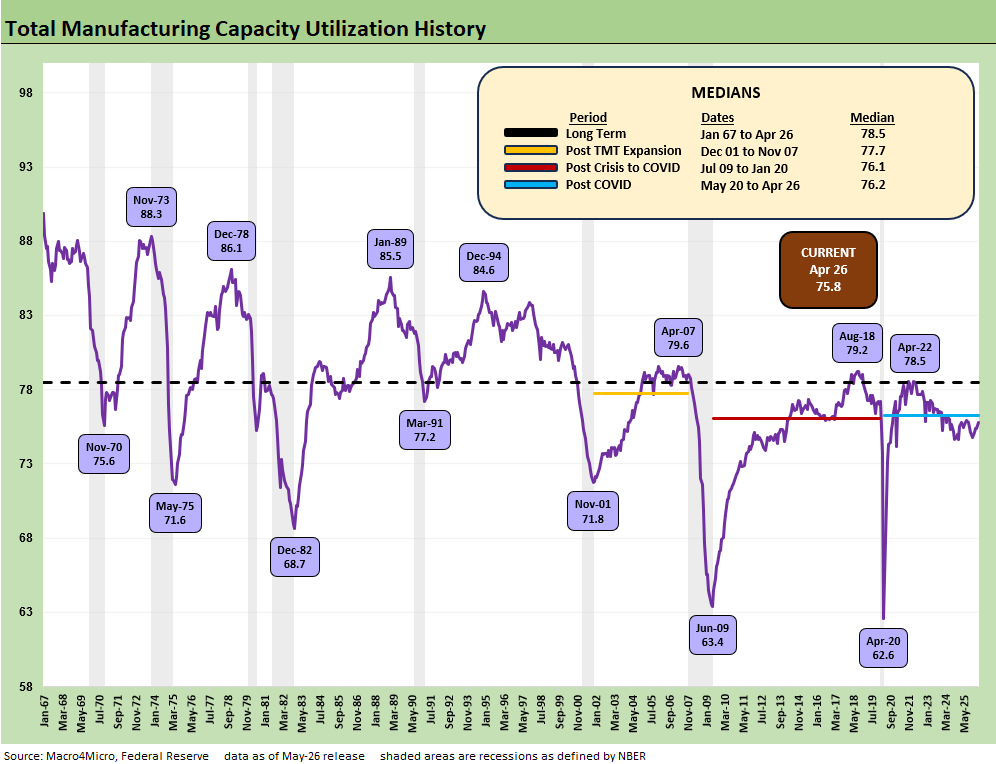
The above chart is somewhat of a regular replay of the history of the industrial production cycles across time from 1967 through today. We have covered much of this in the past, but we roll the historical recap forward for convenience.
The current 75.8% is well below the long-term median of 78.5% and below the post-COVID median of 76.2%. That is one of many metrics that take the label of “greatest economy in history” off the table. Whether GDP growth or payroll trends, the current economy is a bottom quartile economy when the growth of the 1980s and 1990s are factored in (see Presidential GDP Dance Off: Clinton vs. Trump 7-27-24, Presidential GDP Dance Off: Reagan vs. Trump 7-27-24).
The wildcard for this current cycle is the scale of the fixed investment that is now ramping up. The consumer sector and PCE have been unimpressive but fixed investment is now soaring (see 1Q26 GDP Advance Estimate: Consumer Fade, Investment Boom 4-30-26).
If you like comparing numbers (not a Washington thing), Trump 1.0 did not even frame up all that well vs. Carter and Biden – let alone the 1980s and 1990s (Gut Checking Trump GDP Record 3-5-25, Trump’s “Greatest Economy in History”: Not Even Close 3-5-25).
A brief cyclical lookback on replay…
The chart shows the material swings across expansion booms and busts. That includes the aftermath of some highly damaging oil spikes that brought on cyclical weakness and later saw capacity utilization plunge. There were a lot more structural changes underway in those cycles than just oil and gas price pressures. That was notably the case in the 1980-1982 double dip as well as the recession of late 1973 to early 1975 when the Arab Oil Embargo set off chain reactions that turned the post-1973 period into an ebb-and-flow of macro nightmares for inflation and the consumer.
The May 1975 low of 71.6% was the first bout of severe stagflation that unfolded after the Arab Oil Embargo. The 1980-1982 double dip recession came after the 1979 inflation spike took off with the Iranian oil crisis.
Capacity utilization saw a 68.7% low in Dec 1982 as the economy was just coming off the recession trough. The first Gulf War came after the August 1990 invasion of Kuwait with capacity utilization hitting a low in March 1991 at 77.2%, which is comfortably above where capacity utilization stands now in 2026.
The age of tech and credit excess in the late 1990s brought some new swoons with 71.8% in Nov 2001 after the TMT meltdown and HY default wave rolled in. The Utilities and Power sector and Telecom capex all took a beating in that time frame.
Then came the post-credit crisis low of 63.4% at the recession trough in June 2009. Mortgages and derivative excess caused a very real systemic panic and deep risk aversion from the Lehman Sept 2008 period and well into 2009. That period was famous for the bankruptcy and bailout of GM and Chrysler. The credit contraction was very real, and the recovery in payrolls was slow to unfold with the consumer hammered by housing sector pain.
COVID edged out the June 2009 utilization bottom with a record low of 62.6 in April 2020 and a 2-month recession. That pandemic period saw ZIRP, supply-demand imbalances and later the Russian invasion of Ukraine and ensuing oil spike that set off inflation and a tightening cycle that still did not trigger a 2022 recession.
As we detail below in the recession histories, the idea of what is low or high for capacity utilization in the context of corporate sector profitability is not as direct as one might think. Breakeven volumes, cost structures and pricing power are key drivers of profits. The tariff excess as a core Trump policy only makes that unit cost analysis more complicated as we head into a new round of energy related cost pressures in 2026. Material costs, operating costs for companies, and consumer discretionary household cash flow headwinds make for a tricky set of moving parts shaped by erratic geopolitical decisions.
The AI fallout and related fears is also a new variable in the mix that cuts across both the services and goods sectors. What AI will mean for productivity improvement vs. payroll fallout will be an ongoing test of theories. Even if AI proves true to the valuation promises and brings a “revolution” of the economy, many will also pay the price. We have been getting a taste in the recent SaaS services panic. Those markets consume a lot of goods.
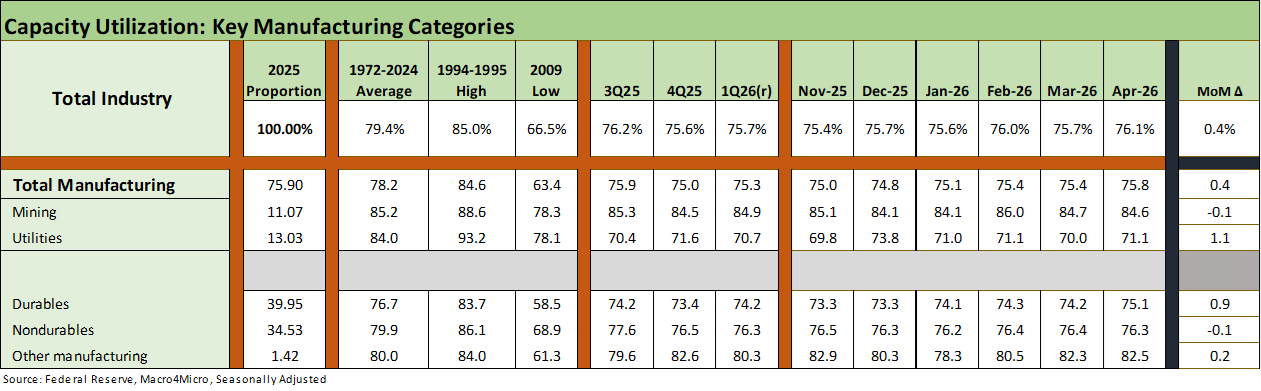
The above table breaks out the high-level groupings with total industry and total manufacturing posting favorable variances in April 2026. We include a “delta column” on the right. Mining and Utilities were mixed for the month, but a rational expectation is that utilities will see more capacity added and more demand.
We see Durables and Nondurables as the main events to track, and durables showed notable strength this month. The durables sector is especially important with all of the supplier-to-OEM multiplier effects. That also is the sector more meaningfully tagged by the Trump tariff policies. The IEEPA setbacks and recent attempts by Trump to counterattack by creatively using existing tariff legislation is struggling in the courts also as Trump goes to “Plan B” in his attempts to cut Congress out of the tariff decisions.
Looking back from 2025 into early 2026, we see Manufacturing in a relatively narrow range and the same for Durables. Tariffs have not moved the production needle much at all so far, but that does not tell the profitability story on the tariff cost impact. Most people (outside the White House) know that buyers/importers write the check for the tariff, so that implies a higher breakeven volume or some offsetting action on other costs or pricing. Those impacts will only play out over time across working capital cycles. Pricing decisions were more likely to come at a lag given the White House pressures, so there is a lot more to play out in 2026 earnings seasons and company color.
The inflation story has turned negative for the macro picture at this point (see Producer Price Index April 2026: Heat Rising on Cost Inputs 5-13-26, CPI April 2026: 4.1% All Items Less Shelter, 30Y UST 5% 5-12-26). The “good news, bad news” aspect of a resilient industrial sector is that higher input costs can lead to the exercise of pricing power that flows into inflation. That beats the stagflation alternative but will keep life challenging for the FOMC and “Team Warsh” (if he can assemble a supportive voting team).
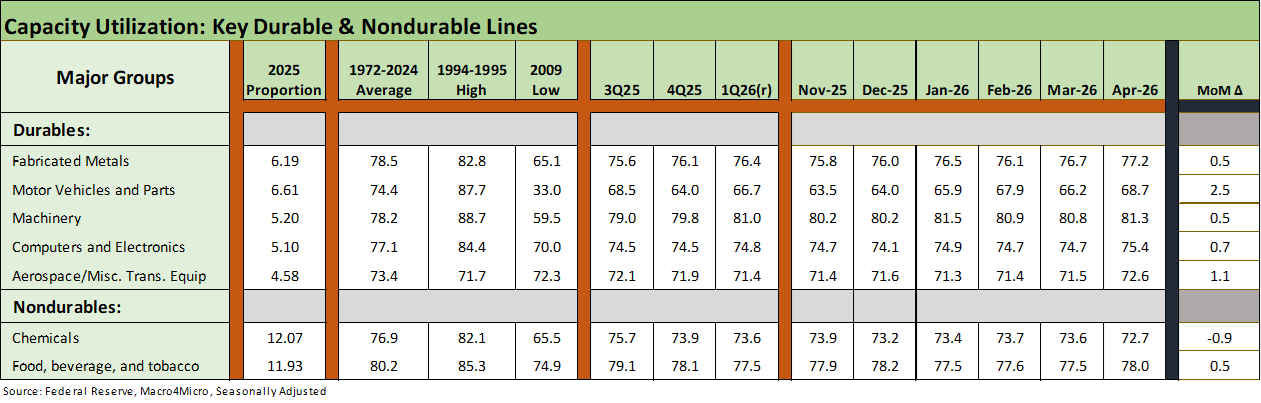
The above table breaks out the details for the top 5 Durables lines and the two largest Nondurables lines. We include the capacity utilization deltas in the column on the right. We see positive moves across these major durables industries with Motor Vehicles and Parts and Aerospace making notable moves. The two major Nondurable lines were mixed with Chemicals lower and Food & Beverage higher.
The consumer story and the corporate sector capex optimism will be important to watch in coming weeks and months as guidance gets updated and the Iran fallout starts to flow into strategies from global players to small and midsized enterprises. The PPI numbers released this past week were daunting.
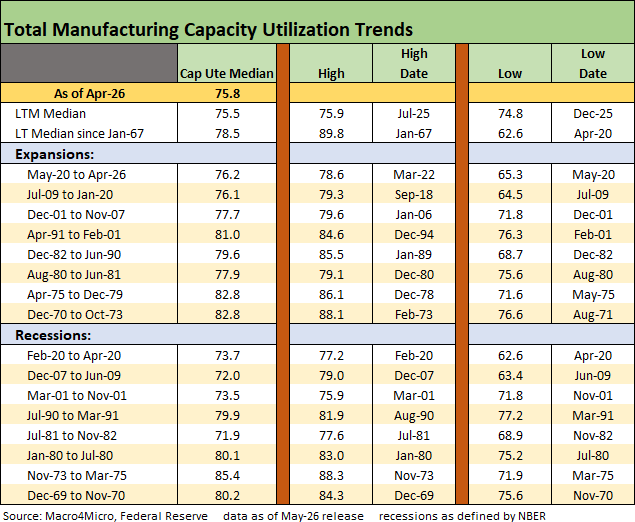
The above table updates the capacity utilization history for expansions and recessions. As we routinely discuss, the ability of companies to generate solid profits at lower capacity utilization in today’s markets relative to past cycles is tied to both automation and the evolution of low-cost global supplier chains.
Low-cost supplier chains are getting undermined by tariffs and are now facing supply chain headwinds from the Iran War energy effects and the supply-demand imbalances. The demands to improve efficiency as tariff mitigation measures need to be monitored. We are also seeing important low-cost suppliers in the Gulf outside of oil and gas roiling some industries (e.g. aluminum).
The “AI story” and what it all means for productivity and headcount will be a big part of that theme. The natural outcome will be less jobs in a service intensive economy such as the US. The irony is that most immediate impacts on jobs has been in tech, but that can easily spread.
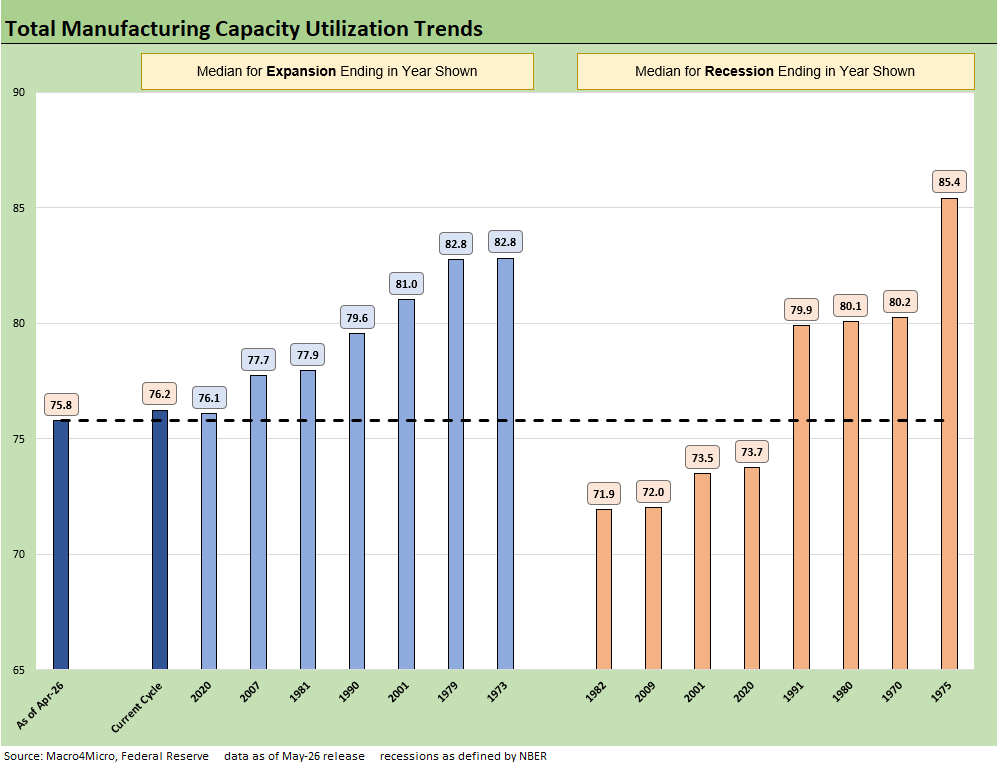
The above chart details economic expansion and recession averages and lines them up by height as a frame of reference. We see the current level on the left at 75.8%. The fact that the current capacity utilization is below numerous recession averages posted on the right side of the chart also scoffs at the recurring “Golden Age” and “hottest country” rhetoric.
In the context of the tariff priorities and reshoring ambitions, the slack capacity implied by the chart underscores that the analysis is a lot more complicated than just “build more plants” and “keep tariffs high” to force reshoring. That is a story told on an industry-by-industry basis.
The multiplier effects are important, but the relocation of supplier chains and OEM relocation is by definition very slow to unfold given intrinsic lag times, tooling equipment and contracts in place. Manufacturing jobs were lower this month – not higher – on a MoM basis and even worse YoY (see Employment Situation: April 2026 5-8-26).
There is also the fact that the cost of relocation has also risen with all the tariff effects for materials, components, and qualified labor. Autos are the main relocation stories, but that is generally going to be tied to existing infrastructure and not a strategy of all-new greenfield plants. In the end, many companies can just wait for Trump to “move on.”
See also:
Existing Home Sales April 2026: Steady or Clinging? 5-14-26
Producer Price Index April 2026: Heat Rising on Cost Inputs 5-13-26
CPI April 2026: 4.1% All Items Less Shelter, 30Y UST 5% 5-12-26
Market Commentary: Asset Returns 5-10-26
Employment Situation: April 2026 5-8-26
New Home Sales March 2026: Favorable Volume, Weaker Prices 5-5-26
JOLTS March 2026: Openings Down, Hires Up, Layoffs/Discharges Up 5-5-26
PCE Inflation, Income & Outlays March 2026: Inflation Anxiety Level? 5-3-26
1Q26 GDP Advance Estimate: Consumer Fade, Investment Boom 4-30-26
Synchrony Financial: Favorable Consumer Credit Signals 4-24-26
Industrial Production March 2026: Mixed Picture, Big Questions Ahead 4-16-26
Existing Home Sales March 2026: New Beginnings or New Ends? 4-15-26
Producer Price Index March 2026: Heater or Curve Ball? 4-14-26
4Q25 GDP: More Adverse Revisions in the Golden Year 4-9-26
The US as an Aspiring Emerging Market: Fiscal SNAFU, Political FUBAR 4-6-26
UST Deltas: Elevation Realities 3-29-26
Market Lookback: Confusion Reigns, Dislocation Pours 3-22-26
Market Lookback: The Gulf of Cause and Effect 3-15-26