
Existing Home Sales April 2026: Steady or Clinging?
April existing home sales were unexciting with volume sideways, inventory rising, and median prices up YoY to $417.7K.


The mortgage rate backdrop with 30Y rates closer to 6.6% than 6.5% at last night’s close brings a combination of monthly payment pressures and an uncertain economic outlook for many households.
The low 4 million rates on existing home sales are going sideways in 2026 with April’s 4.02 million staying within a tight band reflecting stretched affordability for those at the margins. Mortgage eligibility is a hurdle for many with median existing home prices continuing to rise.
In theory, new homes and homebuilders with a wide range of incentives and financing tools have the edge, but new homes are a much smaller share of the housing market than existing units.
The CPI and PPI news this past week is not bringing good omens for mortgages with an oil price spike still tied to an uncertain timeline with the Strait of Hormuz shut and some very damaging lag effects ahead. The plunge in global oil inventory promises sustained supply stress. Caution around spiraling oil prices is one variable that has become gospel to the Fed after the experience of 1973-1975 and the double dip stagflation of 1980-1982 following the Iranian oil crisis of 1979.
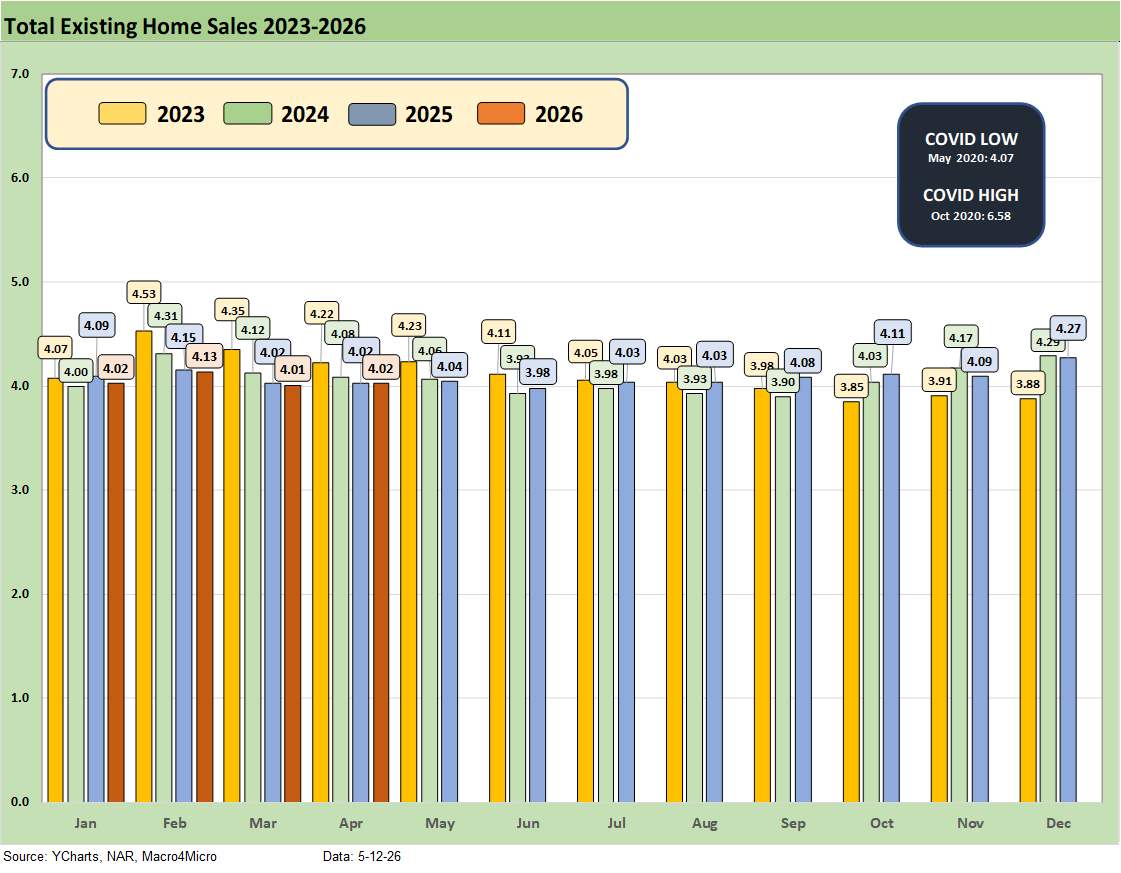
The above chart details existing home sales SAAR run rates by month from January 2023 to April 2026, which was essentially flat to March. The more-or-less sideways move in existing home sales this week was not as interesting as the CPI and PPI details (see Producer Price Index April 2026: Heat Rising on Cost Inputs 5-13-26, CPI April 2026: 4.1% All Items Less Shelter, 30Y UST 5% 5-12-26). Those two metrics spell trouble even if the markets are not reacting much and even rising in equities.
Consumers getting dented and rising input costs matter to home sales volumes and the ability of the existing home sales buyer to get a mortgage while paying higher prices. With new home prices lower across many of the builders and incentives readily available, existing homes sales face some competition (see New Home Sales March 2026: Favorable Volume, Weaker Prices 5-5-26).
The inflation metrics and Iran War fallout remain important in terms of what it means for UST and mortgage yields and consumer (and homebuyer) confidence. Trying to handicap UST levels and shapeshifting has been a challenge when we started the year with a lot of focus on easing and the new FOMC regime. Mortgage rates have been a headwind, and gauging what the FOMC might do is important even if the 10Y UST is what drives mortgage rates.
We moved the historical monthly chart to the top of the commentary as a reminder that the recent numbers look more like the late 2023 period when mortgages had peaked (see Existing Home Sales Dec 2023: Rerun of Multi-Decade Low 1-19-24). The 30Y mortgage rates have moved within a 200 bps range since the Oct 2023 peak when Freddie Mac 30Y hit 7.8% and many mortgage offerings were near 8%.
In the interest of visual quality, we delete the 2022 months when the market was posting 6 million and 5 million handle sales volumes in the first half of that year. The early read on peak selling season ahead is off to a guarded start with mid-6% handle 30Y mortgage rates remaining a headwind, and the consumer sector shaky and less confident this year than last spring as inflation and payroll anxiety remain factors in 2026.
The April 2026 existing home sales number of 4.02 million can be framed against the 3.85 million during the peak mortgage rates in Oct 2023 (see UST Deltas: Elevation Realities 3-29-26). The Freddie Mac 30Y is set on Thursdays. We got an update today with the rate barely moving to 6.36% from 6.37% last week. One year ago, the Freddie rate was 6.81%. The Mortgage News Daily Survey 30Y, which is a different mix than the Freddie survey, posted a close of 6.57%.
The above chart shows the sales volume delta by price tier for April 2026, and we see 4 of the 6 price tiers posting positive growth with only the two lowest price tiers posting declines. That was the same mix of deltas as last month. Note: We use “not seasonally adjusted data” for this chart.
The volatility and disruption of the Iran War has undermined the earlier UST rally we had seen in the mortgage markets with an uptick again in the post-Iran period. The range had been a tight one, but the recent pop above 6.5% after an earlier, brief drop below 6.0% reminds us that high oil prices are something the UST curve and the FOMC do not like. That is true of the bond market broadly.
For existing home sales, the monthly payment math is still not working well for those looking to cash out, move up, or simply relocate. Expectations for a bull flattener in the UST market that would translate into low to mid 5% mortgage rates have been thwarted so far as we cover in other commentaries. It is a very challenging leap of faith to see that probability getting better from here. That would require a macro backdrop that hits payrolls and homebuyer confidence to make the FOMC move to aggressively ease. Such a move by the Fed could also drive a UST steepener subject to the underlying reasons used by the FOMC. The oil spike and inflation pressures will make life a challenge for Warsh.
The three Fed cuts in the fall of 2025 (-75 bps) followed 3 actions (-50, -25, -25) in the fall of 2024. That in turn translated into UST curve steepening along the way. Back in the fall of 2024, the UST rally along the curve saw mortgage rates fall. At that time, the 10Y UST dropped down to around 3.6% (current 4.45%) and mortgages were around 6.0% (currently over 6.5%). That Sept 2024 rally soon gave way to a steepening and tough road for mortgages into 2025 and now 2026.
Those expecting the 10Y UST to follow fed funds lower had been relatively disappointed since the easing cycle got underway, so the latest debates on how FOMC actions will play out under Warsh do not come with a sense of automatic bull flattening and lower mortgage rates. If anything, FedWatch odds favor hikes over easing for the forward 1-year. The highest probabilities favor no change (see Producer Price Index April 2026: Heat Rising on Cost Inputs 5-13-26).
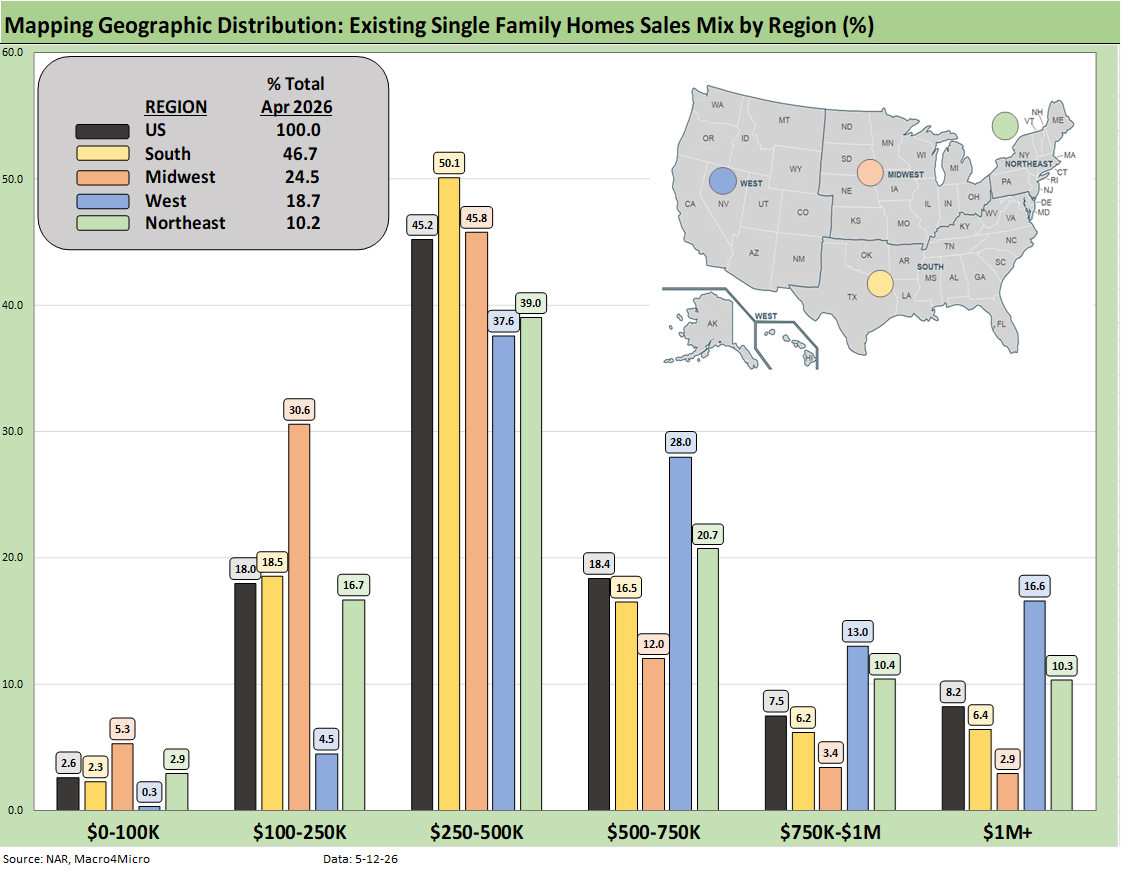
The above chart shows the geographic mix of volumes and details on price mix by region. The South is the main event in single family volumes whether new or existing at almost 47%.
For the bar chart, we break out the mix for each region by price tier. For example, the South shows almost 50% of its existing home sales volume in the $250K to $500K range and over 18% of its sales in the $100K to $250K bucket.
The high cost of homes in the West (notably California) is clear enough just by glancing at the bar chart with over 16% at prices over $1 million. The second highest in the $1 million club is the Northeast at over 10%.
We see a major concentration across the regions in the $250K to $500K although the $100K to $250K bracket for the Midwest stands at over 30%. The West shows a high share of 28% in the $500 to $750K bracket, which again underscores how expensive the West region price tags remain in national context.
The map explains what states are in each Census region. There is a very wide range of home price profiles in the West and Midwest states.
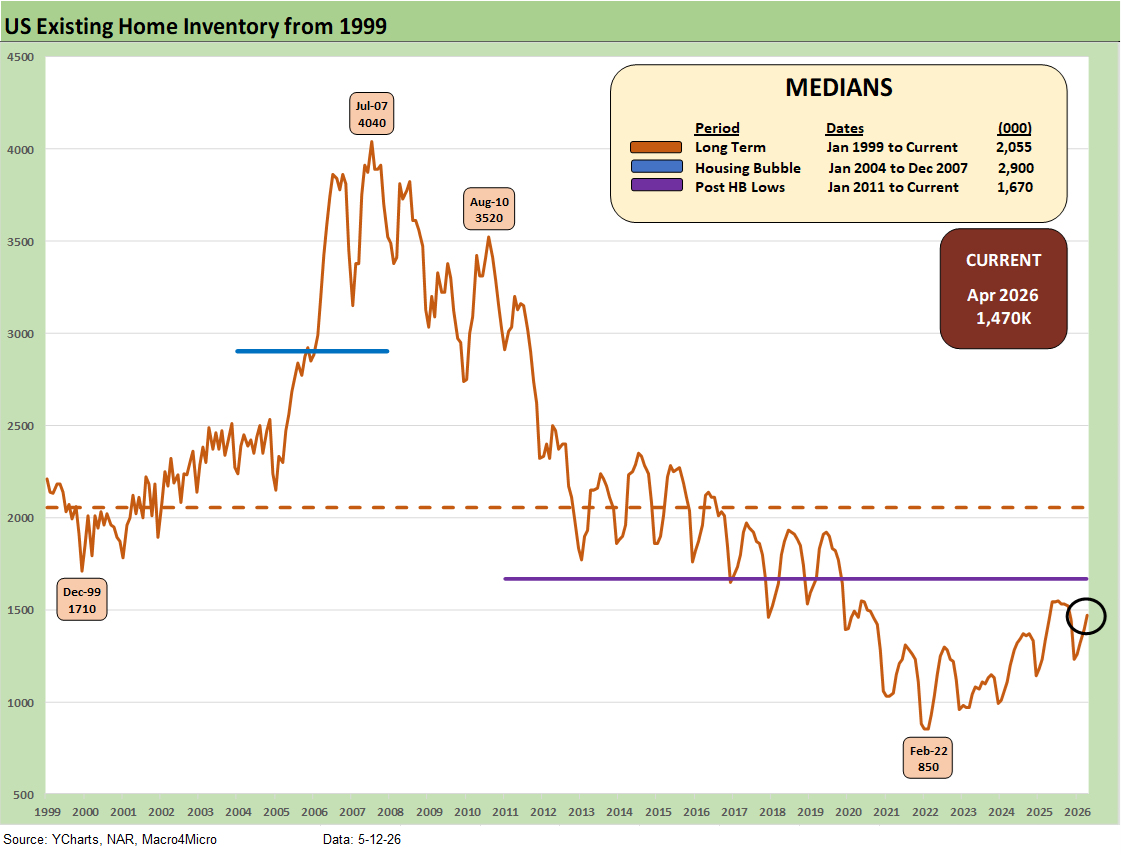
Inventory for total existing homes ticked higher MoM (as revised) to 1.47million units for +5.8% MoM and +1.4% higher YoY. Current inventory is well below longer term medians including 2.06 million for the post-1998 median. The median from Jan 2011 (homebuilding low) to current times is 1.67 million. In other words, existing home sales inventory remains low even if the level is materially higher than the stunning low of 850K of Feb 2022 ahead of the end of ZIRP and start of the tightening cycle in March 2022.
The existing home inventory balance had shown a steady rise off the sub-1 million lows of 2022. Inventory had risen to the 1.3 million handle range in 2024 before dipping back down to a recent low of 1.14 million to close out 2024. We bounced off those numbers in 2025 to get back above 1.5 million handles before the recent move lower to 1.2 and 1.3 million handles and then back to current levels.
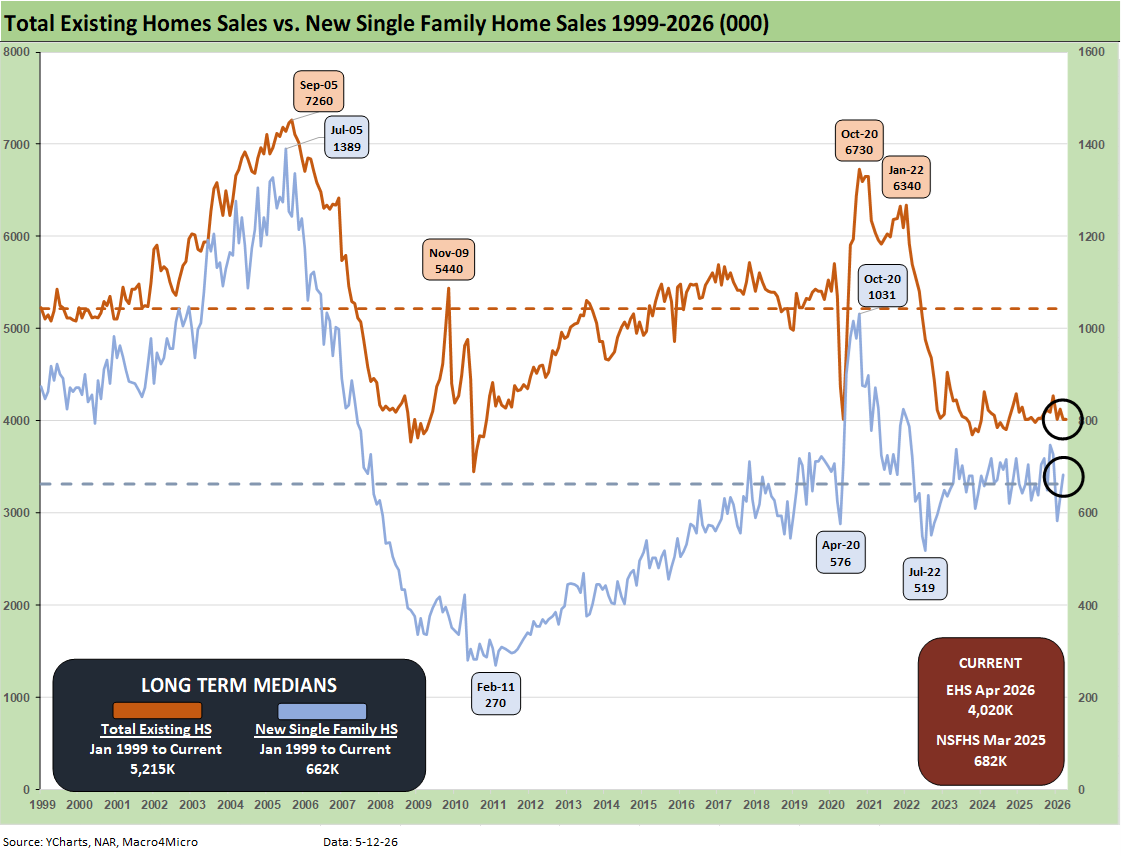
The above two-sided chart updates the trend line in total existing home sales vs. new single family homes. After some material disruptions in the data updates during the shutdown, the new home sales data is current again (see New Home Sales March 2026: Favorable Volume, Weaker Prices 5-5-26).
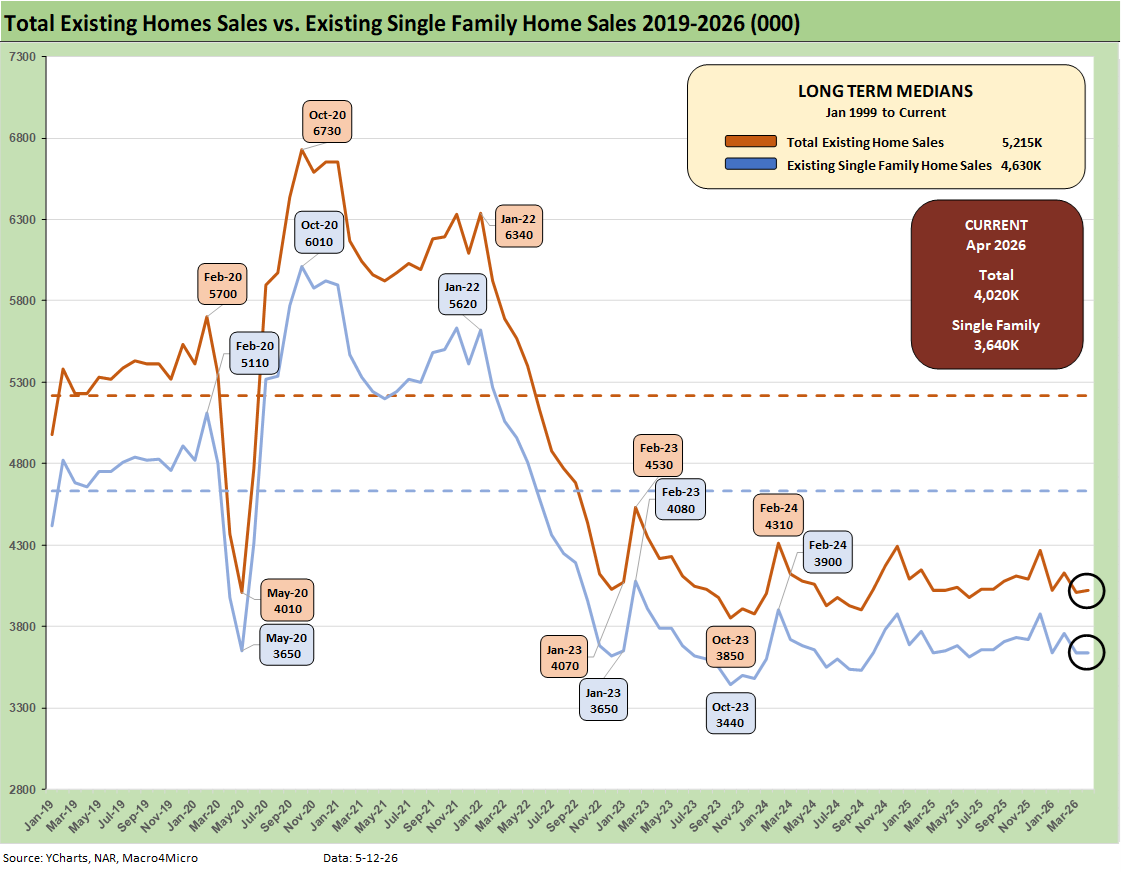
The above chart breaks out the timeline for existing single family alone of 3.64 million vs. total existing home sales of 4.02 million. The 4.02 million total is well below the long-term median (from Jan 1999) of 5.22 million. The total of 3.64 million for single family is well below the long-term median of 4.63 million.
Existing single family growth was 0% sequentially and -0.3% YoY (SAAR). The lower line is ex-condo/ex-coops. We saw 380K in condo and coop sales in April 2026, up from 370K YoY and up from 370K MoM.
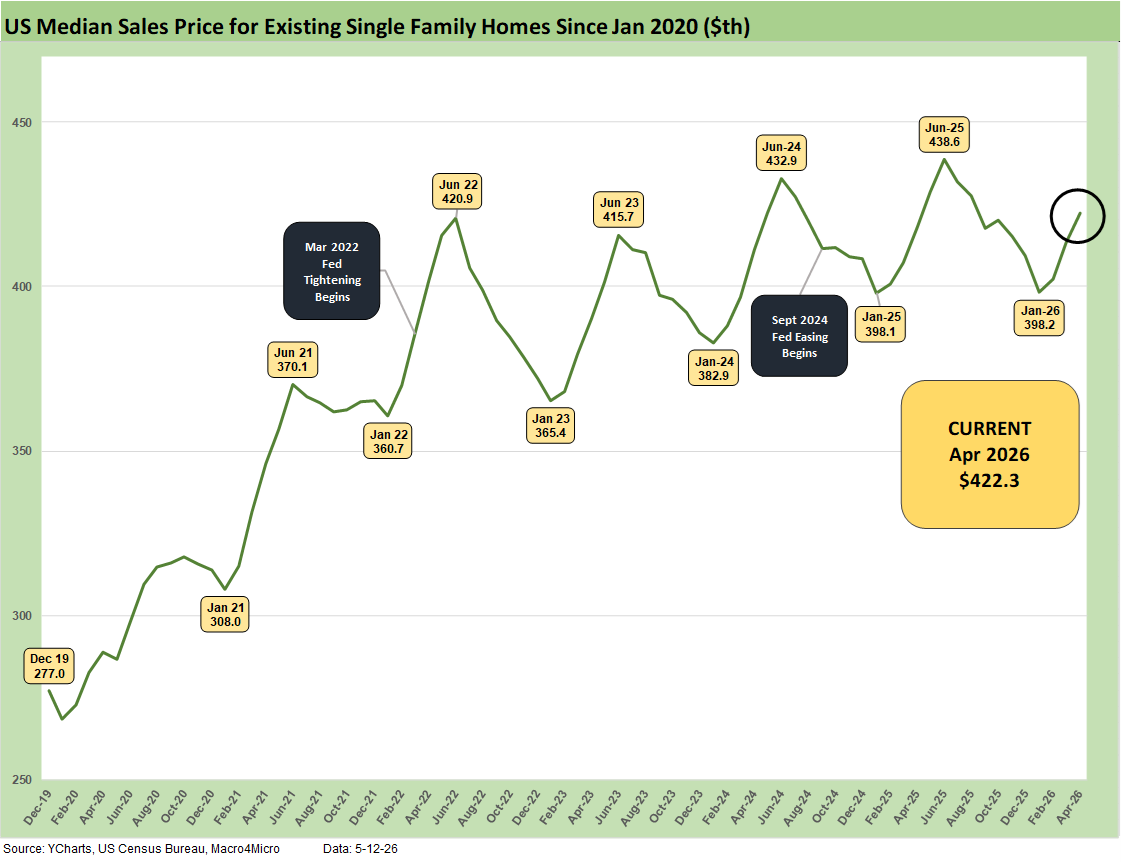
The above chart updates the median price for existing single-family homes at $422.3K (vs. $417.7K total) after June 2025 hit a record $438.6K. The median price in April 2026 is dramatically above the $308K level back in Jan 2021 and $277K in Dec 2019 when mortgage rates were in a different zip code and closer to 3.7% for 30Y Freddie Mac.
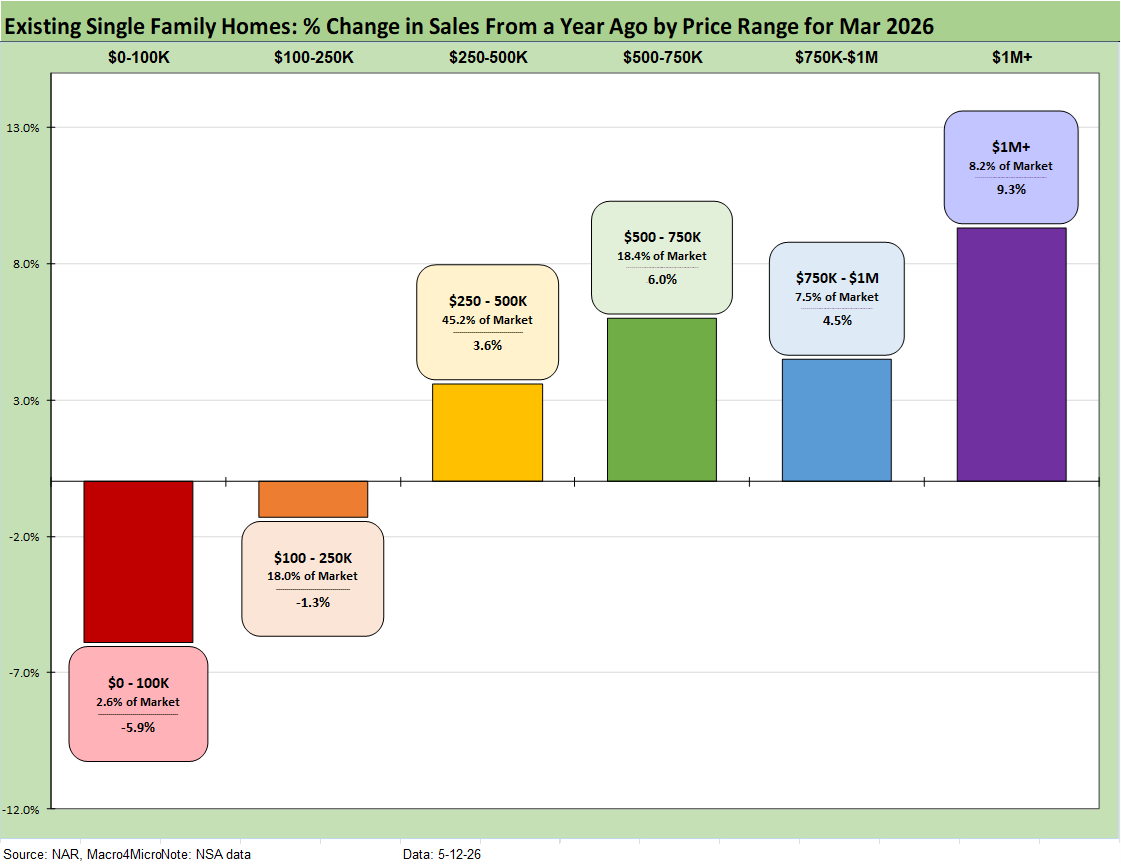
The above chart shows another angle on the sales mix across the price tiers. We just lift the numbers off the monthly handout for single family homes released by the NAR each month. Higher price homes and wealthier buyers have had a better time.
The $250K to $750K range is comprised of two tiers that add up to almost 2/3 of the market with the $100K to $250K showing a big share in some of the Midwest states as detailed in an earlier chart. We also looked at the growth trends for each tier earlier. Lower price tiers declined while the top 4 tiers rose. The lower price tiers are more on the cusp of where affordability and mortgage eligibility could be strained at 6% handle mortgage rates.
See also:
Producer Price Index April 2026: Heat Rising on Cost Inputs 5-13-26
CPI April 2026: 4.1% All Items Less Shelter, 30Y UST 5% 5-12-26
Market Commentary: Asset Returns 5-10-26
Employment Situation: April 2026 5-8-26
New Home Sales March 2026: Favorable Volume, Weaker Prices 5-5-26
JOLTS March 2026: Openings Down, Hires Up, Layoffs/Discharges Up 5-5-26
PCE Inflation, Income & Outlays March 2026: Inflation Anxiety Level? 5-3-26
1Q26 GDP Advance Estimate: Consumer Fade, Investment Boom 4-30-26
Synchrony Financial: Favorable Consumer Credit Signals 4-24-26
Industrial Production March 2026: Mixed Picture, Big Questions Ahead 4-16-26
Existing Home Sales March 2026: New Beginnings or New Ends? 4-15-26
Producer Price Index March 2026: Heater or Curve Ball? 4-14-26
4Q25 GDP: More Adverse Revisions in the Golden Year 4-9-26
The US as an Aspiring Emerging Market: Fiscal SNAFU, Political FUBAR 4-6-26
UST Deltas: Elevation Realities 3-29-26
Market Lookback: Confusion Reigns, Dislocation Pours 3-22-26
Market Lookback: The Gulf of Cause and Effect 3-15-26