
Market Commentary: Asset Returns 5-18-26
Inflation setbacks and a rising UST curve hit duration while equity markets wrestle with pricing potential Iran fallout.


The clock is ticking…
Time has a value that is hard to measure with the current set of risks, but the Iran War keeps costing more the longer it lasts across the markets, consumers, and many industries in the US. We see even worse pain in Europe and Asia with Africa also facing threats from the fertilizer crisis.
The only real way to meet the list of US demands on Iran is to put troops on the ground. That is not a solution Trump appears willing to take. The only way to meet the Iranian demands of the US is…not possible.
The week overall was a brutal one for the UST curve as ugly PPI and CPI metrics raise worries about what comes next. The avoidance-of-disaster policy seems to be “let the Strait of Hormuz sit as it is.” The UST curve is starting off this week in mild fashion with a slight decline as we go to print.
The lack of a realistic solution in Iran is caught up in the clash of Homeric egos on the US side (Trump, Hegseth) and the religious fanaticism on the Iranian side. That makes it hard to solve for X.
This week brings NVIDIA earnings and we will also see the start of the retailer earnings season, which in turn should provide some useful consumer color (Walmart, TJX, Home Depot, Lowe’s, BJ’s, Ross Stores, etc.).
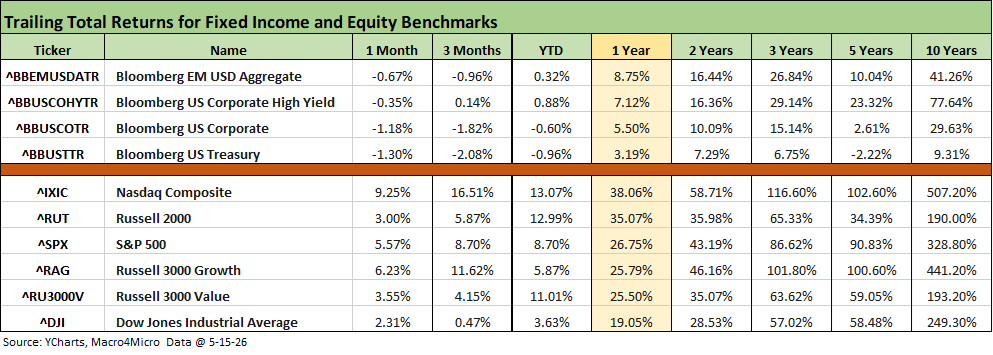
The above chart updates the high-level index benchmarks we track for debt and equities. The bond returns are getting damaged by inflation and the UST action. Equities slowed down this past week as we cover below, but it is hard to put a meaningful dent in growth stocks and tech overall even if some sectors are taking a beating along the way (notably software).
The YTD return metrics remain very strong for broad market benchmarks with NASDAQ, Russell 2000, and Growth indexes still impressive for the trailing 1-year as well. Those 1-year returns are a multiple of the long-term returns on the equity asset class. Meanwhile, the rolling 3-month and YTD returns for the large caps are solid for the S&P 500 and very impressive for NASDAQ and Growth.
The small caps have been a favorable performance story in this cycle, but those will face headwinds if the oil fiasco is sustained and keeps pressure on small business costs (energy, tariffs) and any consumer weakness that might surface in discretionary spending with the nondiscretionary expenses rising.
The text below is partly a cut-and-paste of a LinkedIn post from the weekend with some edits:
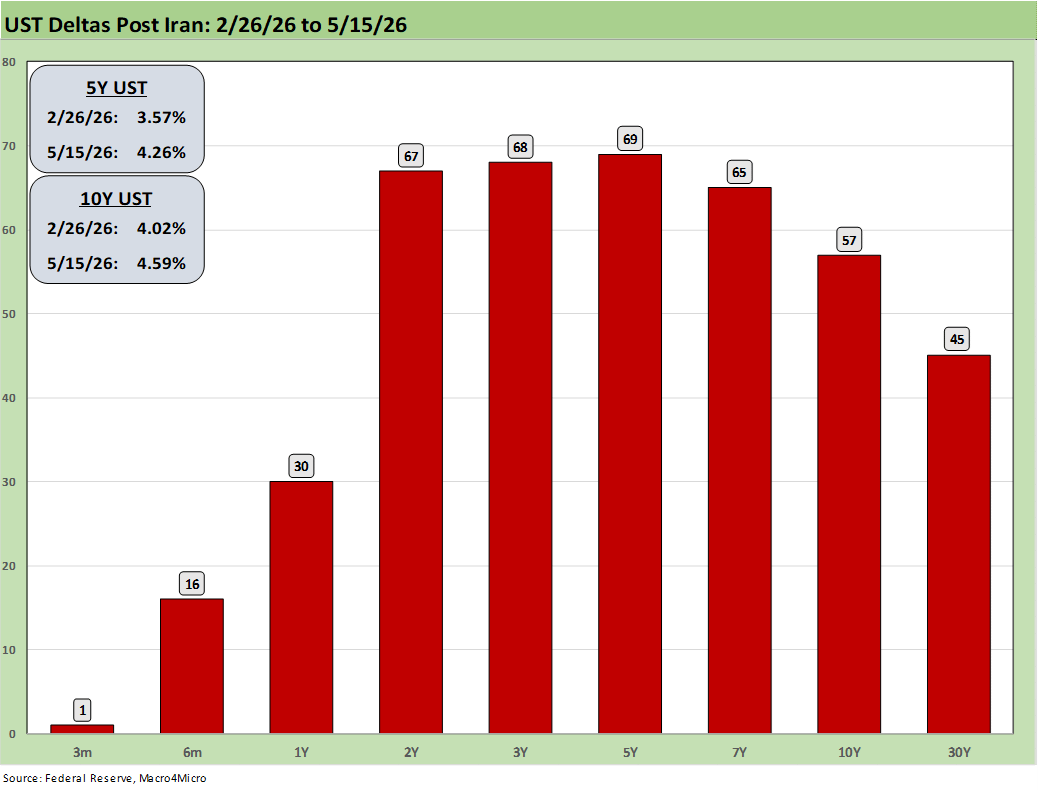
This chart speaks for itself after a rough stretch for the UST since Trump launched the Iran War. We wrap a bad week and a very bad Friday for the yield curve and duration. We measure the UST deltas from a start date of 2/26 just ahead of the 2/28 Iran bombing
The +67 bps on the 2Y, +69 bps on the 5Y, and the +57 bps on the 10Y make a statement. Friday saw double-digit moves in the 5Y, 10Y, and 30Y with the 5Y taking a bigger hit at almost +15 bps. The 30Y UST at +45 bps in the chart drove a move to 5.12% at Friday close (5.13% today). The Mortgage News Daily 30Y survey hit 6.65% on Friday to move toward 8-month highs.
The 2Y UST moved almost +9 bps higher Friday, and that signals how the market is seeing the odds of Fed easing. As of Monday midday, the FedWatch “Vegas line” shows odds of 0% for a single cut by the Dec 2026 FOMC meeting, 50.9% odds of unchanged, a 38.2% chance of 1 hike and almost 9.8% chance of 2 hikes. The odds of 3 hikes are at 1.1% but still higher than 1 cut.
These odds will be jumping around in coming days, and Warsh will be walking into an interesting backdrop. His “trimmed mean” data plan might need an Etch A Sketch to shake. As we detail below, we see all negative bond ETF returns for the week with 1-month returns for the 7 bond ETFs also all negative and the long duration UST ETF (TLT) in the bottom quartile.
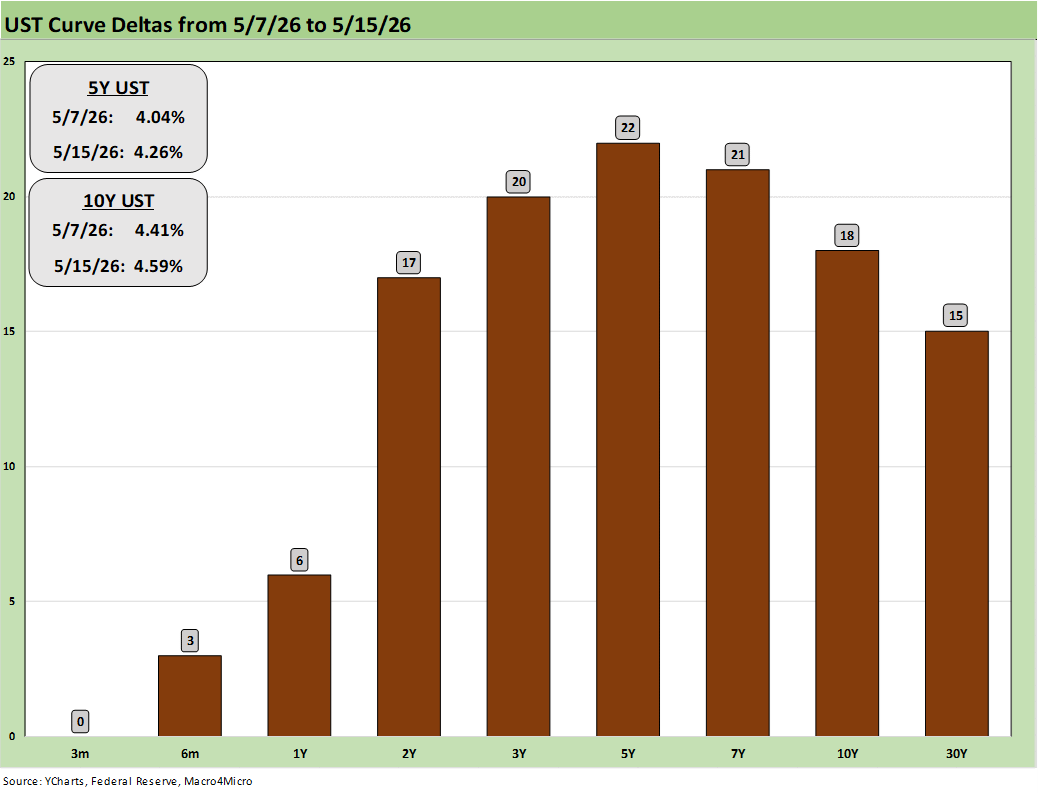
The above chart frames the UST delta for last week for a view on how much of this past week’s blowup flowed into the post-Iran UST curve deltas. The +22 bps on the 5Y UST vs. the +59 bps post-Iran offers a stark reminder that more oil price pressure and less hope of inflation getting under wraps could move the curve meaningfully from here.
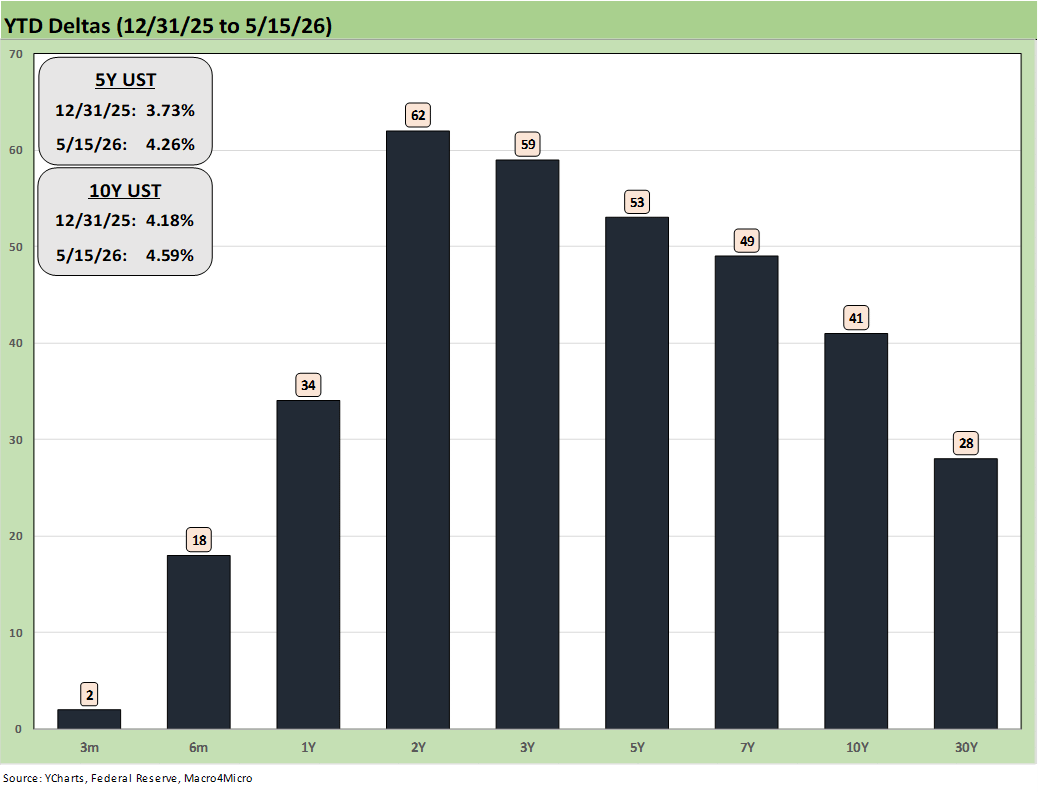
The above chart offers one more angle on how the UST was behaving ahead of the post-Iran spike with the 5Y at +53 bps YTD vs. the +69 bps since just before the start of the US-Israel military action against Iran. The 10Y was +57 bps since Iran vs. +41 bps above and the 30Y UST was +45 bps vs. +28 bps above, so the damage to the UST curve has been about Iran.
The Magnificent 7 heavy ETFs…
Some of the benchmarks and industry ETFs we include have issuer concentration elements that leave them wagged by a few names. When looking across some of the bellwether industry and subsector ETFs in the rankings, it is good to keep in mind which narrow ETFs (vs. broad market benchmarks) get wagged more by the “Magnificent 7” including Consumer Discretionary (XLY) with Amazon and Tesla, Tech (XLK) with Microsoft, Apple, and NVIDIA, and Communications Services (XLC) with Alphabet and Meta.
The “Mag 7+3” can be considered a key part of the tech drivers when Broadcom (AVGO), Oracle (ORCL) and Taiwan Semiconductor (TSM) are added to the mix. Those market cap rankings have been moving around across the months, and the growth in names such as Micron ($817 bn market cap) may require some new grouping and tag lines as 2026 proceeds. Oracle is more a software and systems company that has been volatile and has fallen off the pace (ORCL is a holding in the Software ETF, IGV). Taiwan Semi has been consistent, and Broadcom also is comfortably in “the trillion plus club” at this point.
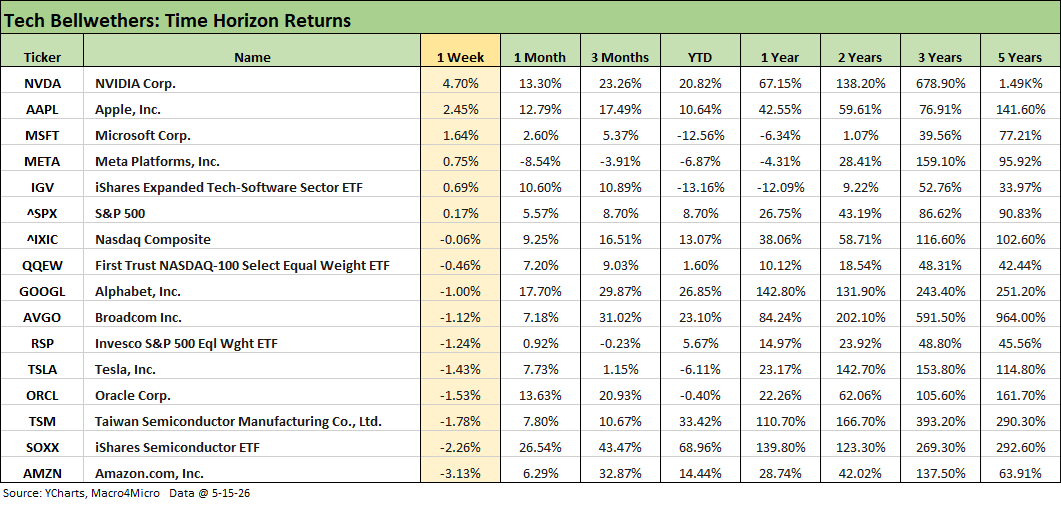
We look at a mix of tech bellwethers and benchmarks above and a broader array of tech benchmarks, ETFs, and single names further below.
This week shows 4 of 7 Mag 7 names in positive range ahead of the S&P 500 with 3 in the red and below the broader market. Amazon sits in last place on the week after being a strong relative performer over the past 3 months and no running timelines in the negative range in the chart except the current week.
Tesla continues to struggle on and off with a negative week and negative YTD performance. Alphabet had an off week in contrast to a very strong run across other timelines.
Oracle remains one of the more erratic names of the Mag 7+3 and is negative YTD. Taiwan Semi was in the red for the week after a very steady and stable run and the same for Broadcom.
The Semiconductor ETF (SOXX) had a bad week, but that was only after a dazzling run of just under 69% YTD. NVIDIA reports this week and led the list this week.
The comments below are essentially a cut and paste from a LinkedIn note we posted over the weekend with some additional edits:
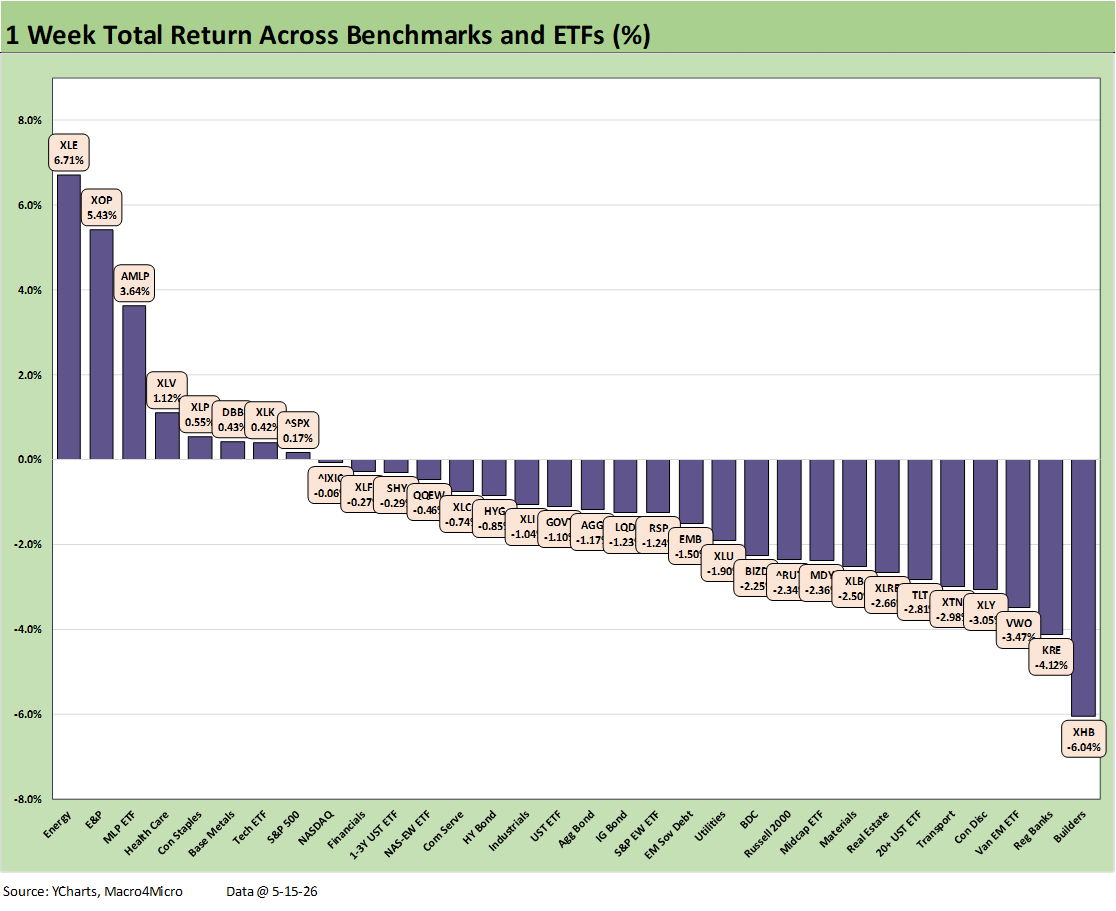
The chart above updates the weekly returns for the 32 market benchmarks and ETFs we monitor. This week posted a very different profile of returns at 8 positive and 24 negative. The top quartile only required minimal positive returns to qualify for the top tier. We see the top 3 of the high quartile from the energy sector with the Energy ETF (XLE), E&P (XOP), and Midstream (AMLP).
Only the S&P 500 among broad benchmarks registered in positive range despite only 4 of 11 broad S&P sectors positive (including Energy at +6.8%). As noted in the chart, the Tech ETF (XLK) was barely positive and just ahead of the S&P 500 at less than 1%. NASDAQ was slightly negative with Russell 2000 small caps near the bottom of the 3rd quartile with Midcaps in negative range.
The bond ETFs were all in the red, and we see interest rate sensitive sectors hit hard with Homebuilders (XHB) in last place joined in the bottom quartile by Regional Banks (KRE), Real Estate (XLRE), and the long duration UST ETF (TLT).
In an eventful week for geopolitical speculation (e.g. the fate of Taiwan as the US “passport to AI paradise”) and the official end of the Powell role as Fed Chair, the reality of inflation (CPI, PPI) and material upward pressure on the UST curve and mortgage rates led the risk factor parade. The interest expense bill for the growing deficit just keeps rising and FOMC odds now favor hikes over cuts.
The adverse yield curve shift was running alongside higher oil prices, and the continuation of the painful impasse in the Strait of Hormuz is still very much a fact of economic life. WTI closed Friday at over $105, up from a $95 handle to end the prior Friday. The game clock without end is intrinsically bad, and the statements by Trump did not help ease tension on the availability of any offramps.
The China trip and accompanying commentary offered little comfort of any breakthroughs in the Iran game plans with some side comments implying continued inaction and willingness to just let it ride in status quo for a while. The recurring threats of more bombing loses credibility as a solution in the markets given the potential for Iran to retaliate with the Houthis in the wings. Such sentiments can shift with the calendar (or a stopwatch).
Time is not on the side of Iran, and near-term imbalances worsening.
The comments below are essentially a cut and paste from a LinkedIn note we posted on the weekend with some additional edits:
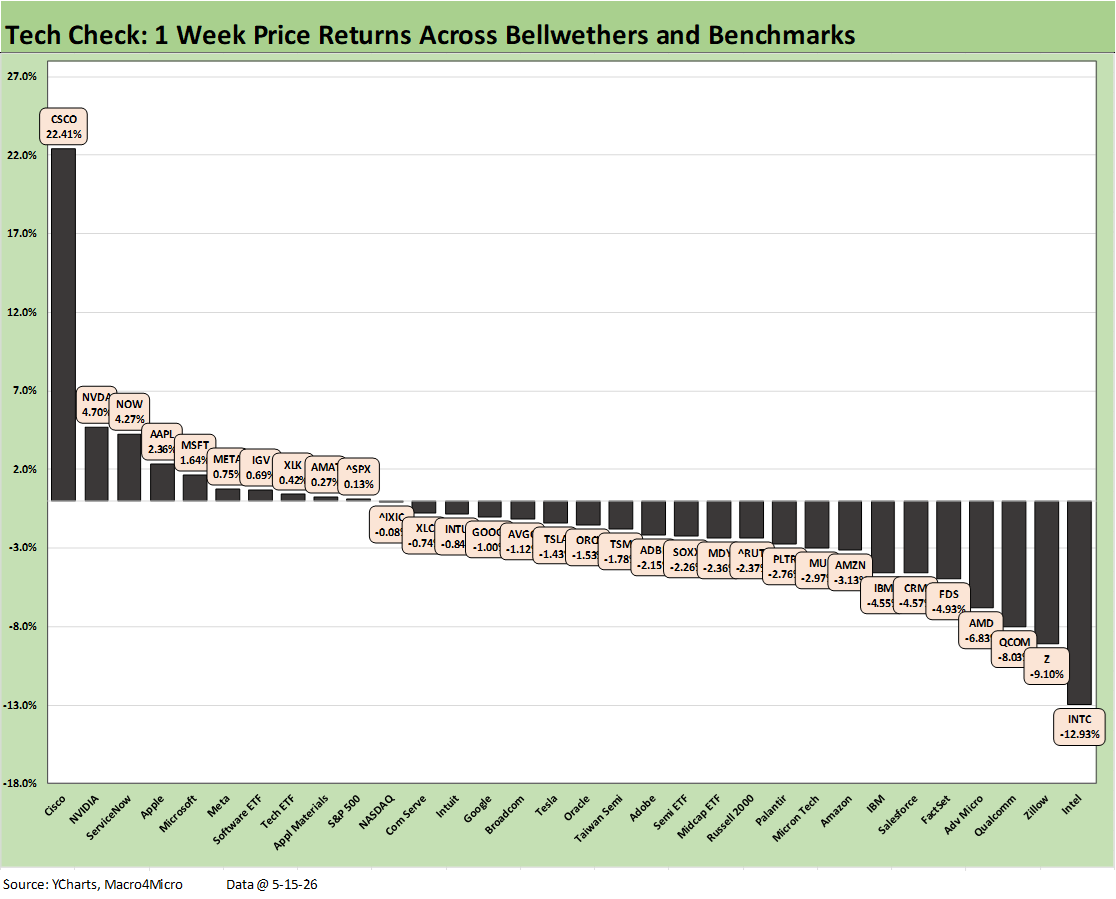
The chart details the weekly returns for the mix of 32 tech single names, ETFs, and broad benchmarks we monitor. The score of 10-22 shows a much more diverse mix in the bottom quartile than we have been seeing in recent weeks when software and SaaS-based services operations dominated the low quartile.
This week has Intel (INTC) in last place joined by Qualcomm (QCOM) and Advanced Micro (AMD) in 3 of the bottom 4 slots with Zillow (SaaS subsector) continuing to suffer. We see Micron (MU) in the red just across the line at the bottom of the 3rd quartile.
Cisco (CSCO) reported earnings this week and offered one of many reminders of the scale of the AI economic ecosystem and the capex multiplier effects across so many products and services subsectors. CSCO dramatically revised their expected order book higher for 2026 from $5 bn to $9 bn, which in turn sent analysts scrambling to revise forecasts and ponder ratings. AI end markets stimulate demand for networking equipment with CSCO as a winner.
An important asterisk to the CSCO headlines on booming earnings was the announcement this week of a restructuring that will include 4,000 jobs (<5% of the workforce) to prioritize growth areas. That offers the latest reminder that the “AI revolution” will come with a lot of headcount action to redeploy resources or offset capex needs.
Looking across the winners and losers of the week, we still see 4 of the recurring victims of “AI anxiety” in the low end of the weekly returns with Zillow (Z), FactSet (FDS), Salesforce (CRM) and IBM in the bottom quartile. On the short list of material variances this week was the Software ETF (IGV) bumping up into the lower end of the top quartile - but with only a +0.69% return.
The top tier shows a sharp drop after the +22.4% posted by #1 CSCO with NVDA a distant #2 at +4.7%. We see NASDAQ and S&P 500 in the upper end of the second quartile with the Communications Service ETF (XLC) just behind the S&P 500 and NASDAQ. The Semiconductor ETF (SOXX) faded into the 3rd quartile this week.
The Mag 7 sees 4 of the 7 in the top quartile (NVDA, AAPL, MSFT, META). 2 of the Mag 7 are in the 2nd quartile (GOOGL, TSLA) with Broadcom (AVGO) while AMZN is in the bottom quartile. Oracle (ORCL) and Taiwan Semi (TSM) were in the 3rd quartile rounding out the mix of the “Mag 7+3.”
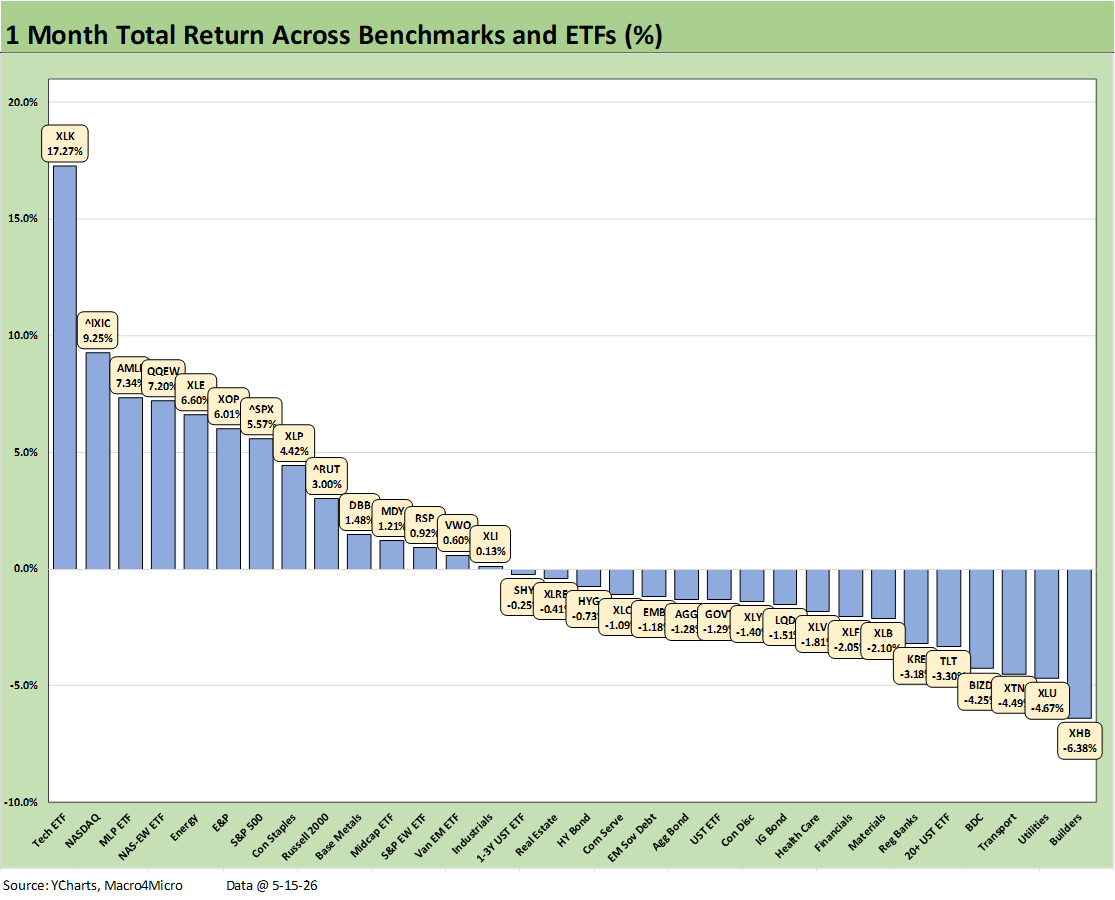
The 1month score weighed in at 14-18 with all bond ETFs in the red and the long duration UST ETF (TLT) in the bottom 5. Interest rate sensitivity was punished with Homebuilders (XHB) in last place joined in the bottom tier by Regional Banks (KRE), Financials (XLF), and Utilities (XLU).
BDCs (BIZD) remain a mixed picture with asset quality under a cloud and the chances for higher yields on floating rate assets not enough income to offset investor sentiment.
The winners on the month are framed in tech concentration while the energy names keep benefiting from Iran with Midstream (AMLP), Broad Energy (XLE) and E&P (XOP) in the top quartile. XLK was way ahead of the pack at #1 as NVDA gets ready for earnings this coming week. We see NASDAQ at #2 with the Equal Weight NASDAQ 100 ETF (QQEW) at #4. The dividend heavy Consumer Staples (XLP) made the bottom of the top tier despite the UST move.
The tech-heavy S&P 500 made the top tier with Russell 2000 and Midcaps dropping into the upper half of the 2nd tier.
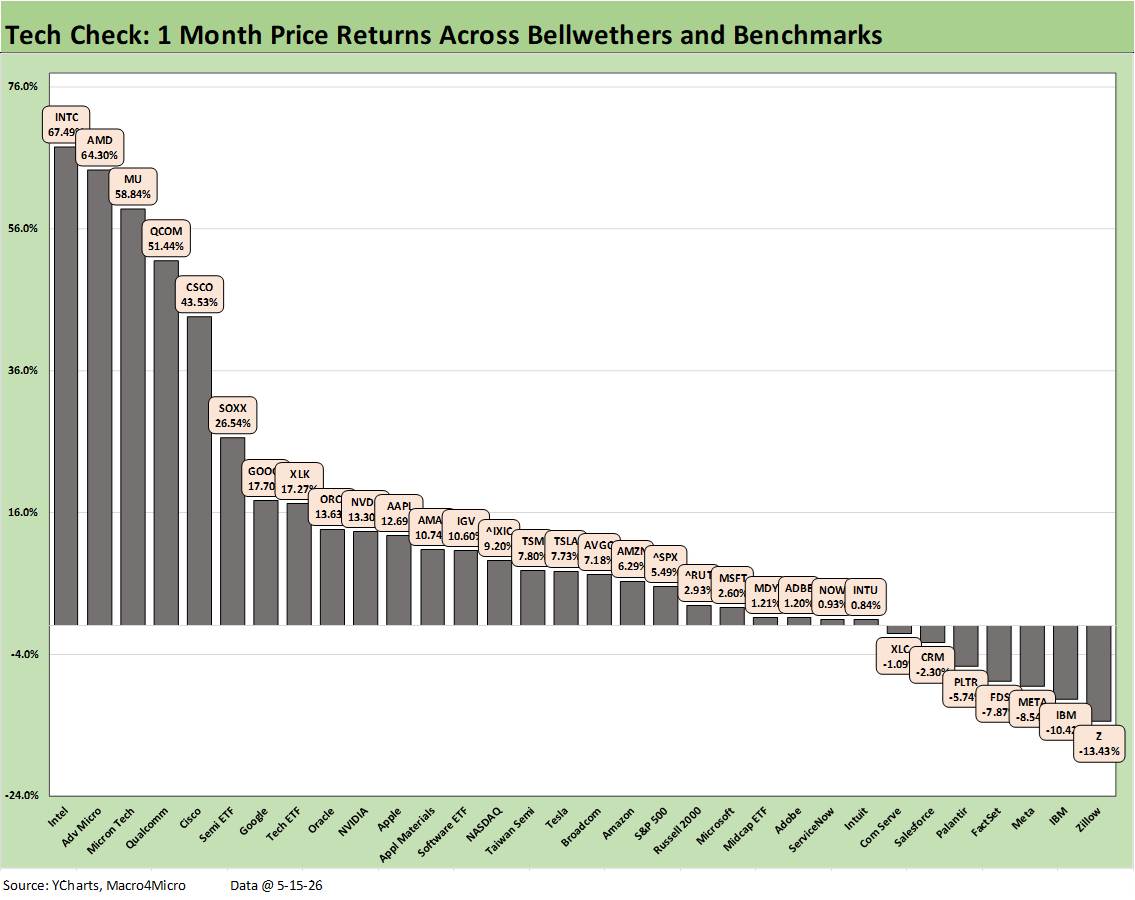
The 1-month tech check has posted some dazzling numbers as we have covered along the way. The score of 25-7 positive vs. negative does not capture the flavor of the booming performance in the top quartile where it took a 43% return to make the top 5 and took a 17% handle for 1 month to make the top tier.
Intel (INTC) posted the banner month of the group at +67.5% followed closely by Advanced Micro (AMD), Micron (MU), and Qualcomm (QCOMM) for a Murderer’s Row of semi names then followed by legacy networking leader Cisco (CSCO) which soared over 22% off this past week’s earnings as noted in the 1-week chart. The Semiconductor ETF (SOXX) posted +26.5% with the top quartile rounded out by Alphabet (GOOGL) and the Tech ETF (XLK).
The Software ETF (IGV) was mounting a comeback with a +10.6% month even though the YTD return for IGV is still running in the red at -13.2%. We see 6 of the 8 in the bottom quartile comprised of Software or SaaS-based service names again although META has struggled badly this month in the low tier and also dragged down the Communications Services ETF (XLC) in the process.
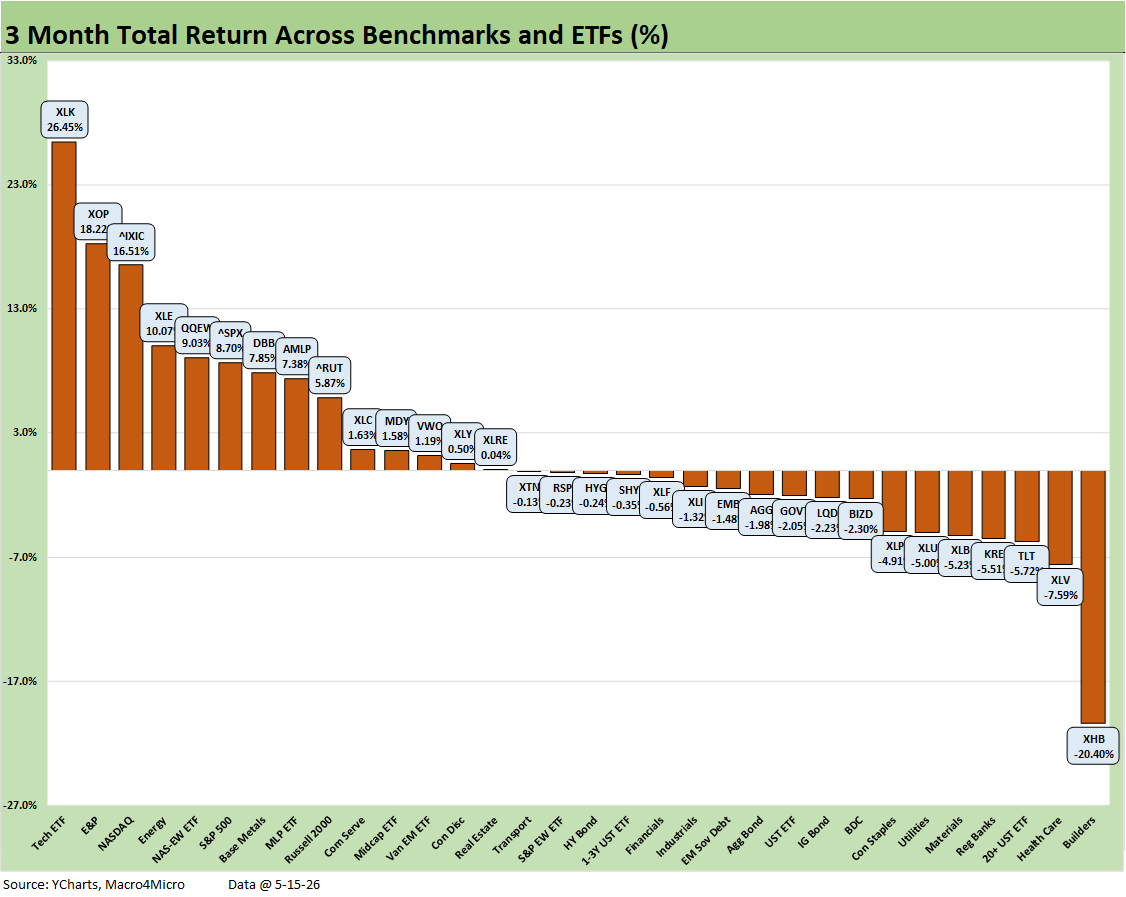
The rolling 3 months includes a heavy dose of Iran effects with a start date for the measurement period almost 2 weeks before Iran. The 14-18 score included a heavy influence of tech and energy in the top quartile. Tech (XLK) was on top with NASDAQ #3 and the Equal Weight NASDAQ 100 (QQEW) at #5. The E&P ETF (XOP) took #2 and was joined by the Energy ETF (XLE) at #4 and Midstream (AMLP) at #8. Base Metals (DBB) made the top quartile on Gulf supply disruptions.
Some good news is that the 4 broad market benchmarks include 2 in the top quartile (NASDAQ and the tech-heavy S&P 500) with small and midcaps in the upper end of the 2nd quartile (Russell 2000, Midcap S&P 400).
The low quartile saw interest rate sensitivity and cyclicality punished with Homebuilders (XHB) dead last by a material discount at -20.4%, which was not helped by a poor earnings season and guidance from builders combined with mortgage rates climbing north of 6.6% to end this week.
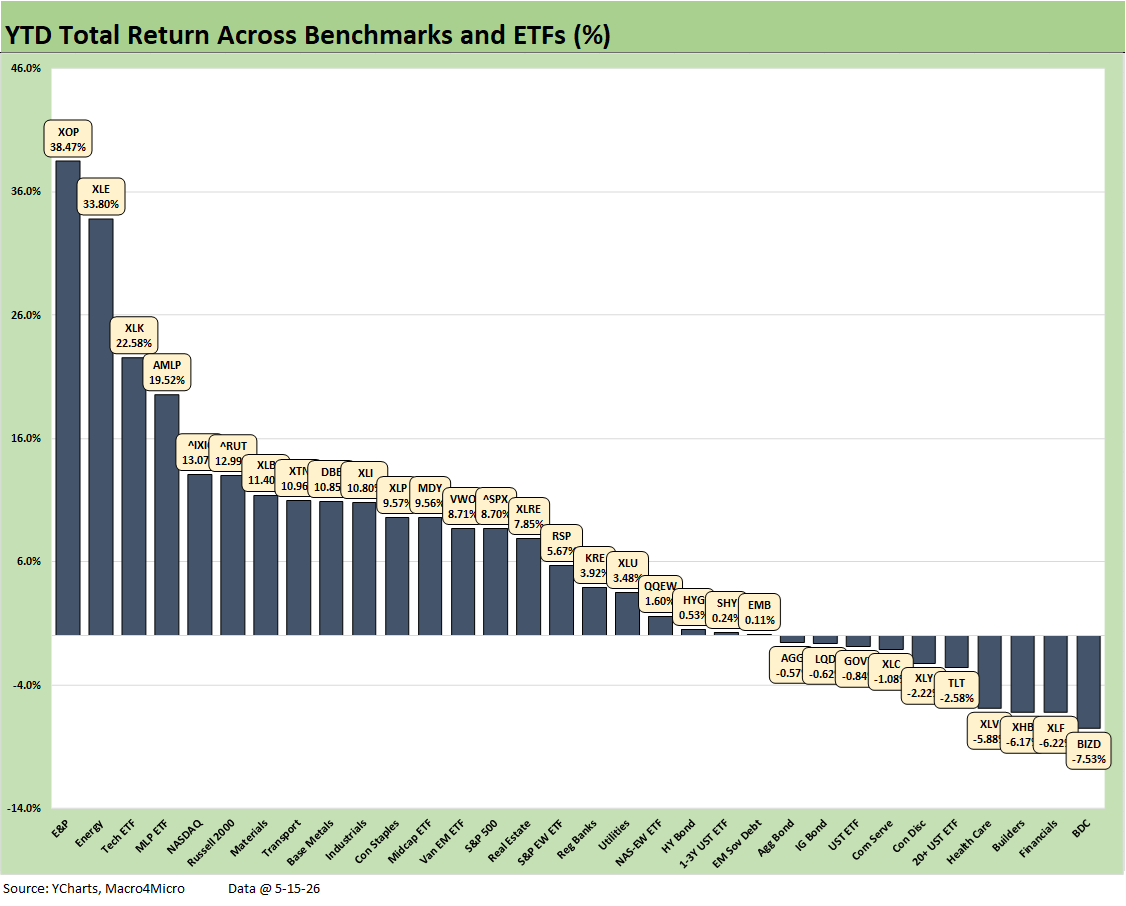
The broader mix of 32 benchmarks and ETFs show YTD returns posting a 22-10 score with 4 of 7 bond ETFs negative and the remaining 3 barely positive. Interest rate sensitivity has been a negative YTD outside bonds as well. We see Financials (XLF) second to last and Homebuilders (XHB) 3 off the bottom. The last place finish was grabbed by BDCs at -7.5%, which was at least somewhat better than the LTM return of -10.7%.
Energy ETFs took the top 2 slots and #4 position with E&P (XOP), Energy (XLE), and Midstream (AMLP). Tech ETF (XLK) took #3 and NASDAQ #5 to round out the top 5. Notable benchmark performances were seen from the Rusell 2000, which made the top quartile and beat the S&P 500. Midcaps also edged out the S&P 500 in the 2nd quartile.
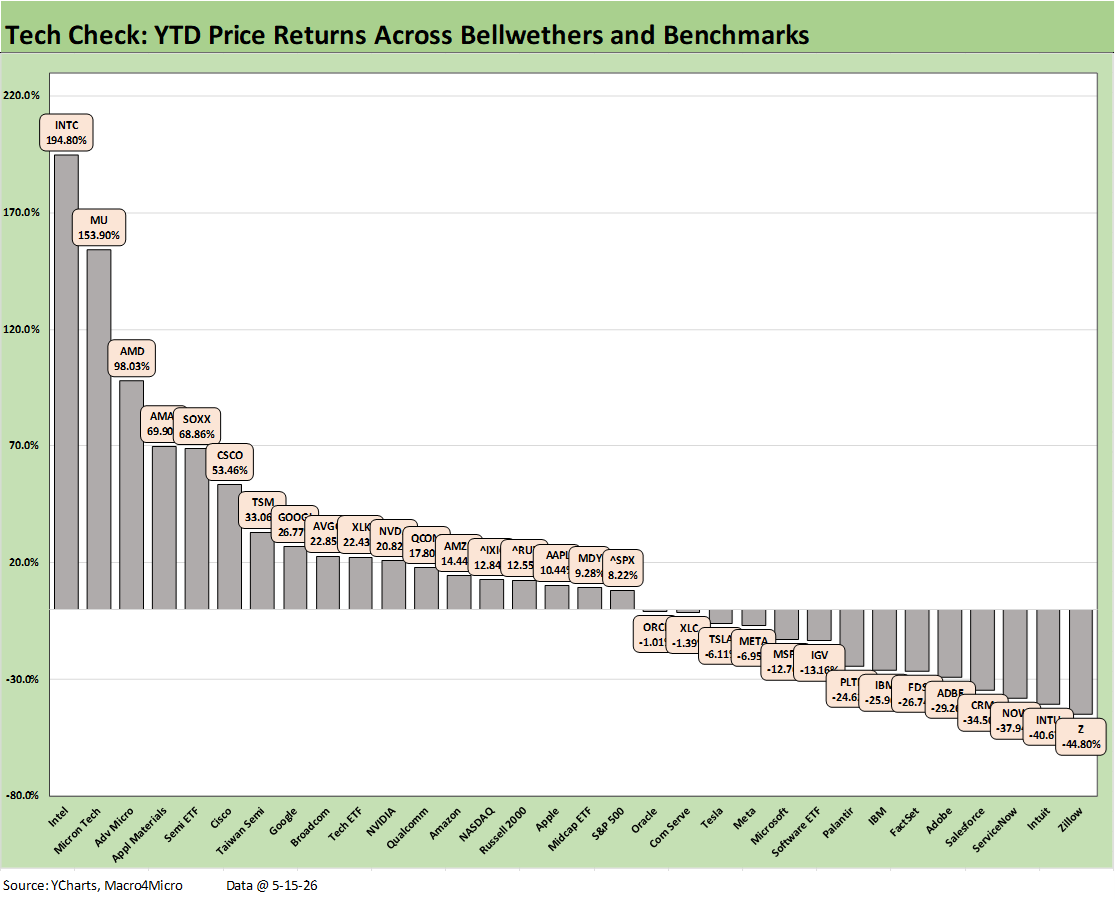
With a score of 18-14, the “Tech Check” mix YTD underscored the strength of semiconductors and other AI infrastructure plays (CSCO) while seeing software and SaaS-based services operators take a beating in negative range. The entire bottom quartile is software, SaaS services, or any company seen as threatened by AI. Even the multi-business IBM could not escape.
The top 5 are in the semiconductor food chain from INTC down to SOXX including capex sensitive names such as Applied Materials (AMAT) at #4. It took a 26.8% return to make the top quartile. In stark contrast, the bottom quartile starts at -24.6% for Palantir and ends with Zillow (Z) in last place at -44.8%.
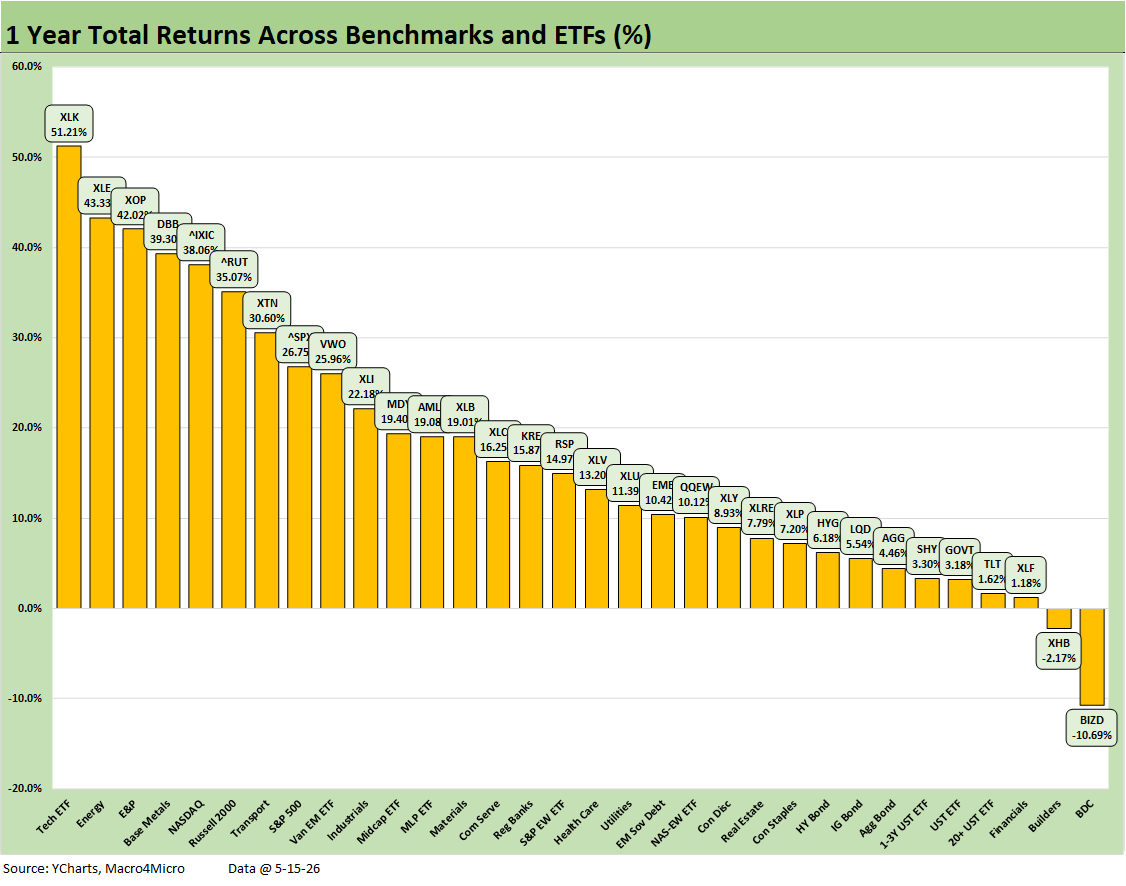
The positive vs. negative score has seen minimal movement on an LTM basis with the bottom dwellers at this point seeing Homebuilders (XHB) at -2.2%, making it a 30-2 count and joining the BDCs (BIZD) in last place with its -10.7% performance.
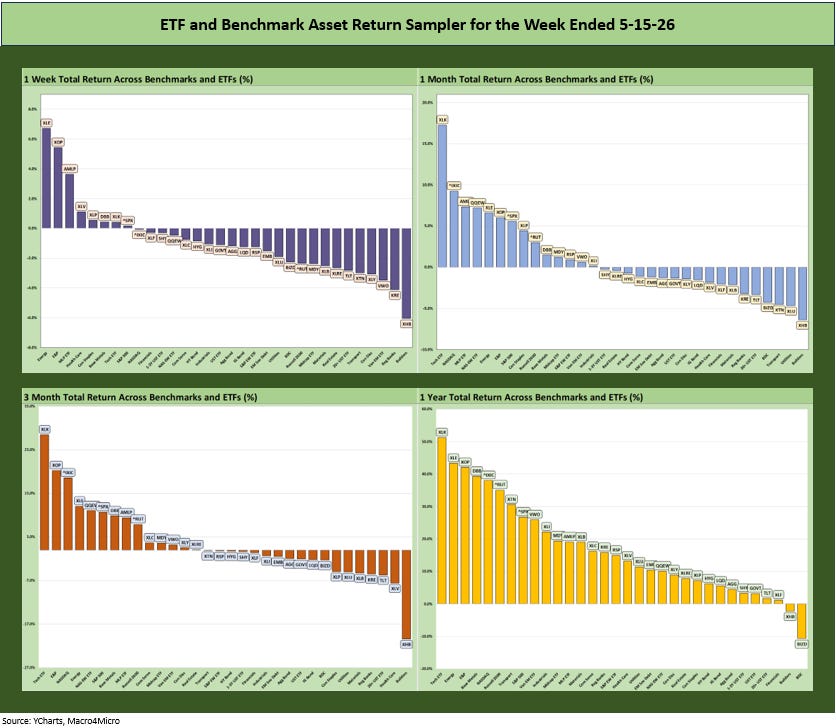
The rolling return visual
In the final section below, we combine the details of the 32 ETFs and benchmarks for a mix of trailing periods. The condensed 4-chart view offers an easy visual on how the mix of positive vs. negative returns shape up. We see it as a useful exercise in looking for signals across industry groups and asset classes.
The post-Iran period has brought in more negative returns into the mix across the recent periods than we had been seeing.
See also:
Taiwan: Stakes are High, US Awareness is Low 5-17-26
Industrial Production April 2026: Bringing a Lift 5-15-26
Existing Home Sales April 2026: Steady or Clinging? 5-14-26
Producer Price Index April 2026: Heat Rising on Cost Inputs 5-13-26
CPI April 2026: 4.1% All Items Less Shelter, 30Y UST 5% 5-12-26
Employment Situation: April 2026 5-8-26
New Home Sales March 2026: Favorable Volume, Weaker Prices 5-5-26
JOLTS March 2026: Openings Down, Hires Up, Layoffs/Discharges Up 5-5-26
PCE Inflation, Income & Outlays March 2026: Inflation Anxiety Level? 5-3-26
1Q26 GDP Advance Estimate: Consumer Fade, Investment Boom 4-30-26
Synchrony Financial: Favorable Consumer Credit Signals 4-24-26
Industrial Production March 2026: Mixed Picture, Big Questions Ahead 4-16-26
Existing Home Sales March 2026: New Beginnings or New Ends? 4-15-26
4Q25 GDP: More Adverse Revisions in the Golden Year 4-9-26
The US as an Aspiring Emerging Market: Fiscal SNAFU, Political FUBAR 4-6-26
UST Deltas: Elevation Realities 3-29-26
Market Lookback: Confusion Reigns, Dislocation Pours 3-22-26
Market Lookback: The Gulf of Cause and Effect 3-15-26