Employment Cost Index: Slow Motion
We give some context to the quarterly Employment Cost Index number for 1Q23 as compensation rose vs. the 4Q22 ECI.
"Services might be tipping the balance the wrong way."
After three quarters at or above 5%, the compensation for civilian workers of 4.8% is likely to be seen as too high for Fed comfort and goes in the bad news category.
Using the rolling seasonally adjusted 3-month number as the guide, the trend line was negative after a 4Q22 at 1.1% (revised from 1.0%) rose to 1.2% for 1Q23 for all civilian workers.
Service workers are still seeing a 5.0% handle for YoY wage comps vs. 4.3% for Goods-producing industries (not seasonally adjusted), so the inflation battle continues in a market dominated by Service workers.
The PCE inflation number over in the Personal Income and Outlays release separate from the ECI report was not all that supportive either as Core PCE inflation ran at 4.6%.
We looked at the Employment Cost Index in detail in last quarter’s “ECI” update (see Employment Cost Index: Labor vs. Capital …Tide Turning or Swirling? 1-31-23) that included more of the histories on private sector vs. state/local. We also framed some of the debates that have raged over the years on “labor vs. capital.” The reality of today’s market is that labor is having its day on the back of a tight labor backdrop that also comes with eroding purchasing power as an unsettling fact of life for many.
While there is a range of numbers to play with in this report (e.g., seasonally adjusted or not seasonally adjusted) and many categories broken out (goods vs. services, private sector vs. public sector ex-Federal, data by occupation, etc.), there is no getting around the fact that wage pressure is high and it is showing up in compensation cost metrics.
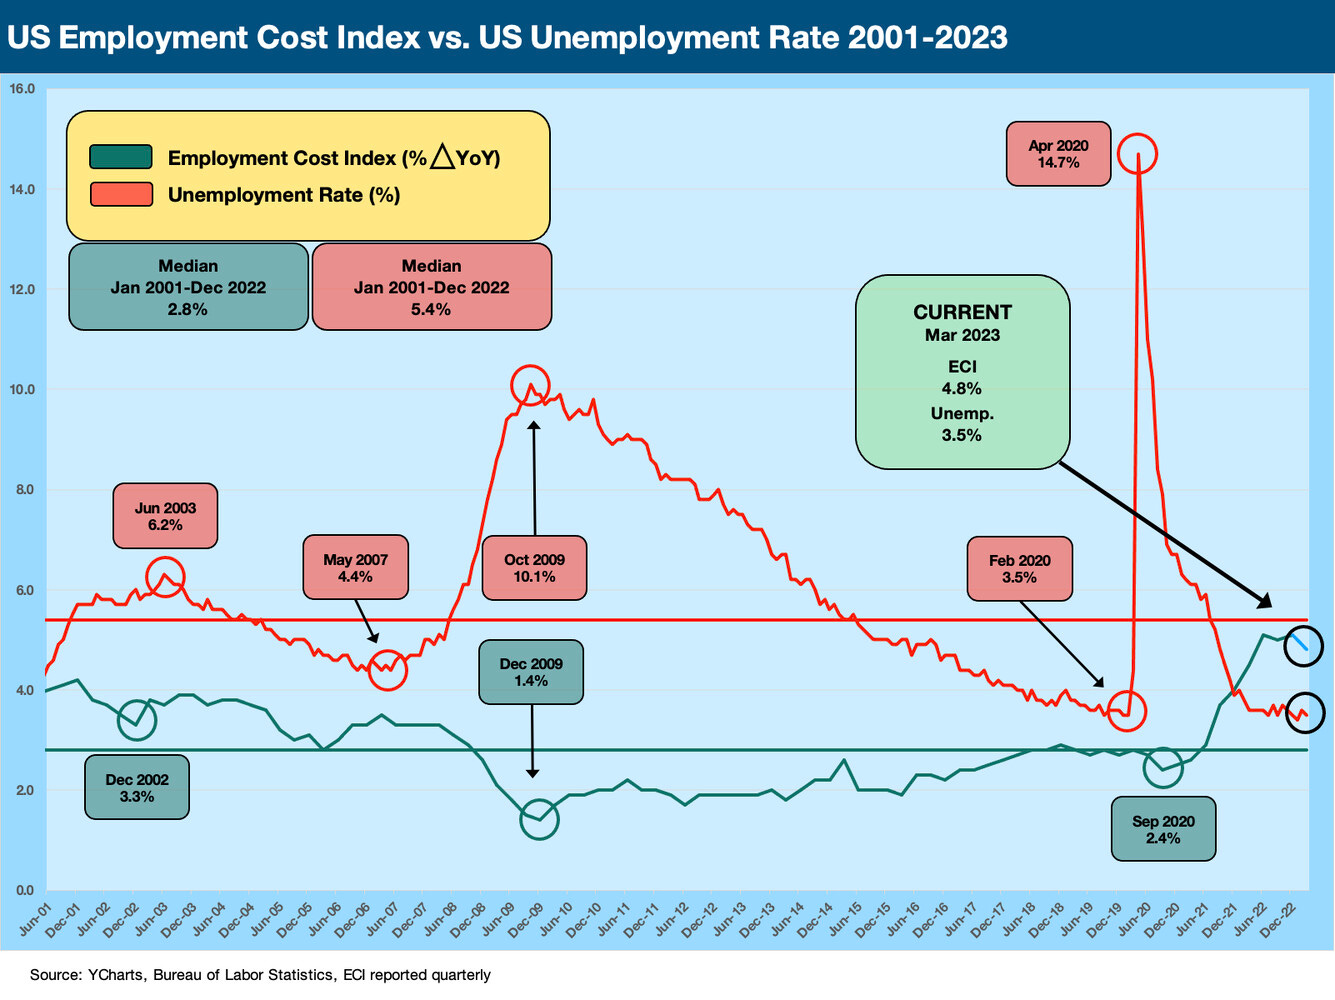
The above chart plots the timeline of YoY changes for compensation increases since 2001. The timeline cuts across two economic cycles (with one record long expansion that ended with COVID) or we can call it two full cycles and a pandemic that makes this current run the third expansion of the mix (see Expansion Checklist: Recoveries Lined Up by Height 10-10-22, Business Cycles: The Recession Dating Game 10-10-22).
The current 4.8% ECI total compensation for all workers (not seasonally adjusted) is above the prior peaks during the time series above. If we use the seasonally adjusted 1.2% for 1Q23, we are above the 1.1% (revised from 1.0%) from the 4Q22 quarter. Using that as a guide, we annualize out to 4.8% now vs. 4.4% in the last one (we are not a fan of annualizing such metrics, but that shows up in reports). On the face of the numbers, the March 2023 ECI was not a good news item on balance for the inflation checklist. The lower trailing 12-month numbers are trumped by the higher quarterly run rate.
The above chart adds the time series for unemployment with the 3.5% number still hovering just above a 50-year low. With the JOLTS report out next week followed by the monthly Employment report to end the week, it is going to take some material news to feed a scenario of lower wage inflation ahead in the Services sector. The Services numbers broadly (labor and CPI) are at the top of the inflation debates these days (see CPI: Make Your Own Metrics 4-12-23).


