
Employment Cost Index Sept 2023: Expect the Expected
The Sept 2023 Employment Cost Index moved lower but still an inflation issue.


The Employment Cost Index (ECI) is trending down sequentially across this quarterly release but remains in a 4% handle and well above the magic 2% with the long-term median from 2001 at 2.8%.
The tight labor market is still a friend of wage increases and notably from the low base in lower paying industries such as the services subsectors that tend to lead the JOLTS ranks of turnover each month.
The UAW contract grabbed major headlines and so did some other industries with a lot of leverage at the negotiating table this tightening cycle (Freight and Logistics, Airlines, supplier chains, etc.), but the heavy lifting in labor markets is still more a supply-and-demand game than a collective bargaining issue just on the low unionization rates in the private sector.
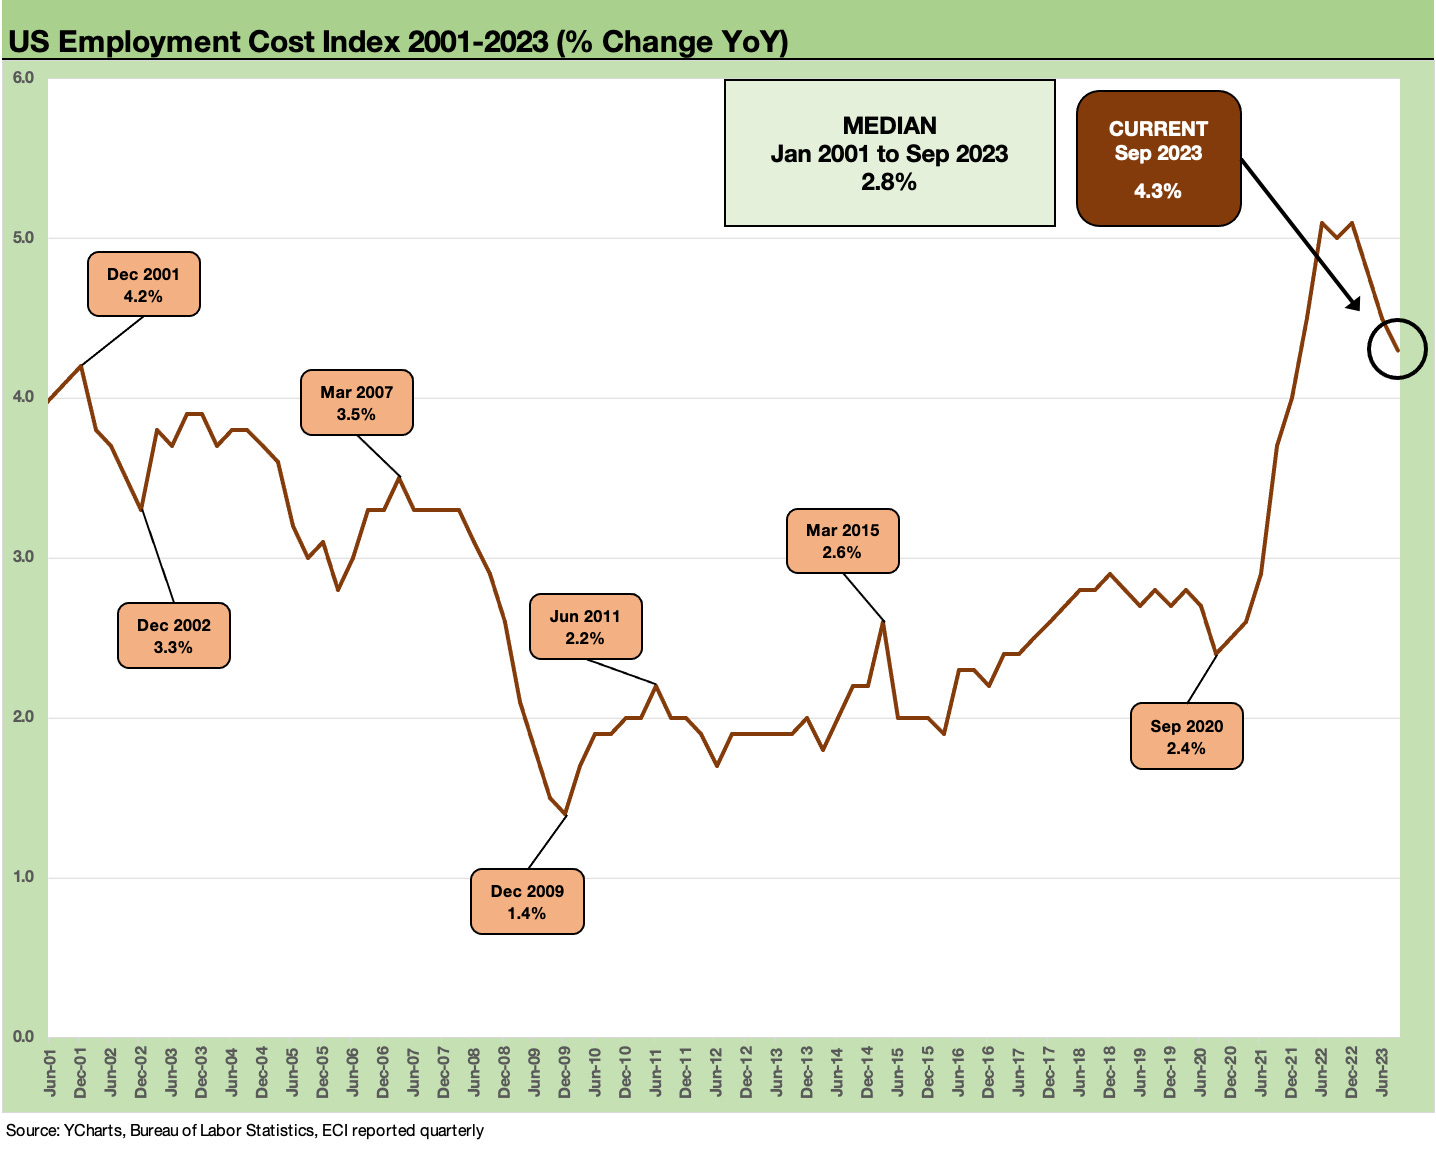
The above chart updates the Employment Cost Index that serves as a useful quarterly indicator on wage and compensation trends across the workforce broadly or by broad sector (Civilian, Private Industry, State and Local Government) or at the narrow industry level.
The numbers are now coming down in 2023 (see Employment Cost Index: Rings of the Redwood 7-28-23, Employment Cost Index: Slow Motion 4-28-23) after being mixed in 1Q23. The Sept ECI of +4.3 % “not seasonally adjusted” for “All Workers” is down sequentially from +4.5% in June 2Q23 and down from +5.0% in Sept 2022 YoY.
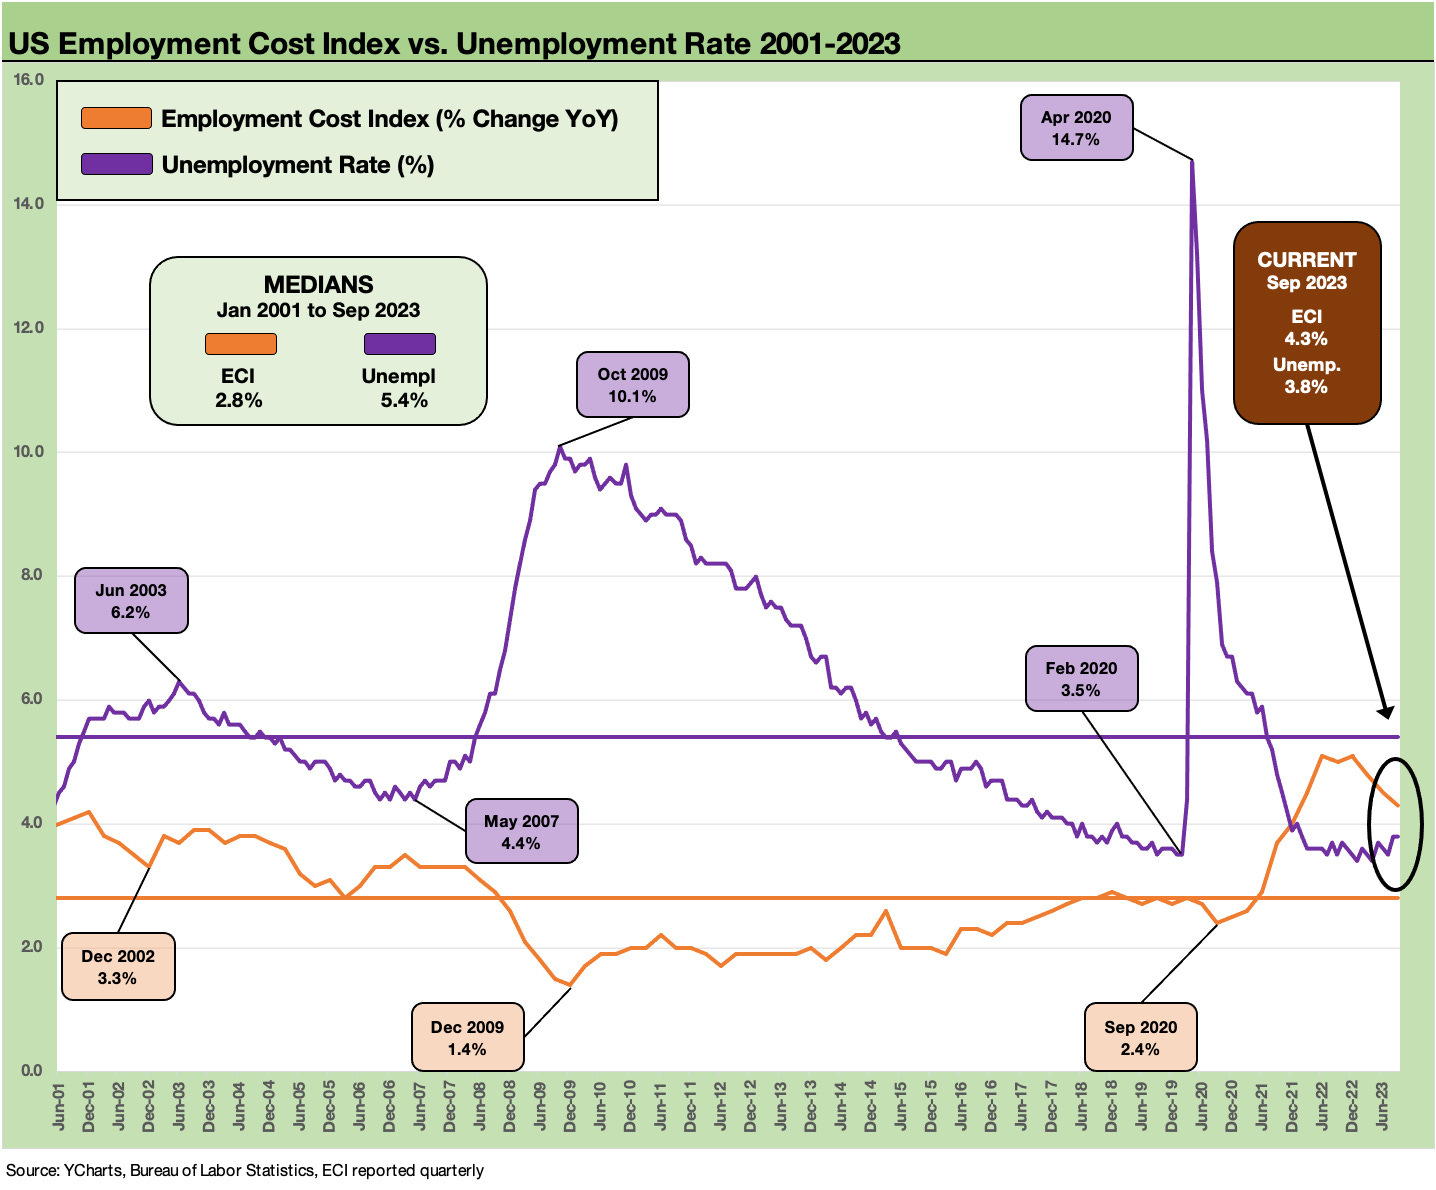
The broad theme is still that tight labor brings higher wages when demand is high and headcount is short. The effects can be exaggerated across certain occupations and regions, and collective bargaining has captured a lot of headlines. The darker policy undercurrent is that it takes job losses and higher unemployment to bring inflation down whether by cyclical trends or Fed inducement. That is a regular “head-banging” exercise that Powell faces in Washington on his rate policies when in front of Congress.
There are plenty of details in the weeds in the release. In the “not seasonally adjusted” numbers, we see Goods producing at +3.8% in Sept down from +4.0% in June 2023 and +4.5% in Sept 2022. That means the UAW did not ring the bell – they broke the bell after all the ancillary payouts and benefits are rolled in even above wages. Service-producing industries posted +4.5% in Sept 2023, down very slightly from +4.6% in June 2023 and a more robust +5.2% in Sept 2022. Public Administration was +4.9% in Sept 2023 vs. +4.7% in June 2023 and +5.2% in Sept 2022. The Public Sector is catching up at a lag.
The compensation cost trend line in a tight labor market is an intuitive reality, and a side effect of the very strong employment numbers racked up under Biden. The fact that supply-demand imbalances in labor, housing, and goods lead to price inflation (or in housing’s case, resilience) is not going to get you tickets to Stockholm for a Nobel.
The Biden jobs numbers are the best in history on a pure numbers basis, but the sobering thought for Biden fans (or Trump haters, not always one and the same) was that Jimmy Carter had an excellent performance in percentage growth of total employment during his one term with the best % increase in payroll count for the period we looked at (started with Nixon/Ford). As we know now, that was undone by inflation and a recession (see Employment Across the Presidents 8-15-23) and more than a little Reagan charm and a positive view of America’s direction after the brutal 1970s.
The strong demand for labor and job count for Biden might get him bragging rights for support of household financial health, but that demand effect also can expose him to the broadsides of what such demand brings – namely, inflation in wages that drives demand for goods and services. That includes the same sellers of goods and services that are scrambling to hire. And thus, the stubborn inflation cycle down in “the red zone” under 4% where it is tough to make incremental progress.
We see this demand for bodies in the monthly employment report. The next report will be out this Friday after solid Sept numbers (see Jobs ‘R’ Us: The Perils of Plenty by Occupation 10-6-23). The payroll report on Friday will be the most current read. The JOLTS report lags one month and will be out tomorrow (see JOLTs: Staying Alive 10-3-23)
In the end, lower is better in wage and compensation trends but a 4% number is what the Fed will see even if lower. The stunningly strong performance of the UAW on its collective bargaining deal struck was one for the record books, and that could turn into a much-cited benchmark for manufacturing workers in 2024. That is not easy to get done, and it is a powerful union at a critical time in industry evolution.
Depending on how incompetent the Biden team messaging might prove to be (considering how successful it has been in employment and GDP growth), the pro-union angle they choose to recruit the working class in key swing states has limits. A pro-collective bargaining pitch has pro-inflation significance. That is a tricky needle to thread. We wish the unions well, but they are a very small part of the tight labor dynamics and especially in low paying services jobs.
Wages and unions are certainly not one and the same, but the White House uses the “union” word with heavy emphasis. The numbers game shows private sector union rates at only 6.0%. The Public Sector started 2023 at a 33.1% rate. In other words, appealing to the 6.0% to get to 8.0% union rates is a tricky process with such low numbers relative to the total voting population.
Even if just looking at the swing states (some such as AZ, GA have very low union rates), the numbers are quite low relative to states such as New York and Hawaii (20% handles). That is a topic for another day. The annual unionization data comes out each January from the Census.