


There goes the neighborhood…
The worst week in recent memory for the UST curve unfolded with the 10Y at 4.97%, just below the 4.99% Oct 2023 highs. The odds of 1 hike for this coming week edged above 87% to end the week. The Mortgage News Daily survey closed the week at 7.12%.
Oil (WTI) ran higher to $104 WTI at one point intraday during the week with the Friday close of just over $100 per bbl Friday for WTI and with Brent just under $105 per bbl. $100 WTI is a long way from the $82 handles just a month ago on Friday August 14.
PPI showed an ugly set of numbers. CPI did not bring a negative surprise while also not offering relief (see PPI August 2026: Leading Indicator Signaling Struggling 9-10-26, PPI August 2026: Leading Indicator Signaling Struggling 9-10-26).
We look at asset return results in a separate commentary, but all the major equity benchmarks were in the red from large caps down to small caps and the 7 bond ETFs we monitor were also in the red. The Homebuilder ETF (XHB) was in dead last in the bottom quartile along with the Equal Weight S&P 500 (RSP) and Equal Weight NASDAQ 100 (QQEW). This highlights the breadth of pain.
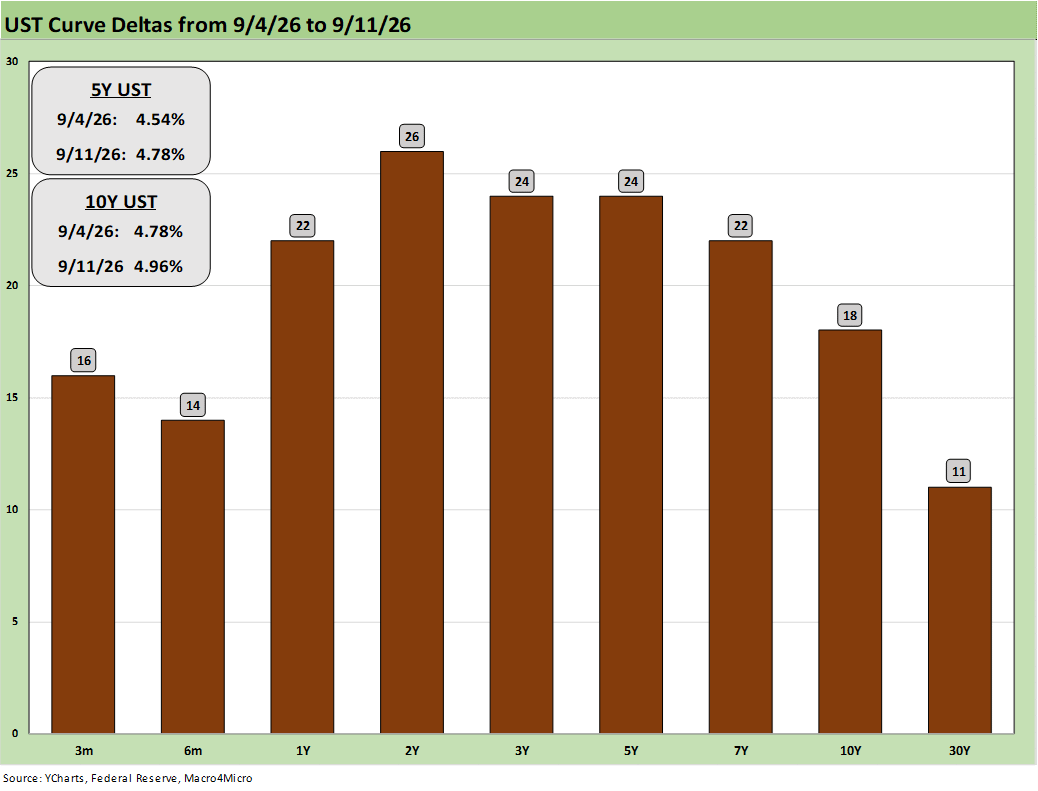
The above chart details the weekly UST deltas with the 2Y at +26 bps and 10Y UST at +18 bps to just under 5.0%. This week we get the FOMC answer and see what else Bessent will pull out of his hat.
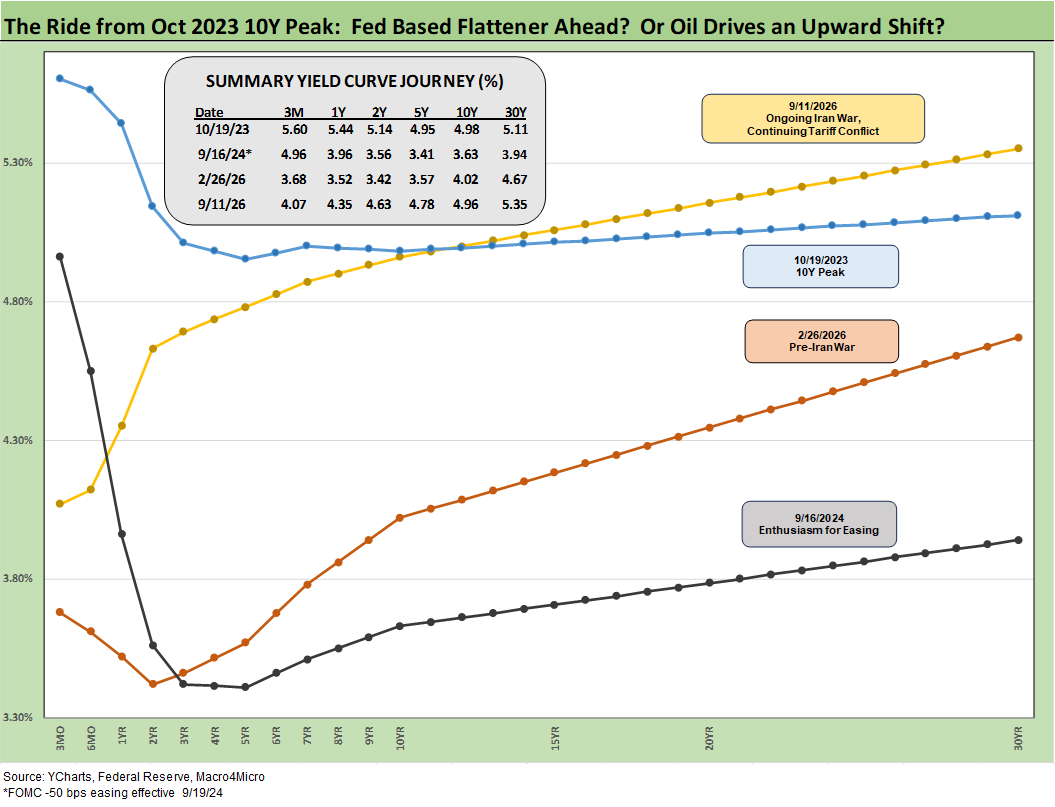
The above yield curve migration chart shows the move toward the Oct 2023 highs. Note: We see over 4.97% on the 10Y UST at the end of Friday, but Y Charts time-stamped it at 4.96% in its data set.
We like including the 9-16-24 chart in this mix to show where the UST curve was just ahead of the Nov 2024 election. From that point on, the steepening that set in blew away many of the bull flattener forecasts that were in place for 2025. The bear steepener arrived with a vengeance. The recent trends have focused quite a bit on duration pain in the bond asset class.
The 10Y UST is a critical driver of market sentiment and 30Y mortgages, but the move to 5.35% has also generated a lot of headlines even with Bessent’s ineffectual liability management strategies.
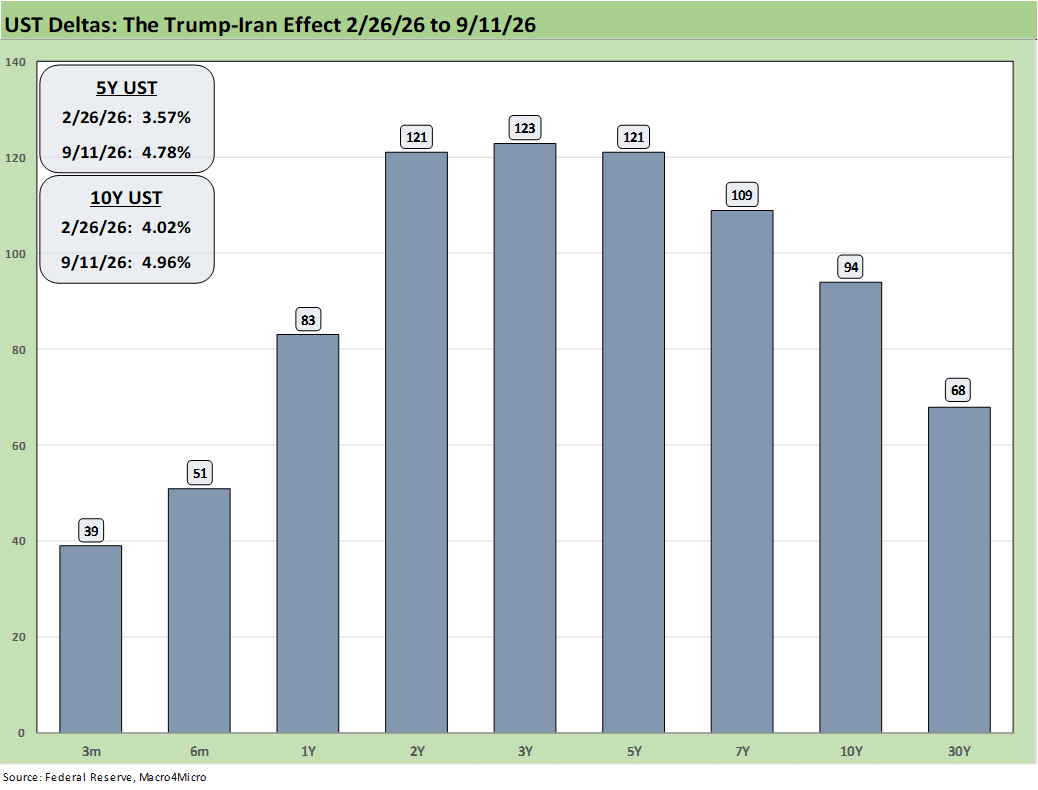
The above chart updates the post-Iran UST deltas (bombing started 2-28-26). The policy effects are clear.
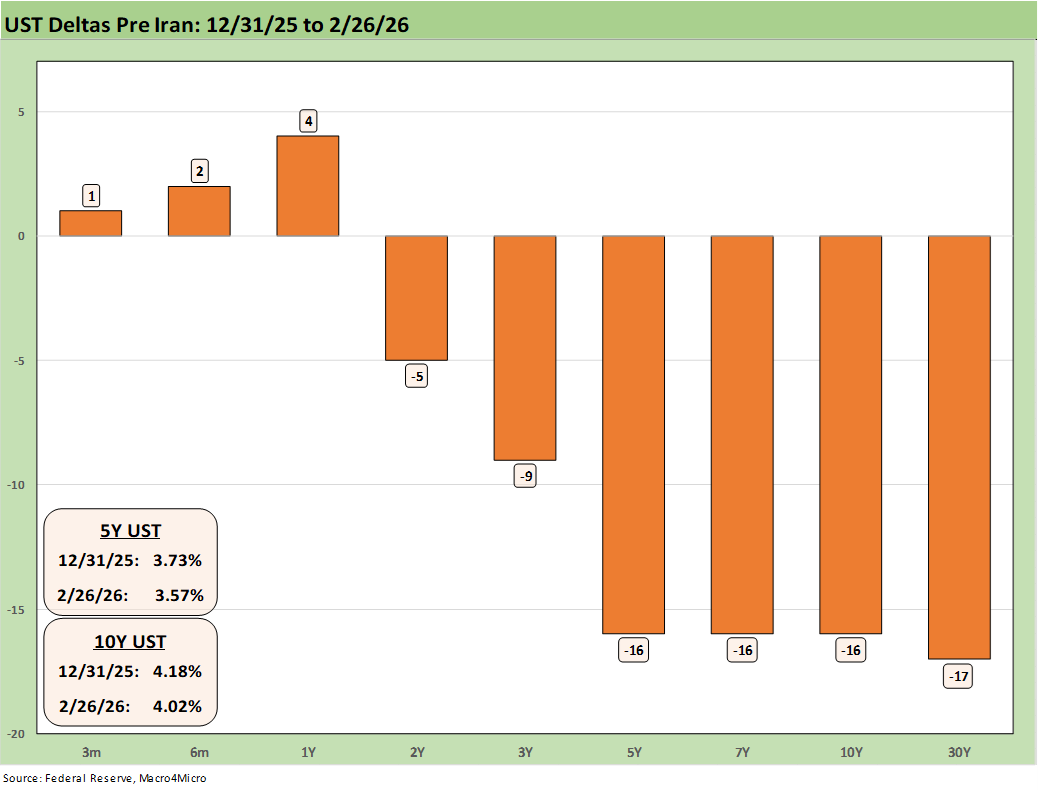
The above chart offers a reminder of what the UST curve was doing before Iran. Iran was not a great geopolitical or macroeconomic decision. We are not sure who told Trump that the “bomb vest crowd” would immediately surrender unconditionally. To avoid embarrassment, they just keep repeating “nuclear weapon” after already earlier stating such capacity had been obliterated.
What unfolded was a massive resource choke point in the Strait of Hormuz that spread to military escalation and worsening regional infrastructure damage. We now have the Houthis making their move on Red Sea economic damage with control of Bab al-Mandeb. Weapons stockpiles are already low for the US, so any response to the Houthis from the US will be a challenging decision point.
As reported on Friday, the Saudis have shut down their East-West pipeline that had offered some cushion to the Hormuz shortfall. The estimates we see cited include 4% to 5% of global supply. The EIA cited 8% of total 2Q26 crude oil + petroleum products.
The Red Sea share of total merchandise was reported at 12% of global trade, so the supplier chains could be heading into a new zone of trouble. That could mean even more inflation tied to supply-demand imbalances across the wider array of products. That is notably the case with Europe-Asia volumes.
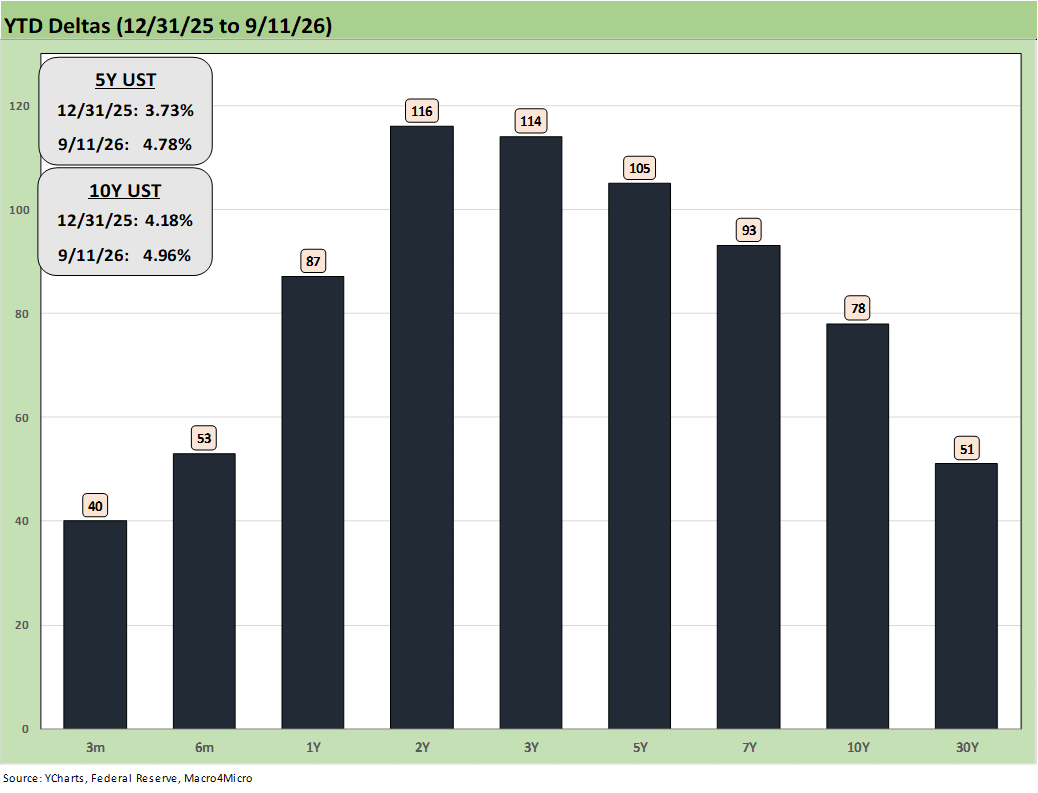
The above UST deltas updates where the UST yield curve has trended YTD.
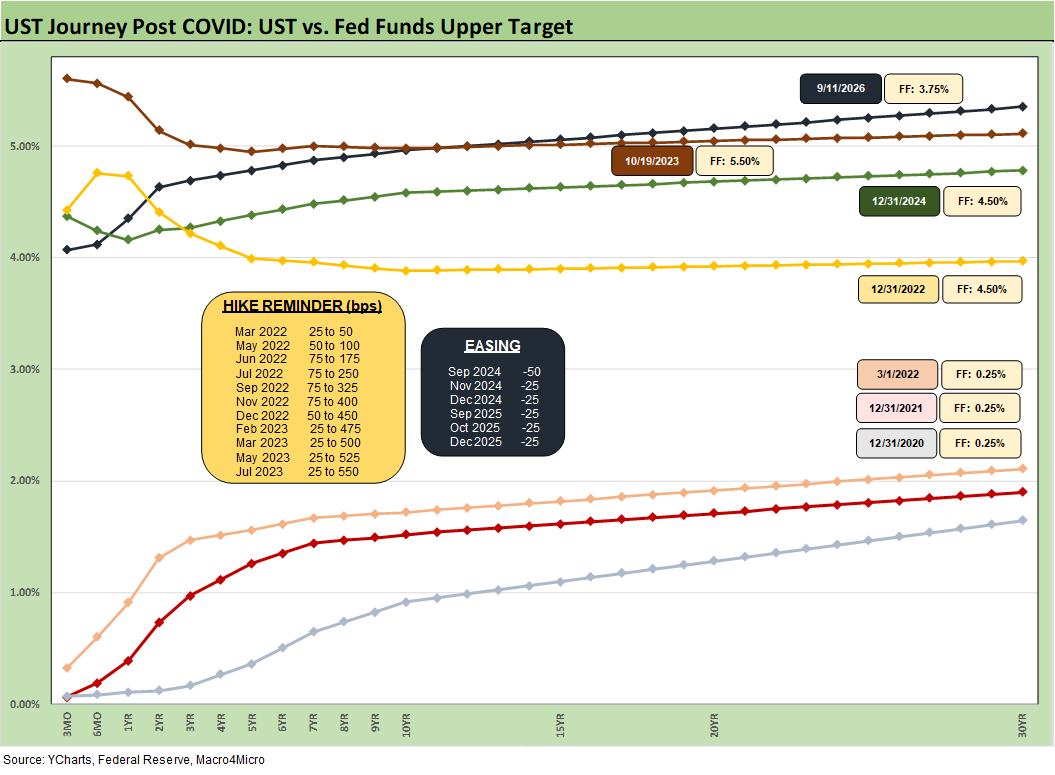
The above chart is one we typically include as a memory jogger on the troubled journey from COVID and ZIRP across the tightening and easing cycles. We detail the easing and tightening actions by month and magnitude across time in the boxes.
We see the shift after March 2022 to year end 2022 on the tightening and inflation pressures. That was clearly a major move from March to Dec 2022. This timeline cuts across the easing in late 2024 and 2025.
Trade wars and tariffs will play a role, and that is getting worse. Wages have been an X factor in past inflation cycles and that has not arrived (yet). Many eyes are looking for any hint of wage pressure, but that has not shown up at all at this point (see Payroll Aug 2026: Trouncing Low Expectations is “Positive” with an Asterisk 9-5-26).
Negative real wages in a steady economic cycle are supposed to move the needle higher on wage expectations, and that affordability discontent can show up in politics (election year) and policy decisions. Collective bargaining also can play a role.
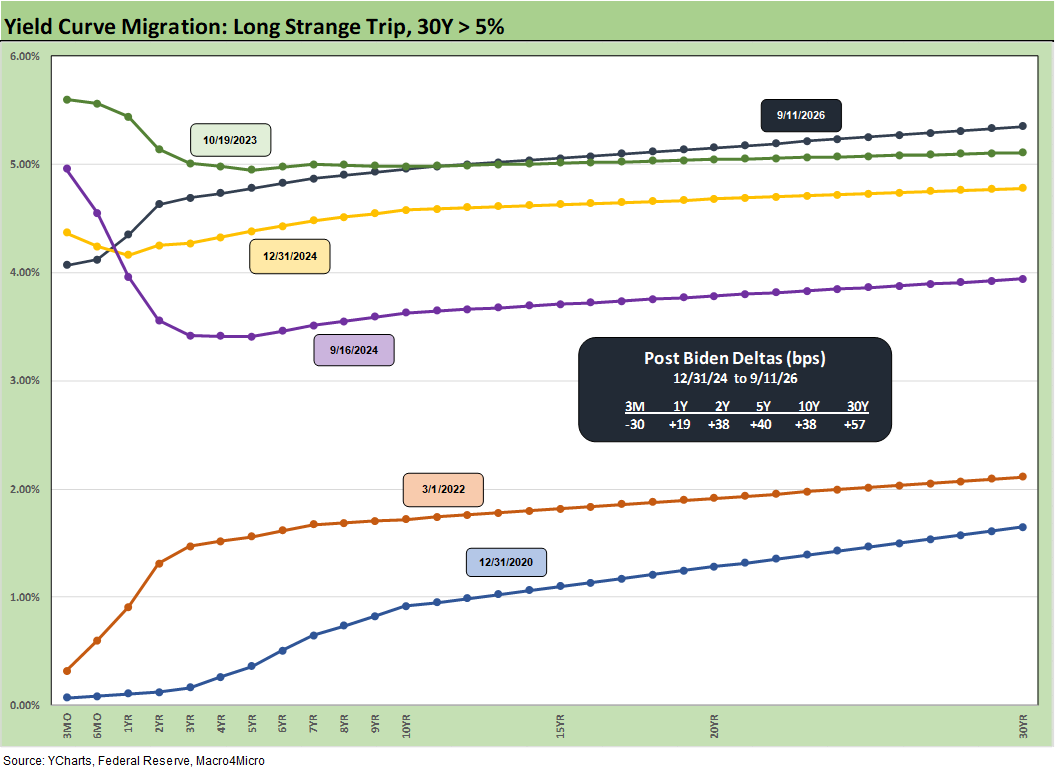
The above chart does a similar exercise but drops in a yield curve for 9-16-24 just ahead of a fresh easing cycle. The inversion of Sept 2024 into an easing cycle in late 2024 and 2025 has not brought the results promised by Team Trump. They continue to demand easing, but the FOMC is likely to be resistant. The markets clearly are not on board. This week could bring some political fireworks.
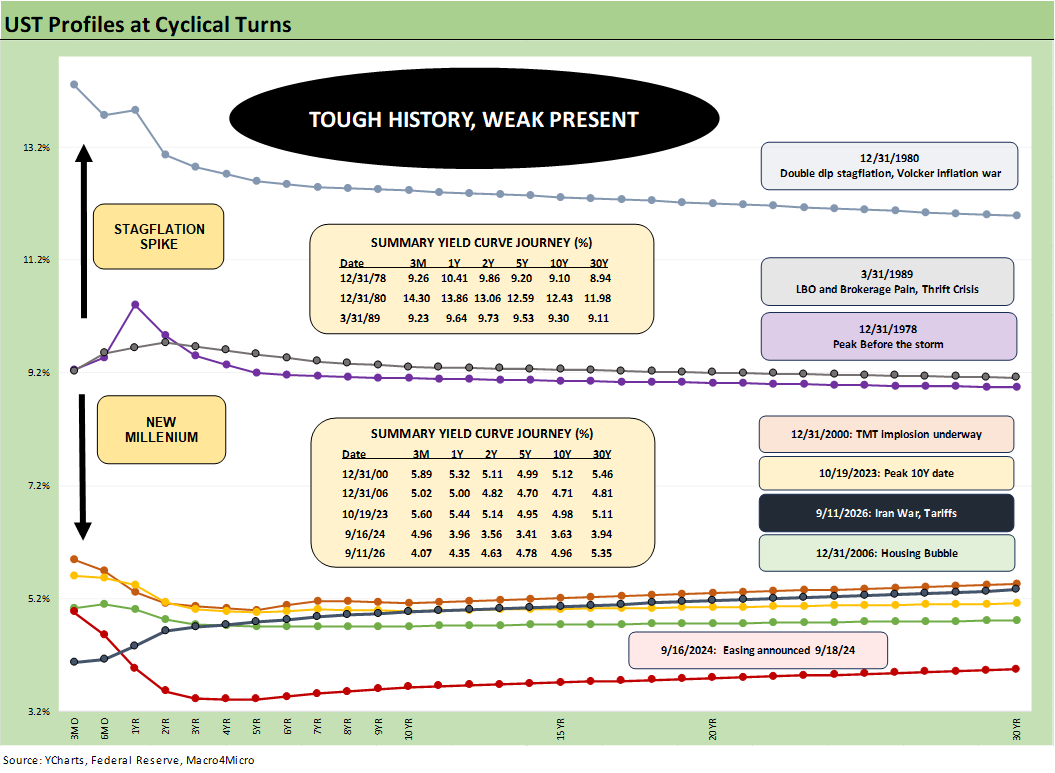
The above UST history revisits the shift from the Carter inversion and peak of 1978 across the stagflationary 1980-1982 double dip that kicked off after an Iranian oil crisis in 1979.
We see the 9-16-24 UST curve sitting on the bottom during the late stages of the Biden administration, but we suspect Trump, Hassett, and Bessent will not be flagging that memory. After all, the UST curve had sent mortgage rates higher again after team Trump was put in office. We just crossed above the 7% threshold. We are still below the peak mortgage rates of Oct 2023 but closing the gap.
One of the key takeaways from history is that flat curves that arrive after some FOMC tightening in a cyclical peak can lead to trouble. The question will get louder if the Fed tightens again by year end and follows up with more.
Worries get worse if we start to see an inversion, but that appears a long way off unless the oil markets crash. Credit market peaks such as the transition across 1989 into 1990, the move into 2000 after a +86% NASDAQ year in 1999, and the tail end of 2006 on the way into 2007 all make for some interesting compare-and-contrast drills.
We look at some of these histories in the links at the end of this commentary.
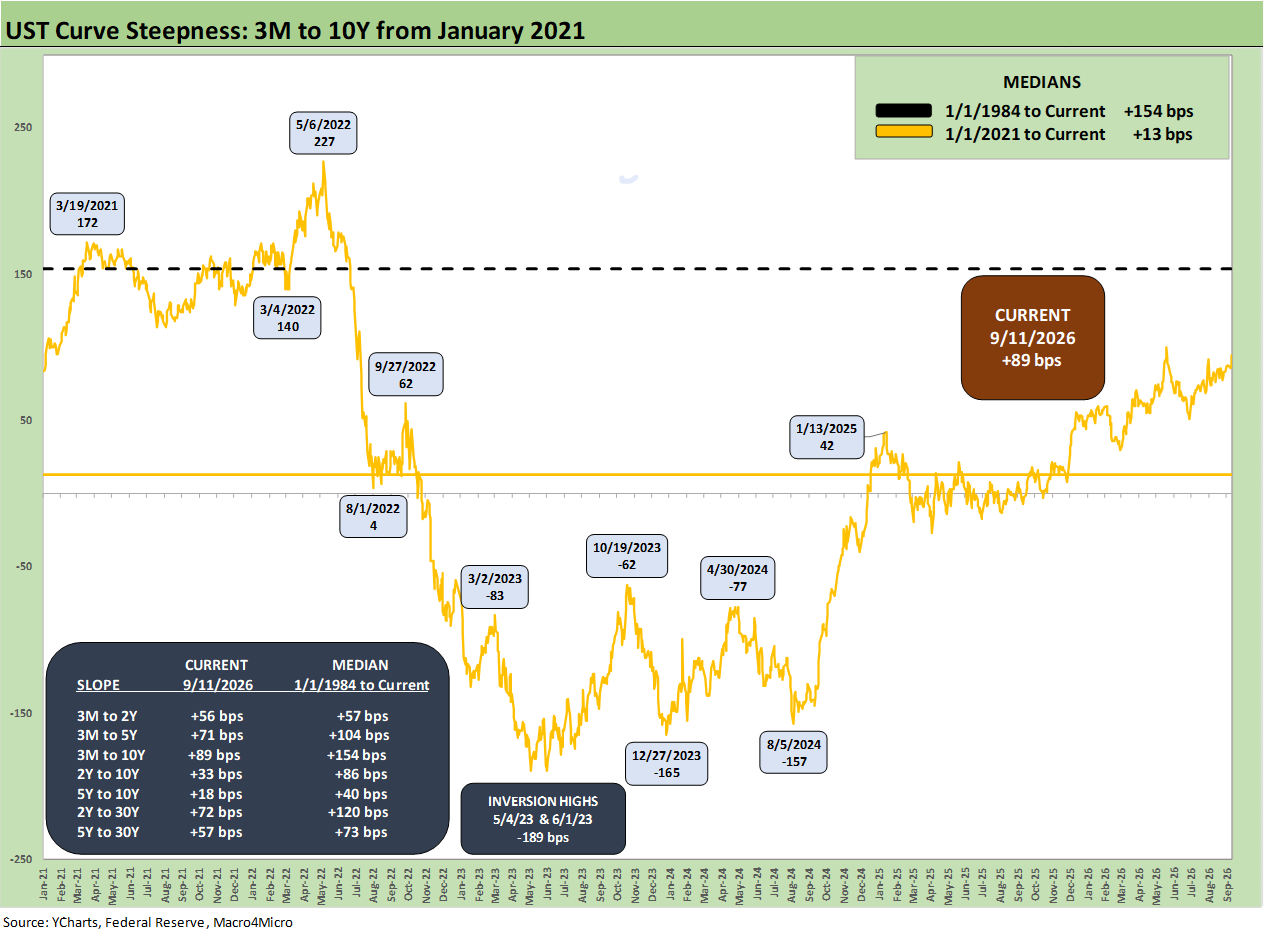
The above chart updates the 3M to 10Y slope history from the January 2021 ZIRP period. The current +89 bps is well below the long-term median of +154 bps. In the recent post-ZIRP tightening cycle that shifted into an easing cycle by Sept 2024, we see a peak slope of +227 bps in May 2022 ahead of peak inversions of -189 bps (May and June 2023). The median from Jan 2021 through Friday close was only +13 bps.
The box also breaks out other current slopes and medians for UST segments we monitor.
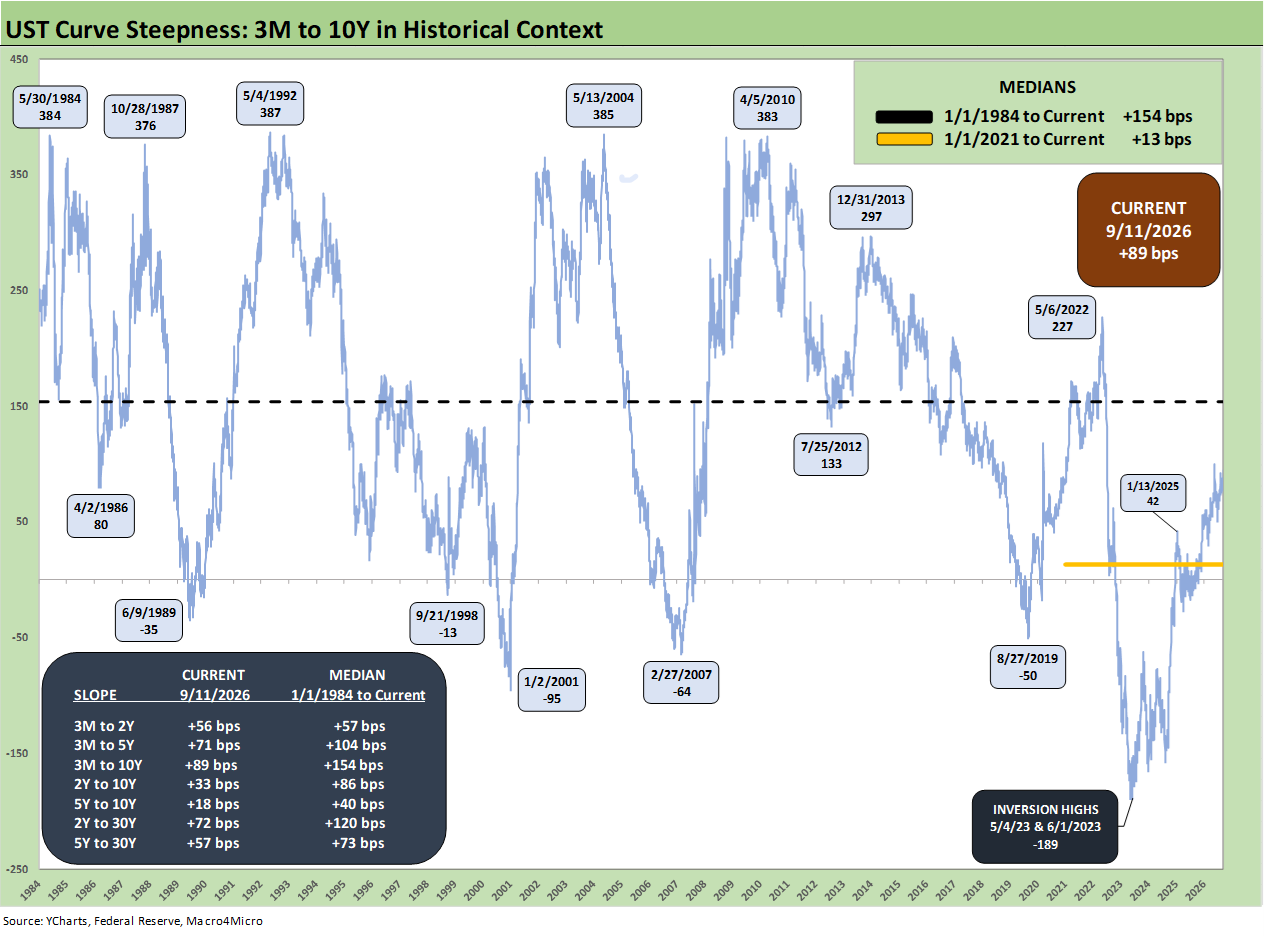
The 3M-10Y slope timeline is posted above from January 1984. It highlights the dramatic swings across economic and monetary cycles. We left out the wild, distorted 1979-1982 years to avoid impairment of the visuals across remotely normal cycles.
See also:
CPI Aug 2026: Staying Stubborn, Not Accelerating 9-11-26
Existing Home Sales Aug 2026: Headwinds Still Driving the Story 9-10-26
PPI August 2026: Leading Indicator Signaling Struggling 9-10-26
Weekly Tech Check: Semis vs. Software Push-Pull 9-7-26
Weekly Returns: Benchmarks and ETFs 9-7-26
Duration Daze: Post-ZIRP Bond Returns 9-7-26
UST Market: Curve Meets Knuckler 9-7-26
Payroll Aug 2026: Trouncing Low Expectations is “Positive” with an Asterisk 9-5-26
Market Commentary: The Curve 8-30-26
PCE July 2026: Mixed Consumption, Stubborn Inflation 8-26-26
2Q26 GDP: 2nd Estimate 8-26-26
US-Canada: Benches Ready to Clear 8-22-26
US-Canada Tariffs: Protection Racket 8-19-26
Some yield curve histories:
Business Cycles: The Recession Dating Game 10-10-22
UST Curve History: Credit Cycle Peaks 10-12-22
Bear Flattener: Today vs. 1994 and Aftermath 10-18-22
Fed Funds, CPI, and the Stairway to Where? 10-20-22
Greenspan’s First Cyclical Ride: 1987-1992 10-24-22
UST Curves: Slope Matters 10-25-22
Greenspan’s Last Hurrah: His Wild Finish Before the Crisis 10-30-22
Wild Transition Year: The Chaos of 2007 11-01-22
UST Slope Update: Some New Inversion Highs 12-8-22
Yield Curve Lookbacks: UST Shifts at Cyclical Turns 10-16-23
UST Moves 1978-1982: The Inflation and Stagflation Years 10-18-23