


Time to tilt at the trade deficit again…
The payroll relief thickens the plot for the FOMC as Trump threatens to cease all trade with anyone who has a trade surplus with the US unless the FOMC eases. That means the EU, Canada, Mexico, China, and Japan to start (or a majority of US trade) before we move onto the next tier of trade partners.
It is hard to anticipate a rational and orderly closeout of 2026 with respect to the FOMC or the macro inflation inputs (including payrolls) with trade policies still being used like a risk-free instrument. Bat guano demented is the only way to frame the latest outburst with the FOMC meeting slated for 15th-16th.
The August payroll numbers were modestly favorable in the context of where they have trended in 2025-2026, and they were naturally exaggerated based on the magnitude of the beat rather than the absolute numbers in recent years. The mix is still mediocre at best in goods (+41K) and the manufacturing subset (+16K MoM, +23K YoY).
The Household Survey data translates into the 4.1% unemployment rate. It is always worth a look at the numerator and denominator in the Household Survey. We see an increase of +115K unemployed for a total of 7,031K and a 4.1% unemployment rate (7,031K unemployed/169,777K labor force). The total employed rose by 569K to 162.746 million. The labor force rose by 683K. The participation rate of 61.6% ticked higher from July (61.4%) but is down from 62.3% In Aug 2025.
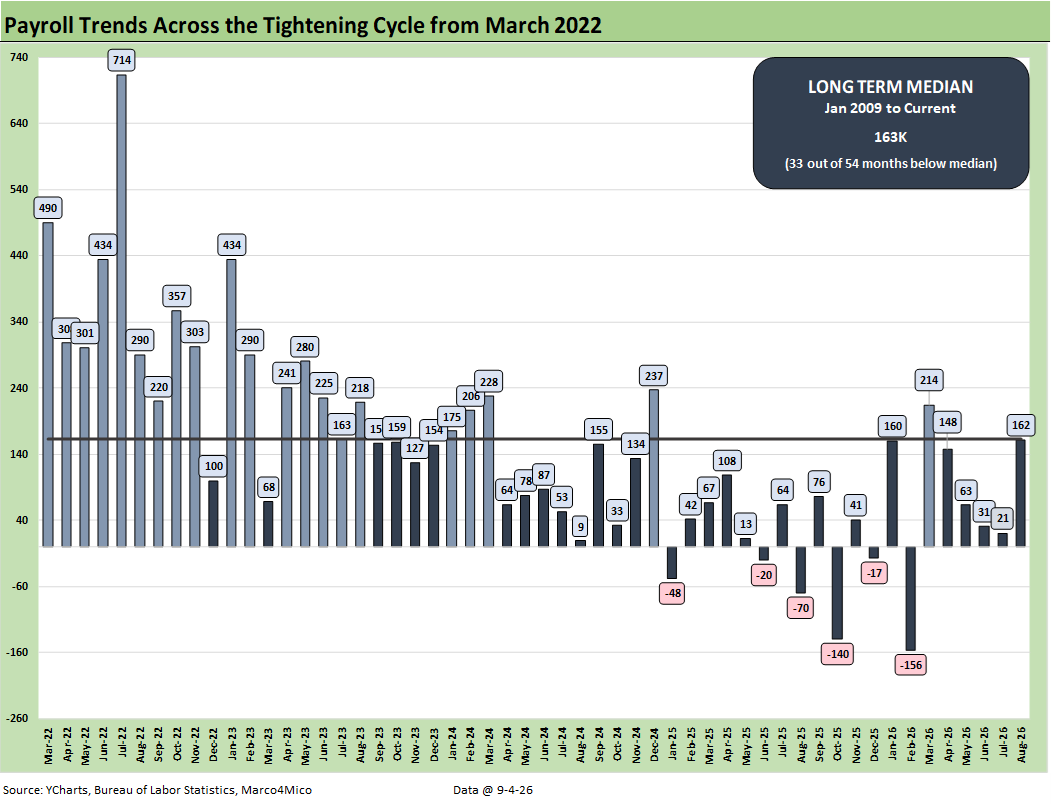
The chart updates the monthly deltas in payrolls from March 2022, which means it starts with the end of ZIRP and then into the journey across tightening and eventually the easing cycle. We also flag the median payroll deltas from Jan 2009 of 163K (includes the wave of revisions in older data).
We started the median timeline measurement on Jan 2009 to include the financial crisis and ZIRP period along with the carnage that came with bank meltdowns and assorted bailouts. 2009 also includes the unravelling of various bellwether industrials such as autos and the Chapter 11 spike in the automotive chain (GM, Chrysler and a wave of suppliers).
The 162K payroll adds delivered in August 2026 was triple the forecast consensus and shocked many, but the gross job adds need a frame of reference. It is worth keeping that number in context vs. what unfolded in the tightening cycle and aftereffects of the 2022 oil spike which was triggered by the Russian invasion of Ukraine (that economic trigger point gets almost no airtime from Team Trump on inflation history).
That 162K is slightly below the longer-term median of 163K that we cite even if Aug 2026 payroll additions handily beat expectations and look great by that measuring stick. The 6 negative payroll delta months since Jan 2025 happen to be the only negative months in the timeline presented and all occurred during Trump 2.0.
The negative months are clustered more in mid to late 2025. Only 1 payroll delta since Jan 2025 beats the median (March 2026), but that is unlikely to show up in the Hassett marketing brochure. We see quite a few payroll deltas over 200K with 17 months in total from March 2022 to Dec 2024. We see 8 months above 300K in that time frame. That is the adjective-free scoreboard.
We break out the numbers in more detail below. The summary is that a material beat of consensus takes some heat off the FOMC this month on tightening and especially in the context of the unemployment rate of 4.1% (that would be full employment in any other cycle).
On the other hand, the 3.1% wage growth is underwater vs. inflation, and the payroll additions are still dominated by low multiplier occupation lines such as “Health Care and Social Assistance” and “Leisure and Hospitality.” You can go line-by-line in Table B-1 for the sequential MoM payroll deltas and likewise for the YoY deltas (we do that exercise each month), and the facts are that the granular picture pushes back on the “Golden Year” label. It is more in the base metal family. That is ok since base metals are solid. The marketing of the payroll performance tends to be more gaseous.
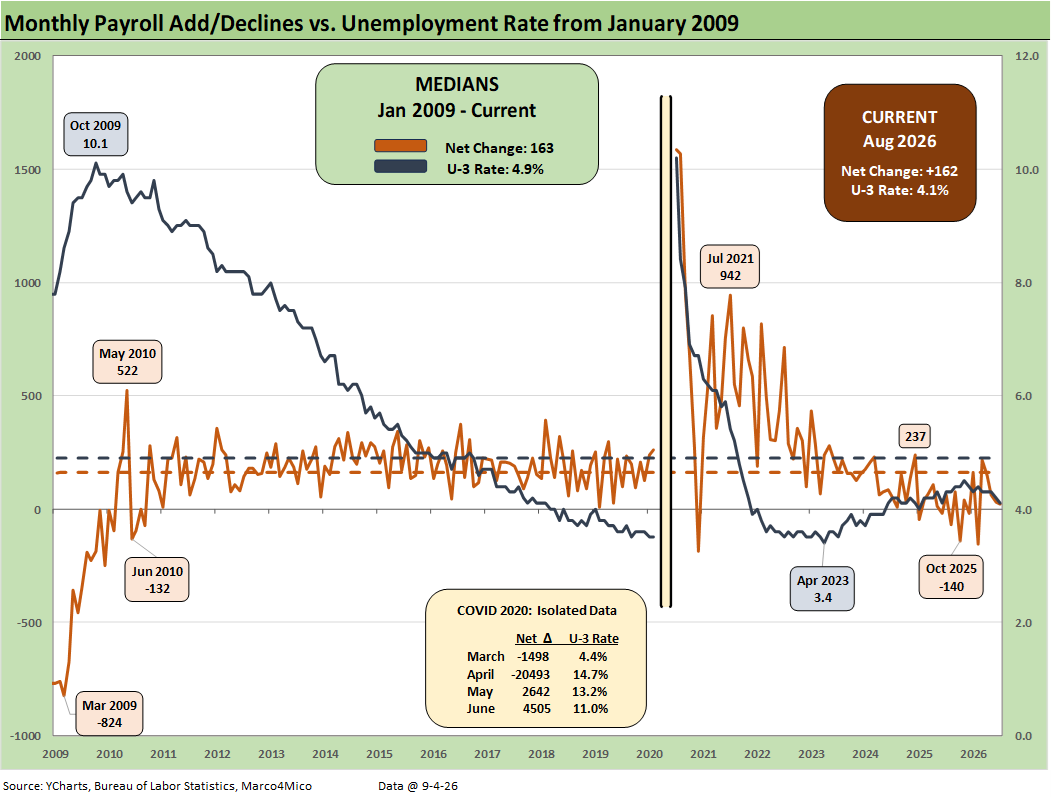
The above chart plots the running job adds/declines since Jan 2009 against the unemployment rate, which at 4.1% remains a full employment level even if the Household Survey data (addressed in a separate chart below) is showing material contraction in the labor force denominator.
In the chart, we isolate the worst months of the COVID dislocations in the box for better visuals to capture the other periods. The 4.1% U-3 is below the long-term median from Jan 2009 of 4.9% (5.0% median from 1994).
Payroll counts have been struggling somewhat in relative terms in 2025-2026, but history is very kind to 4.1%. The U-3 is a different exercise than “counting employed heads” in narrow context. As we cover below, the total of employed is down by -624K YoY.
If the 2025-2026 frame of reference for payroll additions is 2024 (not a good jobs year) then the 2025-2026 numbers are acceptable (not great). If we compare 2025-2026 monthly adds to the 2022-2023 period, the current job add run rates are weak.
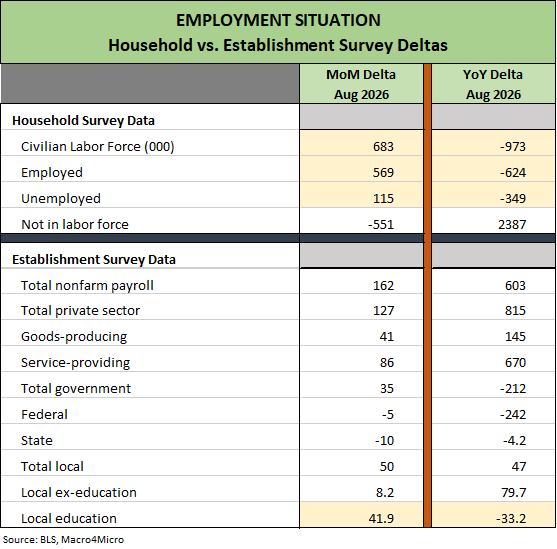
The above chart details the monthly data dance between the Household Survey Data and the Establishment Survey. The unemployment rate of 4.1% as always has a few moving parts with the total of employed, total unemployed, and civilian labor force all lower YoY.
For those of us who work off the “total paycheck rule” the paycheck count translates into purchasing power – or simply the ability to service growing debt burdens. So this backdrop is not a good one from that angle. “Low hire + low fire” is still not driving a much larger base of paychecks that can move PCE growth materially higher. It is also not a contraction story on the consumer side with negative PCE in fact being quite rare.
The usual high-level focal point around the “body count” metrics is total labor force and participation rates and related deltas. The participation rate is 61.6%, down from 62.3% YoY but up from 61.4% sequentially from July. A growing population and basic demographics should translate into higher total GDP (not necessarily higher growth), higher payrolls in a services-intensive economy, higher production volumes on rising demand (the trick is whether that gets filled by domestic production or imports), and higher total trade flows.
Some weakness in payroll trends in 2025-2026 can be tied to local distinctive factors such as local education seasonal patterns, but we are seeing YoY declines in local education even with the MoM increase. We will look at more occupation lines separately below, but the +62K bounce MoM in “Leisure and Hospitality” was a big help. That included +131K YoY.
The theme of “low hire, low fire” is still playing out but against a backdrop of weak affordability as covered in other commentaries. Wage growth has been lagging inflation (or slightly over/under inflation) by various metrics. The latest wage growth rate of +3.1% was down from +3.2% in July in the BLS payroll release. That is below headline PCE inflation (3.7%) and headline CPI (3.4%) for July. That is negative real wage growth, and that is a tough comparison for midterm elections. We get fresh August CPI and PPI data this coming week.
With its 1-month lag, the JOLTs release added some mixed news ahead of the August jobs numbers with lower hires set against modestly higher openings. For July, hires were down in Manufacturing (-45K) but higher in Construction (+47K) while job openings were notably higher in Manufacturing including +76K in Durable Goods.
Layoffs and discharges were lower in total with a minimal decline in Manufacturing. “Openings” are good in what they reflect about employer plans, but the actual hires might need some tumblers to fall into place including FOMC plans, oil prices, and tariff behavior. Those are all moving parts right now with some potentially moving more than others.
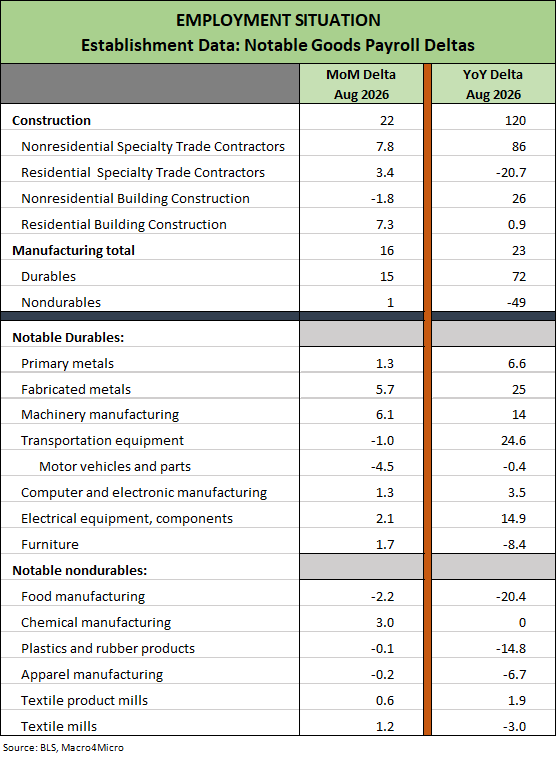
We detail payroll deltas in the “Goods” bucket across Construction, Durables, and Nondurables for a reality check on sequential MoM deltas and YoY. The exercise is in part a check on how targeted tariffs translated into jobs (or not).
The headline +162K in payroll adds crushed expectations as detailed earlier. However, that outperformance was still slightly below the median since Jan 2009 (+163K) and well below 2022-2023 deltas. Services dominated with +86K in Aug with Government at +35K, comprising +121K of the +162K. The remaining +41K was in Goods with more than half (+22K) in Construction, which has been a winner MoM and YoY on the AI ecosystem boom. We include some subsector lines in construction detailing material moves higher (Nonresidential) and some lower (Residential).
A key point to consider is any weakness in the blank check tariff sales pitch where tariffs alone bring their own reward. The stated goal of reshoring and attracting capital investment back to the US is sometimes complicated by the reality that a project needs to be “economically viable.” Reduced price competition can also lead to domestic producers simply raising prices. Bricks and mortar commitments whether greenfield or brownfield have to consider that the “next guy” could radically overhaul trade policies when such reshoring or new capacity can take years to complete.
Services payroll totaled 114.2 million, dwarfing Goods at a 21.6 million headcount. Within Goods, we see Construction at 8.4 million in total payroll and Manufacturing at 12.6 million. Manufacturing includes Durables at 7.9 million and Nondurables at 4.7 million. We do not address Mining and Logging here with its headcount of only 609K heads (“mining” includes E&P, coal, metals).
Durables captures attention given the multiplier effects from materials and supplier chain tiers into finished goods that can also bring more headcount in services across freight and logistics, retail (dealers) and financial services (wholesale/retail financing, insurance, etc.).
The table is self-explanatory (what’s up or down MoM and YoY), but we highlight the material difference between Durables over the past year at +72K vs. Nondurables at -49K.
The fact that Motor Vehicles jobs (963K total payroll Aug 2026) contracted YoY might surprise, and the latest autos and parts total payroll number is also below the end of 2024. Furniture is a smaller line (331K) that has gained a lot of tariff attention, and that was lower YoY and below year end 2024. Even if higher YoY, Machinery (1.09 million) is below Dec 2024.
In Nondurables, the tariffs on such line items as Apparel have not translated into more jobs any more than textiles. These are two areas where low-cost labor is the main story line (notably in Asia). The Apparel payrolls decreased while prices rose. Food Manufacturing stands out as a setback at -20.4K YoY. Food prices are rising with the potential for more of the same ahead with a diesel crisis underway and labor costs remaining a wildcard in the agricultural space with the deportation waves. It is never simple even if some pretend it is.
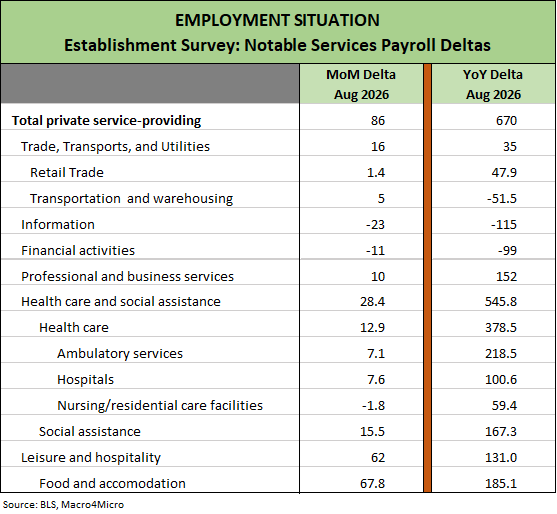
The moving parts of the Services payrolls tend to dominate the headline deltas with “Health Care and Social Assistance” and “Leisure and Hospitality” the more active lines each month. The health care lines are diverse by subsector as detailed in the table. The social assistance line is heavily about demographics. The growth in headcount mirrors the massive role in the US economy with health care related industries totaling around 18% of GDP. There are parts of the health care growth story that can have huge multiplier effects across the supplier base and others that do not but instead are more personnel intensive.
For Hospitality and Leisure, “Food and Accommodation” dominates with +185.1K YoY. Within that broader mix, the “Food Services and Drinking Places” line (12.4 million total payroll) was +59.2K on the month and +181.8K YoY. Within the broader Leisure line items, we see “Arts, entertainment and recreation” lower by -6.3K MoM and -53.8K YoY on a total payroll base of 2.65 million.
Among notable declines in Services lines was “Information” at -23K MoM and -115K YoY. Financial activities was down -11K MoM and -99K YoY. Within the Financial bucket, Insurance carriers and related activities were down by -6.3K MoM and -75.4K YoY.
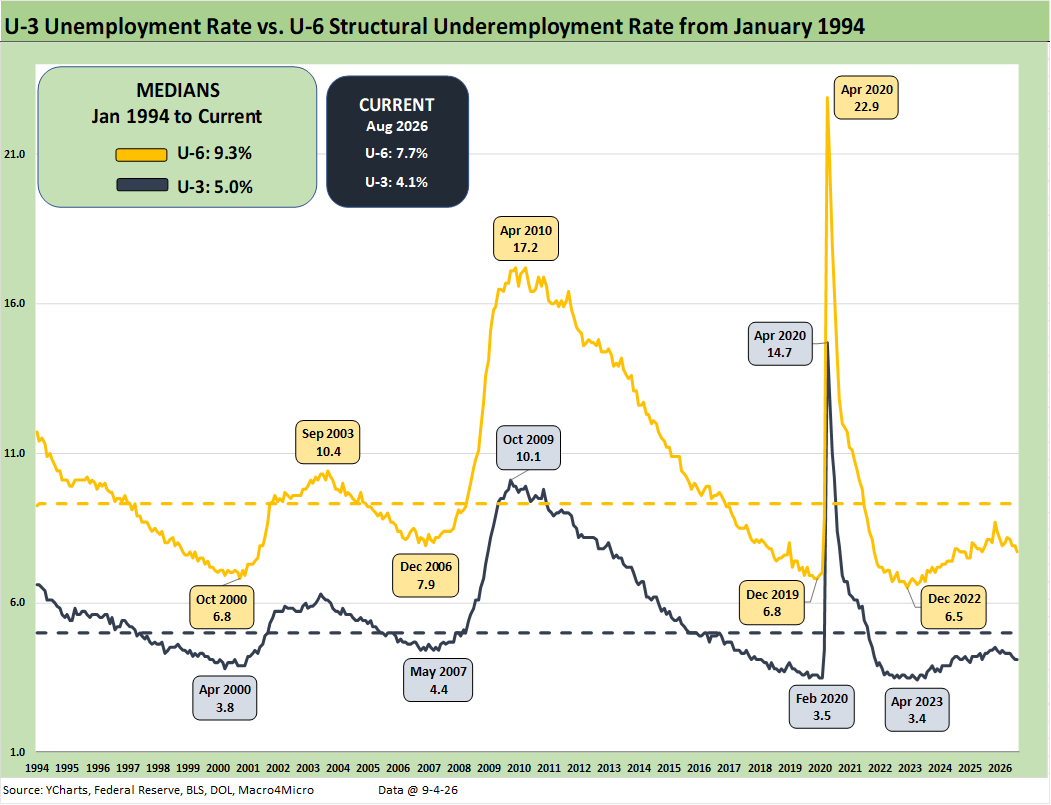
The jobs deltas saw the U-3 slightly above the 4.1% line (4.14%). The U-6 posted a favorable decline in August to 7.7% from 7.9%. That compares favorably to the 8.1% of August 2025 for a -0.4 YoY decline.
As a reminder, the U-6 metric is defined with the numerator as “total unemployed + persons marginally attached to the labor force + total employed part time for economic reasons.” The denominator is “civilian labor force + workers marginally attached to the labor force.”
As we covered earlier in the YoY deltas and the Household Survey data, the civilian labor force is down sharply YoY with the category of “not in labor force” spiking during 2026 but declining sequentially in August by -551K to 105.6 million from 106.2 million in July. “Not in labor force” can be as simple as someone who wants a job but is not actively looking. The turmoil in the tech services headcounts of late and downsizing of government departments are easy ways to envision why this trend has been unfolding in 2026.
The U-6 is the structural underemployment metric that is always useful to watch. To start 2025, the U-6 rose sharply in Feb 2025 to 8.0% from 7.5% in Jan 2025. The U-6 jumped to 8.7% in Nov 2025 from 8.1% in Sept 2025.
The current 7.7% marks a decline from 8.1% in May and 8.2% in April. That is good news. However, the current U-6 remains well above the 6% handles seen in spring of 2023. The U-6 is still below the median from 1994 of +9.3%, which notably includes the post-crisis shock and the longest recession since the Great Depression.
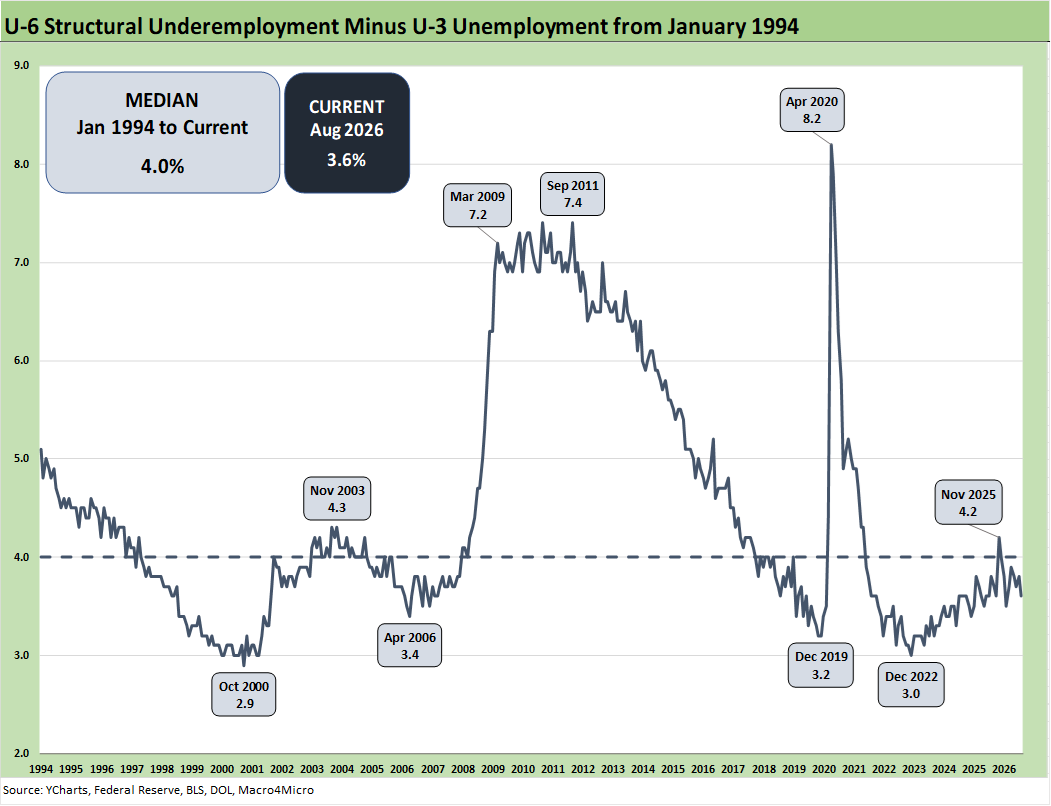
The time series above updates the U-6 minus U-3 differential as a measure of relative employment quality and to flag risks of major dislocations in large swaths of the economy (think oil patch collapse in the late 1980s, tech bubble imploding into a weak 2001-2003, and financial services and automotive meltdowns in 2009).
The current 3.6% differential is below the long-term median of 4.0%. The job ranks are still vulnerable now with stubbornly uncertain and erratic developments in Iran and apparent interest from Trump to make more reckless trade attacks including threatening this week to end all trade with all trade partners posting a surplus. That was crazier than usual (even for Trump) since that target list includes all the largest trading partners and a material majority of the Top 20. Such a radical action would in theory generate some major problems in planning payrolls and would lead to mass layoffs.
The anxiety around where the UST curve, energy costs, and raw materials go from here remains high in terms of the impact on working capital cost inputs and employer decisions. The feedstock costs have been ugly until the recent adjustments in more than just oil. Iran peace promises are often heard as settled, but “it ain’t over ‘til it’s over” clearly applies. The housing sector remains quite vulnerable to any UST steepening risk. The recent return to exchanging fire in the Strait continues the on-again/off-again pattern.
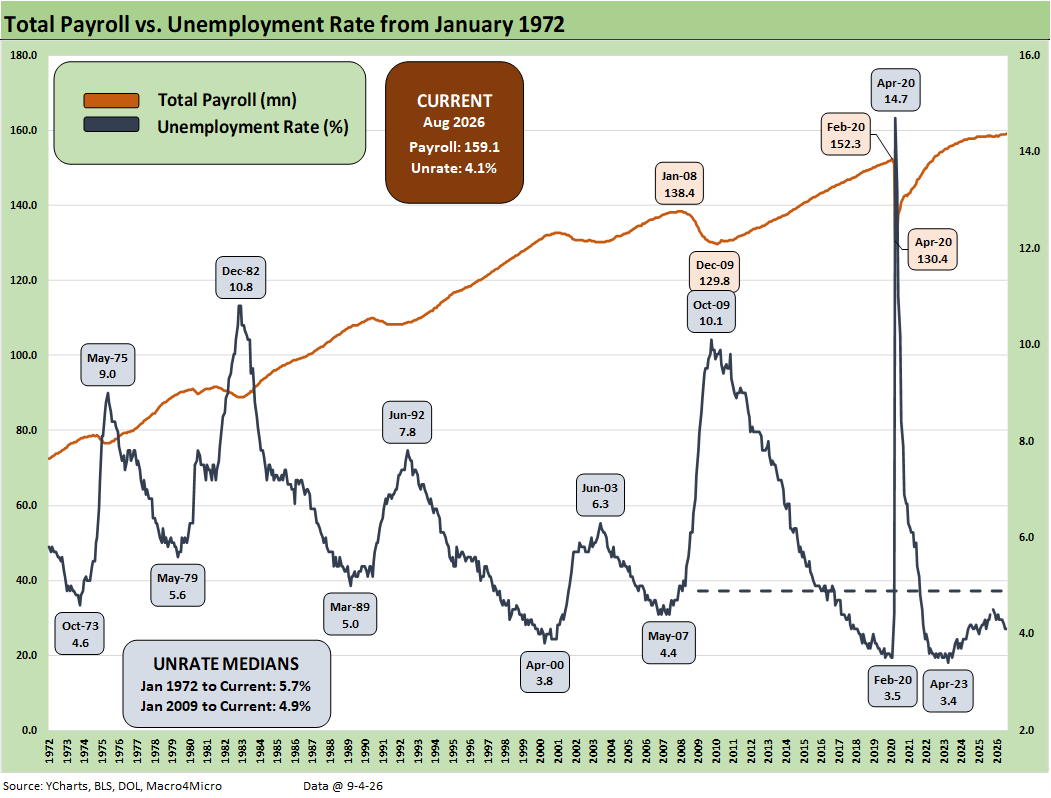
The above chart updates total payroll vs. the unemployment rate. The trend needle has not moved much in 2026 and has been in a narrow range. More bodies with more paychecks are always a good thing. Meanwhile, the Household Survey data pushes back on the Establishment Survey with the direction of total employed heads.
The trick from here is how the consumer deploys their paychecks and whether the zero-sum realities of household budgets undercut spending. The PCE line in the GDP accounts is a critical driver of growth and negative real wage growth is not a tailwind. In reality, poor household earnings growth can be a leading indicator for spending or wage demand pressure.
PCE growth represents 68% of GDP, so the improvement in 2Q26 GDP after a very weak 1Q26 GDP offered some tangible cyclical relief (see 2Q26 GDP: Good Underlying Numbers Despite Headline 1.5% 7-30-26, GDP 1Q26 Final: PCE Growth Plunge 6-25-26). We also saw constructive PCE income and outlays numbers in the July PCE release with income outpacing consumption (see PCE July 2026: Mixed Consumption, Stubborn Inflation 8-26-26). Savings rates finally ticked higher, but questions remain on when (and whether) the consumer will get more defensive.
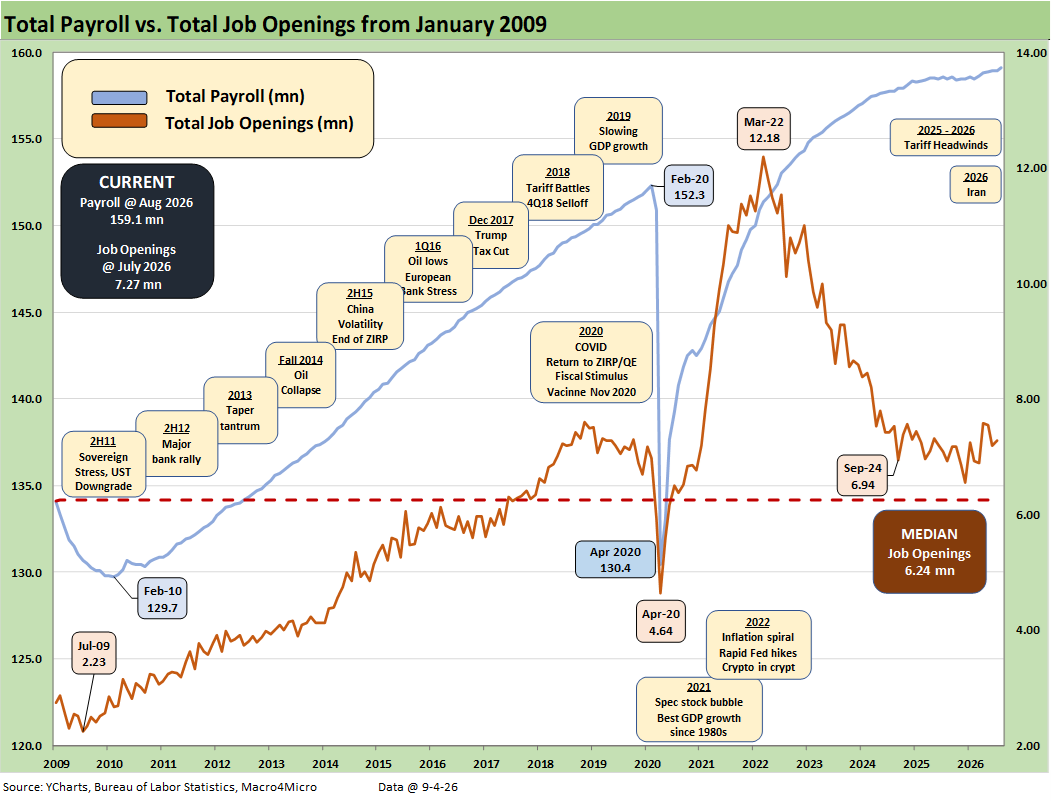
The above chart updates the total payroll numbers vs. job openings. Management teams have a lot of moving parts to factor into planning whether quantitative or qualitative before they fill the openings. The potential for a wave of new tariffs ahead with the USMCA demise (or replacement) and the escalating clash with Canada and potentially the EU are not incentives for employers to rush out and fill the job openings or to launch more initiatives where the economic inputs are in a state of flux.
The domestic political stress is likely to climb from here. The US is in an election year where political risk is rising to levels that the US has not seen since 1860. Election interference worries and the insane idea of having the incredibly inefficient Postal Service being a White House enforcement entity to undermine mail-in voting is getting into uncharted territory (in the US at least) even if Asia and European dictatorships have some templates across history.
Not enough people have looked at how complicated the Executive Order was in terms of its demands on the USPS even if the whole idea is brazenly unconstitutional and conflicts with the “Elections Clause” of the constitution (see The US as an Aspiring Emerging Market: Fiscal SNAFU, Political FUBAR 4-6-26).
The final IEEPA decision from SCOTUS came in against Trump, but he was prepared to start slapping on tariffs under Section 122, 232, and 301. More recently, Trump has unearthed a clause within the Smoot Hawley tariff legislation of 1930 using Section 338. When in doubt, a natural plan is to go to the Hoover playbook (that worked so well). Section 338 is a return to the blank check tariff policies of IEEPA with zero Congressional checks on the White House.
The near-term trade crisis is Canada with Trump’s Homeric ego a critical factor. The trade flows have been looked at in many past commentaries and the risks are obvious at this point (see Trade Deficits: The Moving Parts and Macro Goals Matter Most 6-24-26, Meanwhile…Back in Economics and Tariffs 3-2-26, US Trade with the World: Import-Export Mix 2-25-26). The US has a goods trade surplus with Canada ex-oil. Canada is also the leading export market for almost 3 dozen US states. Those states, including every central and northern swing state, might have something to say about the game plan reflected in midterm elections.
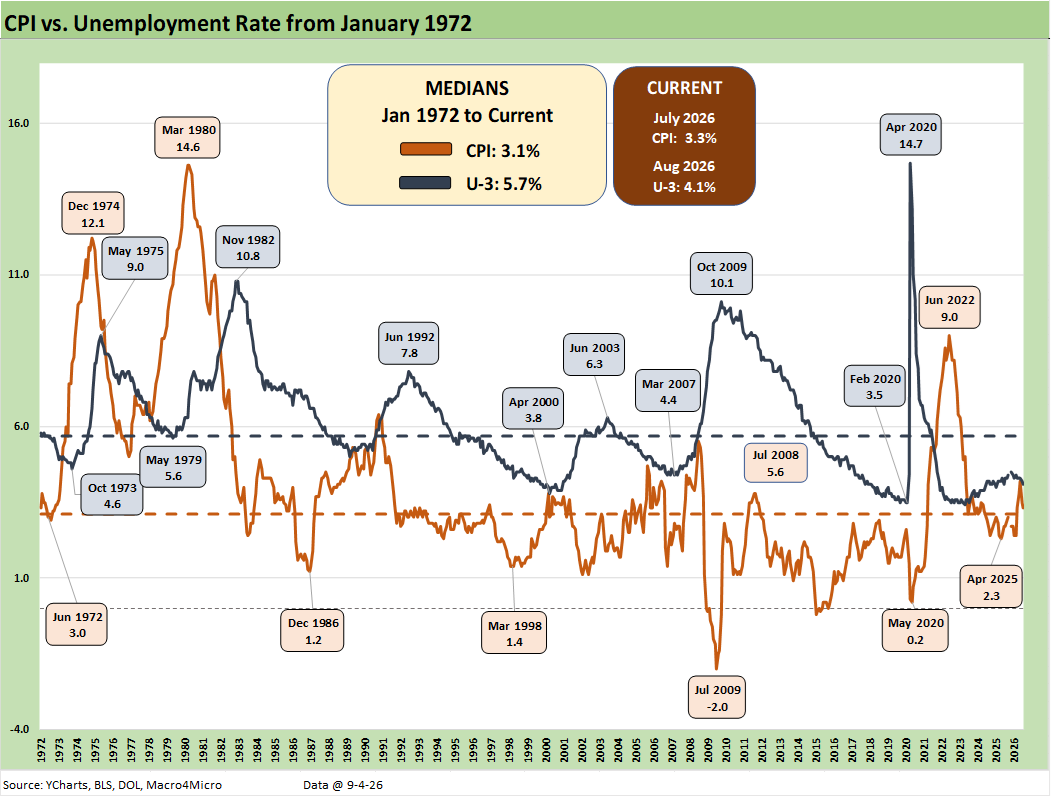
CPI vs. unemployment rate is plotted above. The big worry back in March as Iran escalated was fear of stagflation – something not seen since the 1980-1982 double dip under Volcker (except a brief touch of worry in fall 1990). That has subsided in recent weeks despite the stubbornly high inflation numbers. It would take a massive setback in US-Iran escalation risks to change the status quo, but the refined product crisis has recently eclipsed discussion of the Strait. At some point, China will ramp up buying oil on a grand scale again. This oil and refined product crisis is proving to have some legs.
The overall economic impact of tariffs has been far less than feared given the reality that most trade partners backed down in 2025. That said, the trade war with Canada in 2026 could lead to more disarray. A worsening backdrop will be tied to how key Provinces react and whether they hold their current steady-as-she-goes plans (i.e., no export taxes on oil or potash, etc. by Alberta and Saskatchewan).
The backdrop could still change in 2026 with the latest wave of Section 301 and Smoot Hawley 338 attacks on supplier chains and trading partners. There is always the chance that Trump might push Mexico too far and the same with the EU, where US relations are at a low. The worst case scenario in trade would be trade wars with the top 3 trading partners (EU, Canada, Mexico). Trump would keep on making money, but employers would need to revisit hiring and staffing plans.
See also:
Remembering Gloria Steinem 9-3-26
Market Commentary: Asset Returns 8-31-26
Market Commentary: The Curve 8-30-26
PCE July 2026: Mixed Consumption, Stubborn Inflation 8-26-26
2Q26 GDP: 2nd Estimate 8-26-26
New Home Sales July 2026 8-25-26
Market Commentary: The Curve 8-24-26
US-Canada: Benches Ready to Clear 8-22-26