UST Slope Update: Some New Inversion Highs
The inversion of 3M-5Y, 2Y-10Y, and 2Y-30Y justifiably draws attention, but the action is still at the fundamental level.
The UST curve has seen a dramatically more inverted curve since late Oct 2022 with the 2Y-10Y and 2Y-30 showing the most notable shift in slope.
The 3M-5Y has sharply inverted and since later October as the short end was tied more to the Fed tightening policy but the 5Y UST was taking signals from economic indicators and slightly better news on inflation.
Below I update where the UST inversions now stand after some weeks of new indicators, additional guidance from earnings season, and more “quality time” for the market listening to Chairman Powell and the many views of the FOMC members. Since the second half of October, the UST market has posted a lot more 3% handle UST yields in contrast to the low to mid 4% handles out the curve seen in October and early November (see High Speed Inversions Gain Altitude). With the Fed in tightening mode and inflation still high relative to fed funds, the mix of UST moves has translated into material increases in inversions for 3M-5Y, 2Y-10Y and 2Y-30Y. The 3M-5Y was positive (upward sloping) into later October, but the UST yield decline dictated by the market told a different story on forward expectations.
We already ran through the main points of how I view these yield curve inversions and their predictive powers (see UST Curve: Slope Matters). My favorite is the 3M-5Y since it plays more to the idea of the opportunity costs of being in cash or the “penalty for cash” (see The Cash Question: 3M-5Y Yield and Slope). That penalty is much diminished and allowed for some investors to seek refuge from the mixed signals without getting ZIRP for their effort.
As detailed in these earlier commentaries, sometimes the UST curve can be predictive, but it is still more symptom than cause. It’s always better to flesh out the underlying cause driving the inversion in the first place. The timing of some of the past recessions already had the economic turmoil underway before or during the inversion. Sometimes the inversion did lead but there were still signs of trouble to detect (e.g., During 2006, residential investment was plunging, but the massive excess counterparty exposure was hidden).
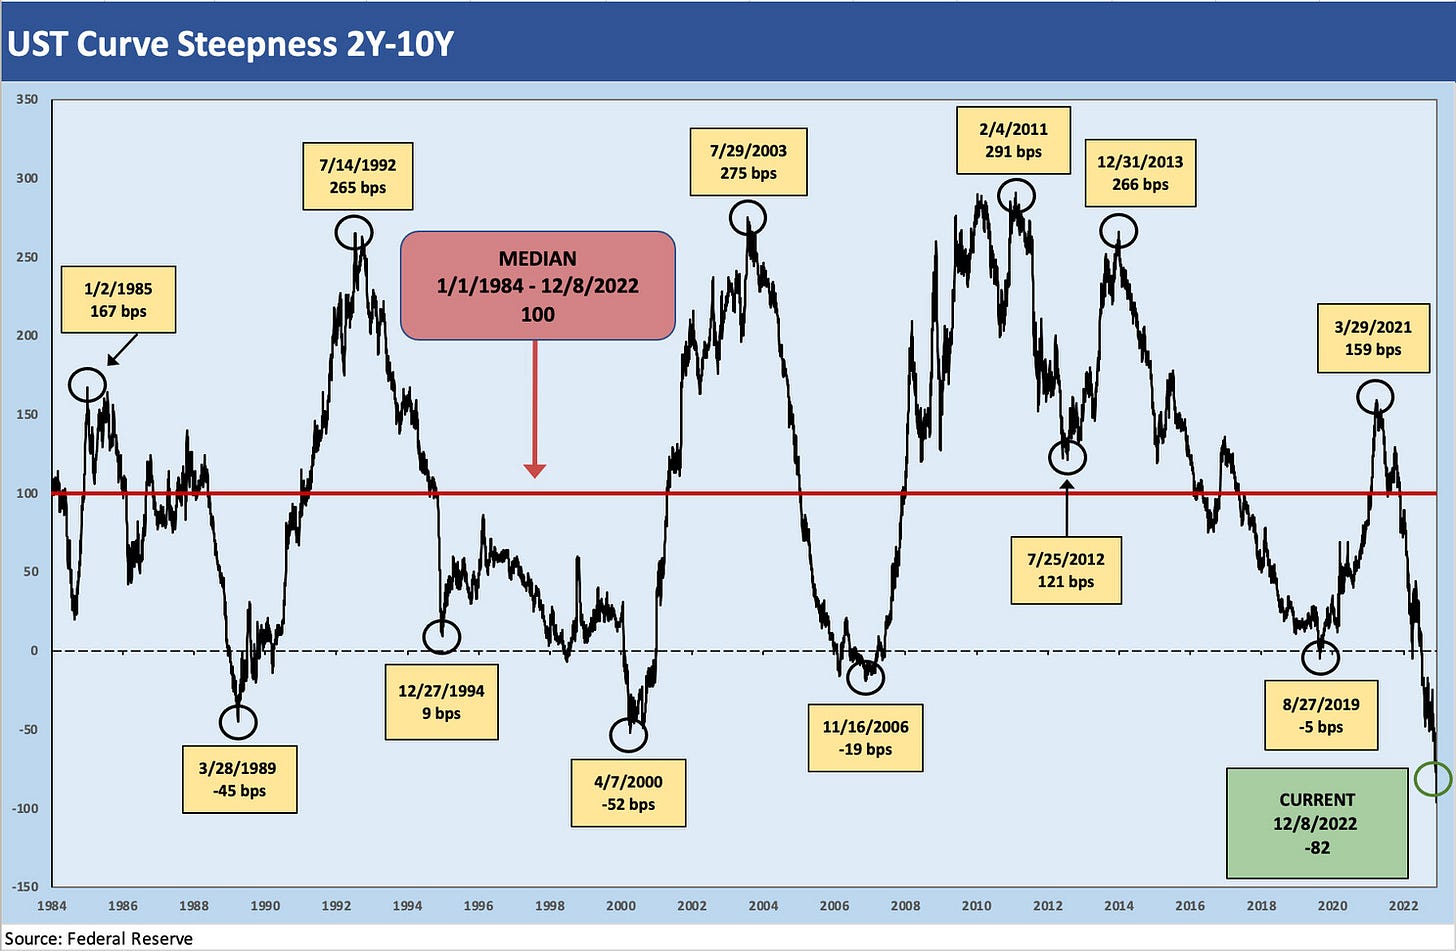
The 2Y-10Y makes a statement on inversion with the most inverted curve since the wild period of Volcker inflation fighting way back during the double dip recession period. As an example, the 2Y-10Y had hit -241 bps in 1980. The above chart covers the period from 1984, when the market had returned to some remote level of normalcy, through Dec 8, 2022 (end of day UST quotes). The -82 bps inversion this week stands out across the cycles covered.
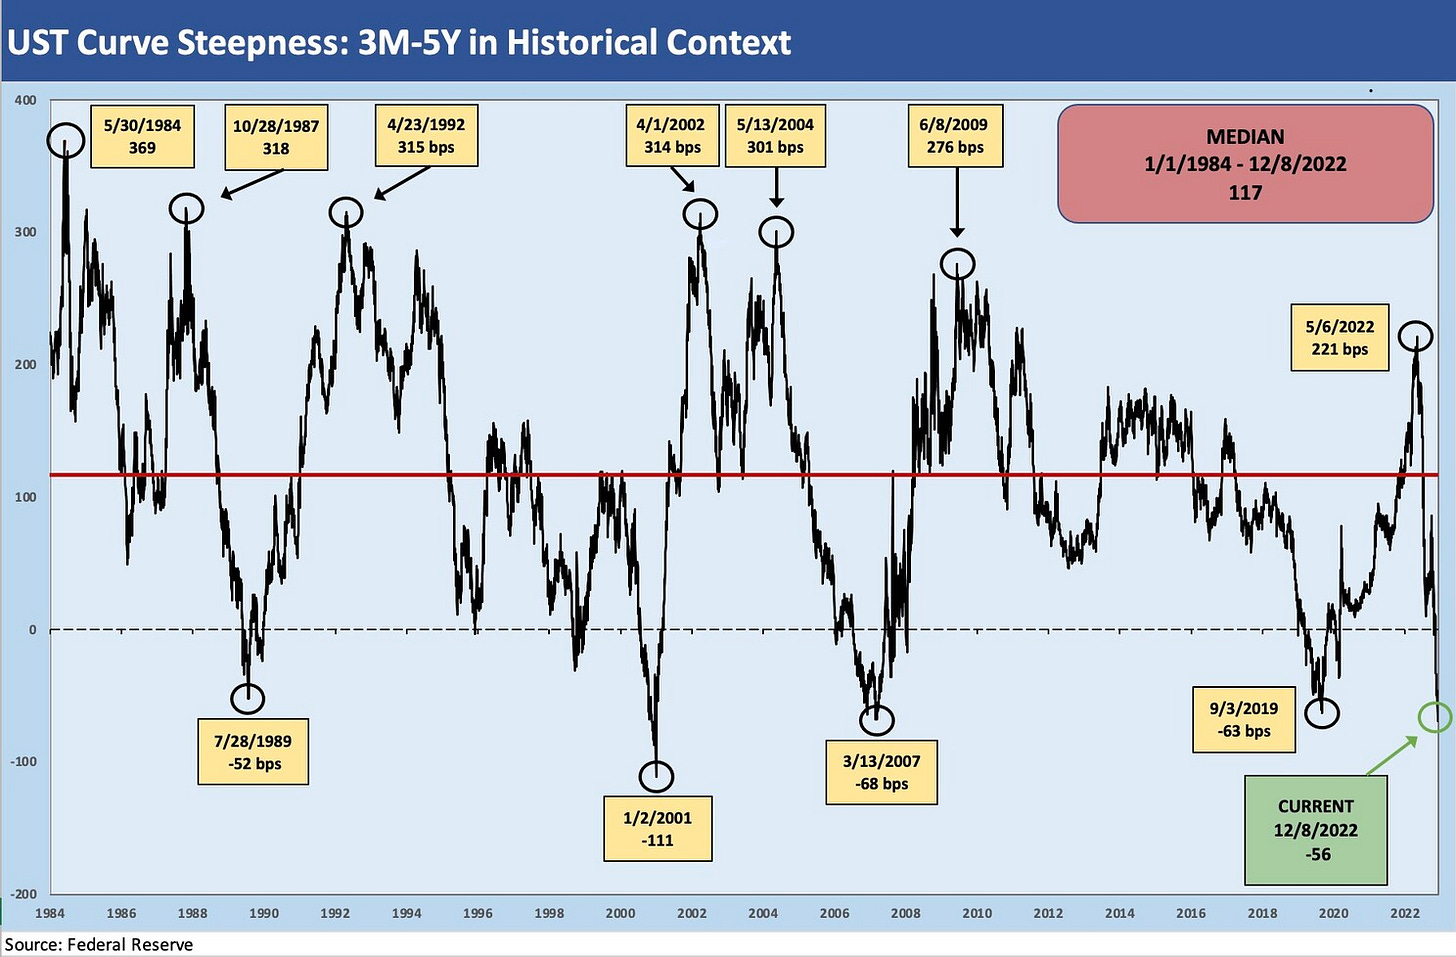
The above chart updates the 3M-5Y slope at -56 bps. That inversion is short of where the market was even earlier this week but well below the Jan 2001 highs of -111 bps across the timeline from 1984.
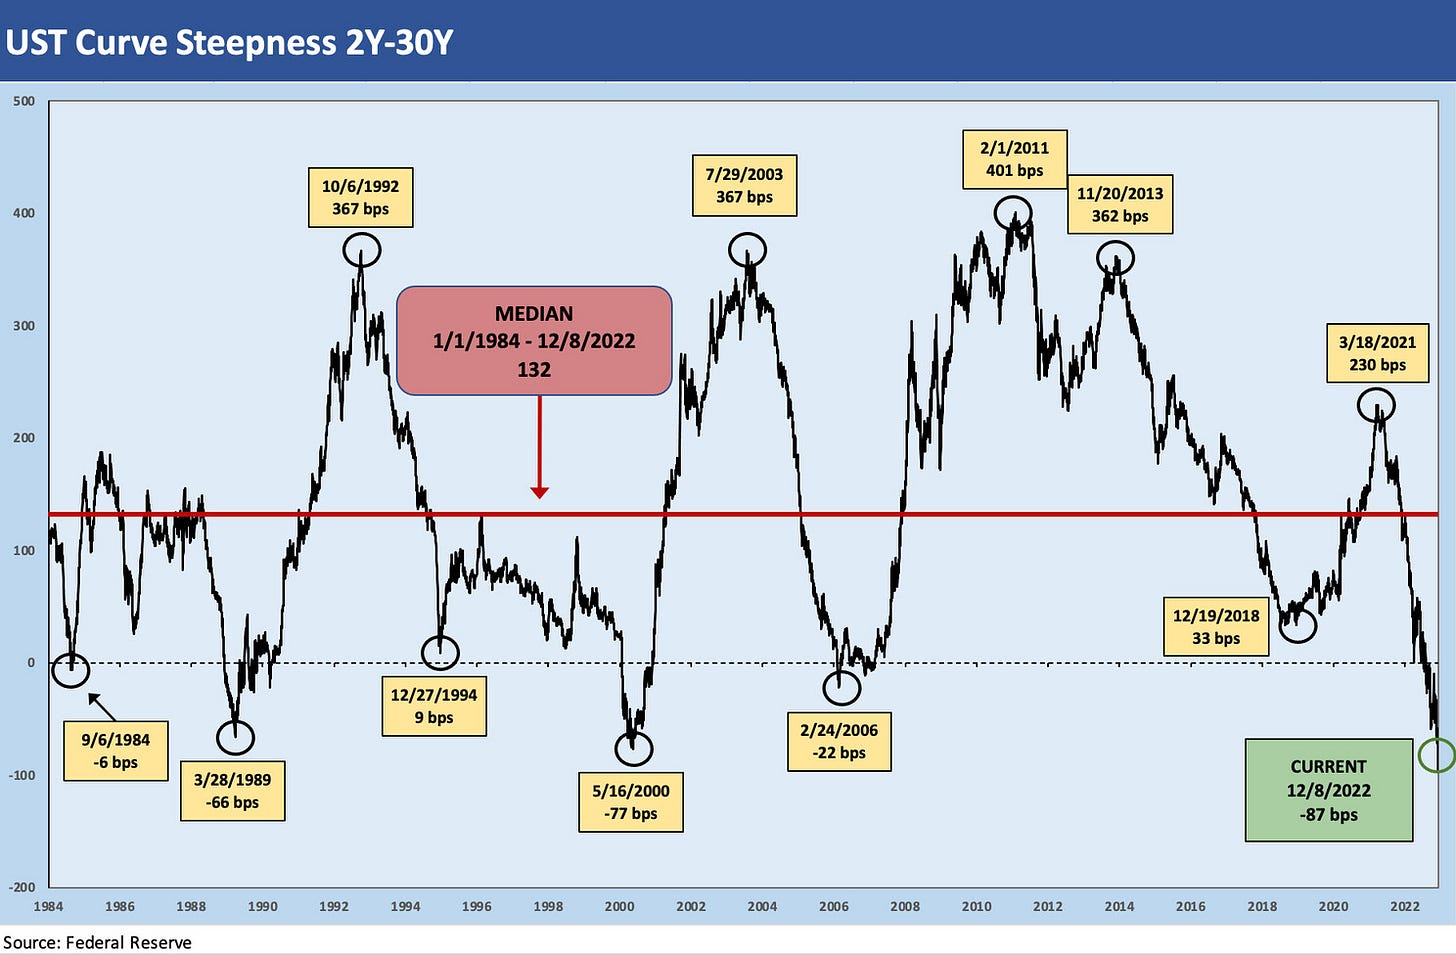
The current -87 bps inversion of 2Y-30Y stands out on the timeline and trumps the infamous inversions of May 2000 when long USTs were scarce in supply and US budgets were balanced. The 3% handles today on 5Y, 10Y, and 30Y are a notch down from the 4% handles of late October, early November.
Once again, I refer you to the longer commentaries for more on the UST inversion topics.


