


Jack, plant the tariff beans and GDP grows bigger and faster! 5% for sure!
A 1.5% headline for 2Q26 GDP, down from 2.1% in 1Q26, is not impressive by any stretch. We find reassurance in the stronger Personal Consumption Expenditure (PCE) growth, which was revised higher to 3.4% after an abysmal 1Q26 of 0.5% and 4Q25 of 1.9%. The headline PCE price index for the quarter was revised higher to +5.3% and Core PCE revised up to 3.6%.
For some context, that 3.4% PCE growth is one of two 3% handle PCE Growth quarters in Trump 2.0 (we saw 3.5% in 3Q25). During 2024 and Biden’s last year, PCE growth was 3.9% in 4Q24, 4.0% in 3Q24, and 3.9% in 2Q24. The consumer made a comeback in 2Q26.
The dazzling fixed investment lines remain very impressive at +7.0% as noted in the charts and earlier GDP review. Nonresidential is driving the numbers even with a downward revision in Equipment to +13.6% while Intellectual Property Products was unchanged at +8.8%. Those two dwarf a weak Structures line at -1.8%. Residential was revised down by -0.2% to +1.3%.
The multiplier effects of the AI boom across so many industries (durables and services) are carrying the ball for the economy broadly as highlighted in the 2Q26 Corporate Profits schedule release along with the GDP.
We would argue it takes a string of 4% and 5% headline PCE growth rates to make a “Golden Year” (let alone a “Golden Age”). We have had them in the past, but “this ain’t it.” Clinton and Reagan had more than a few Golden years (see Presidential GDP Dance Off: Clinton vs. Trump 7-27-24, Presidential GDP Dance Off: Reagan vs. Trump 7-27-24).
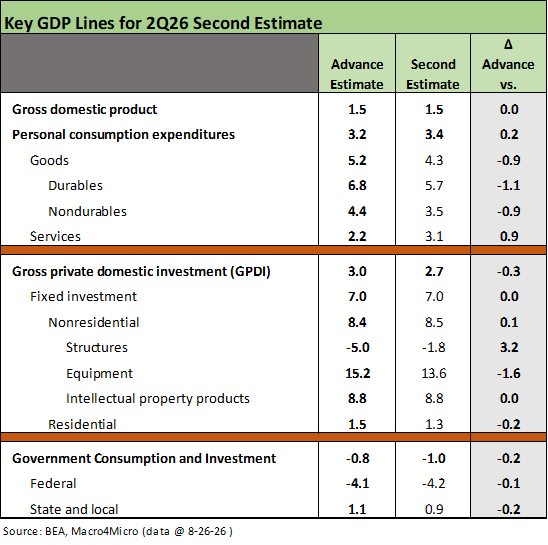
The above chart updates the GDP line item deltas to reflect the 2nd estimate for 2Q26. We covered the main events in the bullets on PCE and Fixed Investment, but Government also continues its decline with a -1.0% 2Q26 and a -0.2% adjustment from the advance estimate.
For the usual “distortions” that we highlight each quarter, the “change in private inventories” contribution shaved -0.72% off the headline GDP while the trade deficit delta reduced GDP by another -1.14%.
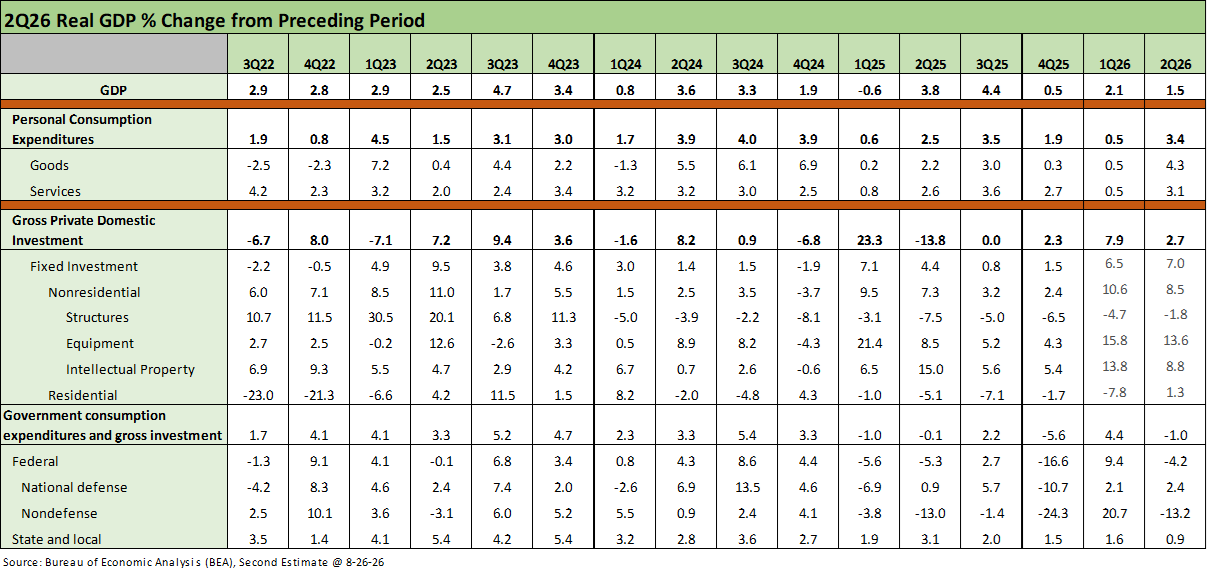
The GDP timeline above tells a story of slower growth than past cycles but also a mix of line items that highlight the fixed investment boom as well as the dramatic swings in inventory and trade deficit impacts in the interim quarters of 2025 as working capital management was dramatically distorted by tariff phase-ins (see 3Q25 GDP: Morning After Variables to Ponder 12-27-25, 2Q25 GDP: Second Estimate, Updated Distortion Lines 8-28-25, 1Q25 GDP Advance Estimate: Roll Your Own Distortions 4-30-25).
When the smoke cleared on 2025, the annual GDP rate was 2.1% vs. 2.8% in 2024. The 2.1% GDP growth of 2025 was the lowest annual GDP growth since -2.1% in 2020 and +1.8% in 2016. Those are the facts from the BEA.
The challenge in 3Q26 and 4Q26 is to generate a 3.0% handle year despite the tariffs, Iran War fallout, and higher UST rates driven in part by inflation and the pressure of massive deficits and other-worldly UST supply. A 3.0% annual GDP growth rate would not be a Golden Year but would be a well-polished and useful Pewter Year for the next leg of the AI journey. Fewer trade wars and shooting wars would help.
See also:
GDP 1Q26 Final: PCE Growth Plunge 6-25-26
GDP 1Q26 Second Estimate: Shrunk in the Dryer 5-28-26
1Q26 GDP Advance Estimate: Consumer Fade, Investment Boom 4-30-26
4Q25 GDP: More Adverse Revisions in the Golden Year 4-9-26
Some “distortion” stories of past GDP reports:
3Q25 GDP: Morning After Variables to Ponder 12-27-25
2Q25 GDP: Second Estimate, Updated Distortion Lines 8-28-25
2Q25 GDP: First Cut of Another Distorted Quarter 7-30-25
1Q25 GDP Advance Estimate: Roll Your Own Distortions 4-30-25