

I grant you 3 wishes to destroy the global economy!
We look at total returns for a few benchmark bond ETFs from March 2022 through Friday close. We use SHY vs. GOVT vs. TLT in a stark look at duration effect differentials.
“LOWER THE RATE OR I’LL STOP TRADING WITH COUNTRIES WITH WHICH WE HAVE A DEFICIT…” (Trump’s all caps) is yet another “threat post” by Trump. This one is aimed at the Fed and takes crazy to the next level while shredding most basic economic policy concepts.
The door opens to more scenarios than one wants to ponder. The range of potentially damaging outcomes are daunting.
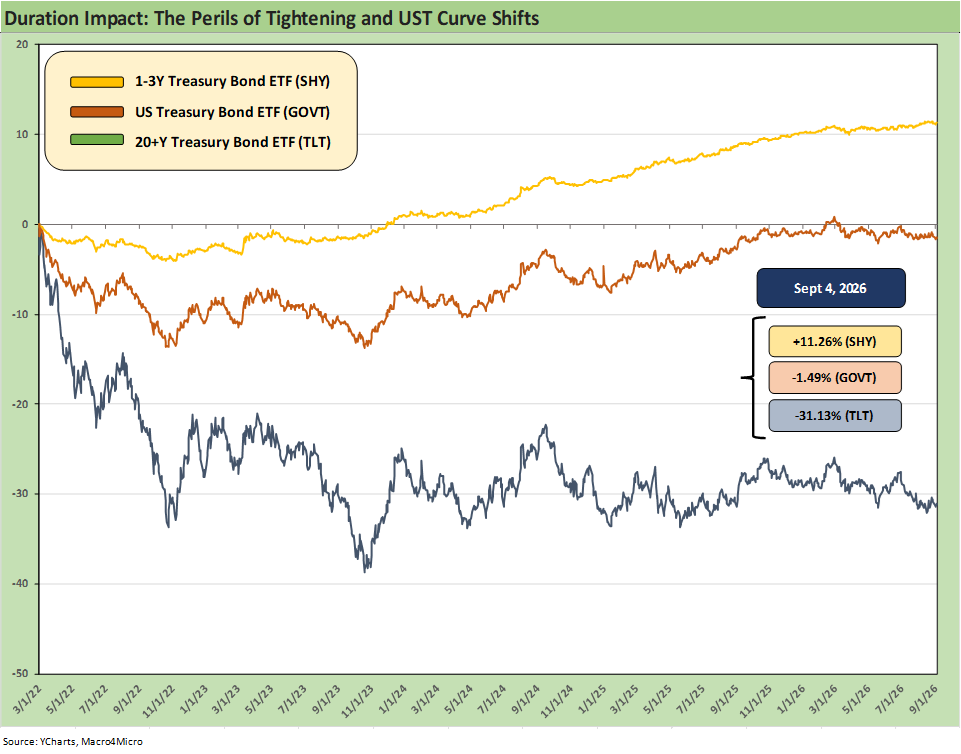
The chart plots the total returns since the beginning of March 2022 for 3 benchmark UST ETFs. Duration getting punished during that period is certainly not a mystery, but trying to guess the differentials prompted me to plot the chart. Such periods are always worth quantifying.
It is a simple exercise framing short-term UST bonds (using SHY, the 1-3Y UST ETF) with its current 1.85 years duration vs. intermediate term government exposure (using GOVT, the UST ETF) with its 5.58 years duration, and the long duration UST using (TLT, the 20+Y UST ETF) with 14.8 yrs duration as of Sept 2026.
The -31.1% total return on TLT is an eye grabber vs. -1.5% on GOVT and positive returns on SHY at +11.3%. With worries around a potential steepening or upward shift in the UST curve under more than a few scenarios, the pressure to stay short to intermediate remains compelling unless there is a strong view that oil tanks (it might), the FOMC eases, consumers stall, and the economic cycle slows.
Anyone who has been around oil forecasts since the early 1980s has seen the streets littered with high conviction calls on oil prices. The only certainty appears to be that the national debt will keep on climbing, tariffs are more likely to get worse before they get better, and that Trump’s hostile and broadly Neanderthal approach to geopolitics will lead to fewer international buyers of UST.
The journey of the UST curve across the rounds of ZIRP starting with the credit crisis in late 2008, across a muted, relatively brief normalization period into 2018, some fresh easing in 2019, and the return to ZIRP with COVID is a story for the ages in capital markets history. With the world now back in what the “1980s/1990s crowd” might call “normal” the UST returns from the post-ZIRP period from March 2022 above offer food for thought while asset allocators assess the range of potential outcomes ahead. That has a lot of moving parts.
And now for something completely different…
The word “unusual” is the world’s most understated way to describe the combination of current fiscal policy, trade policy, and even potential monetary policy. The threat this past week to cancel trade to coerce the FOMC is not getting enough coverage for how disconnected that threat is from reality and basic economics.
The quote below (note: all-caps are Trump’s) is hard to misinterpret:
“LOWER THE RATE OR I’LL STOP TRADING WITH COUNTRIES WITH WHICH WE HAVE A DEFICIT…” - Trump (Truth Social 9-4-26)
It is notable how little coverage was given to those words in the financial media channels (print and cable etc.) who do not want to offend Trump by highlighting his own words (thus embarrassing him) and venturing a guess on what he might be thinking. It is an easy call of “BS.” After all, there is no good explanation that does not insult the President even as his sheep herd says nothing about it.
Anyone can easily see a wide range of scenarios that could unfold in retaliation by trade partners. The most obvious is to withhold critical supplies or slap high export taxes on them. Multiyear projects and order books could be canceled. The “One China” policy could simply lead China to say, “If you won’t trade with me, I am canceling exports from Taiwan, which we now control 100% of.” Goodbye stock market and AI ecosystem valuations.
These are all extreme and doubtful scenarios, but just reread the all-caps threat from Trump and he brings them all to life. He links trade deficits with the fed funds rate. Over the weekend he started in on currencies so “here we go again” (to quote Reagan).
The “oldie but goodie” counter from trade partners is a buyers’ strike on UST (just let the maturities roll off) or sell down some positions on the long end to rattle the UST curve. Remember the regional bank crisis in March 2023 and all those increased losses on long-dated UST bonds? (See Regional Banks: The Credit Crisis Contraction Theme 5-7-23, Banks and Macro Nerves: When Regional Becomes National 3-19-23).
A first grader would see the risk of higher UST rates and inflation risk in Trump’s trade plan/threats. Supply-demand imbalances were one of the main drivers in 2021-2022 along with the Russian-driven energy spike. Massive disruptions in production chains today on the threats would be the reality far and wide in the US. Retail shelves would head toward empty as we already saw with China. It offers a reminder that Trump has learned very little since Trump 1.0.
See also:
UST Market: Curve Meets Knuckler 9-7-26
Payroll Aug 2026: Trouncing Low Expectations is “Positive” with an Asterisk 9-5-26
Market Commentary: Asset Returns 8-31-26
Market Commentary: The Curve 8-30-26
PCE July 2026: Mixed Consumption, Stubborn Inflation 8-26-26
2Q26 GDP: 2nd Estimate 8-26-26
New Home Sales July 2026 8-25-26
US-Canada: Benches Ready to Clear 8-22-26