

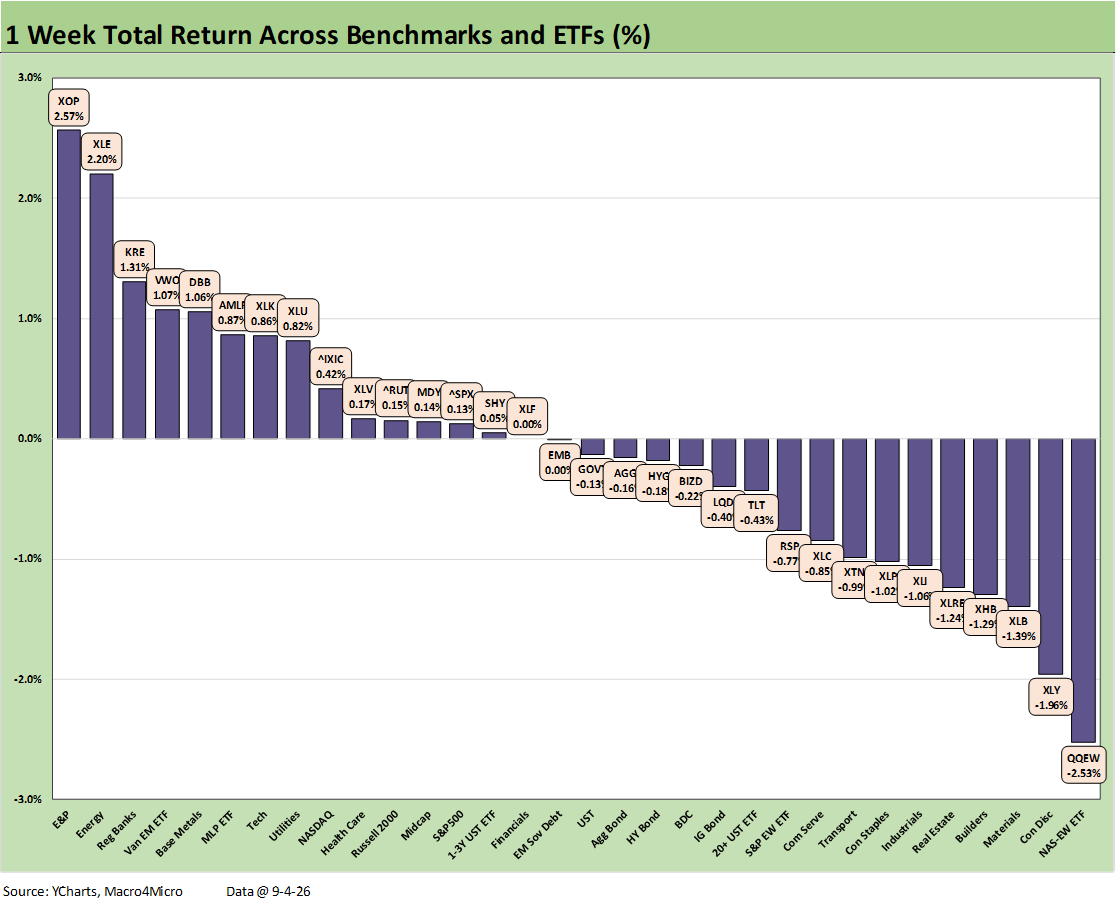
The chart updates weekly returns on the 32 benchmarks and ETFs we monitor. The positive negative score of 15-17 this week shows some balance but with 6 of 7 bond ETFs in the red. The 4 major benchmarks (NASDAQ, S&P 500, Russell 2000, Midcaps) were concentrated in the 2nd quartile as the UST curve posted a modest bear steepener (see separate post on the UST curve). The S&P 500 saw the 11 sectors split at 6 negative 4 positive, and one flat.
We see the three energy ETFs in the top tier again with the latest Iran escalation activity and new round of threats. E&P (XOP) was #1 and Energy (XLE) was #2 with Midstream (AMLP) also in the top quartile. WTI rose to $91.48 by the Friday close ($92.70 Labor Day) from $83.40 the prior Friday. Refined products stayed under extreme pressure with diesel hitting a record for Labor Day. That is bad for household discretionary cash flow and bad for inflation expectations.
The tech picture was mixed with the Tech ETF (XLK) making the top quartile on some strong rallies from the AI ecosystem and Semiconductors. We look at our Tech Check list of returns in a separate commentary, but the short form version is the Semiconductor ETF (SOXX) posted a +2.2% week and was ahead of the Software ETF (IGV) at -4.5%. The concentration of the major tech names winning is evident in the Tech ETF (XLK) in the top quartile while the Equal Weight NASDAQ 100 (QQEW) placed in dead last in the group of 32.
Financials held in well with the Regional Bank ETF (KRE) in the top tier and broad Financials (XLF) in the second tier. The recently resilient BDC ETF (BIZD) was in the middle of the third tier with a slight negative. Higher short rates could generate more income for some of the underlying private credit loans but also put more debt service stress on the more troubled exposures.
This week brings CPI and PPI, and that will potentially be a swing factor after the surprisingly strong payroll number (“strong” vs. expectations – not in absolute terms). The FOMC is still about votes and not who Trump dials up every week. We covered the payroll story separately, and the 162K in job additions was slightly below the median line from Jan 2009 and well below typical 2022-2023 run rates. It was a bit overhyped in broader context and the quality of the mix, which we break out in detail separately.
See also:
Duration Daze: Post-ZIRP Bond Returns 9-7-26
UST Market: Curve Meets Knuckler 9-7-26
Payroll Aug 2026: Trouncing Low Expectations is “Positive” with an Asterisk 9-5-26
Market Commentary: The Curve 8-30-26
PCE July 2026: Mixed Consumption, Stubborn Inflation 8-26-26
2Q26 GDP: 2nd Estimate 8-26-26