


Time for an FOMC cut? No pressure from Trump.
The reality of the PPI release line items and the fresh release of inflation variables is that the bottom-up cost line items remain stacked against the weak attempts at political jawboning and trying to paint a positive picture on inflation.
Energy PPI at 24.4% YoY and 4.2% sequentially MoM for August comes before the recent September setbacks with WTI at $102 per bbl as we go to print and diesel in a spike at a national average of $5.98 across a wide range.
The CME FedWatch odds for a Sept hike stands at over 71% today and the 10Y UST at 4.95% is whispering to the Oct 2023 closing high of 4.99% even as Mortgage News Daily survey crosses into a 7% handle just under 7.1%.
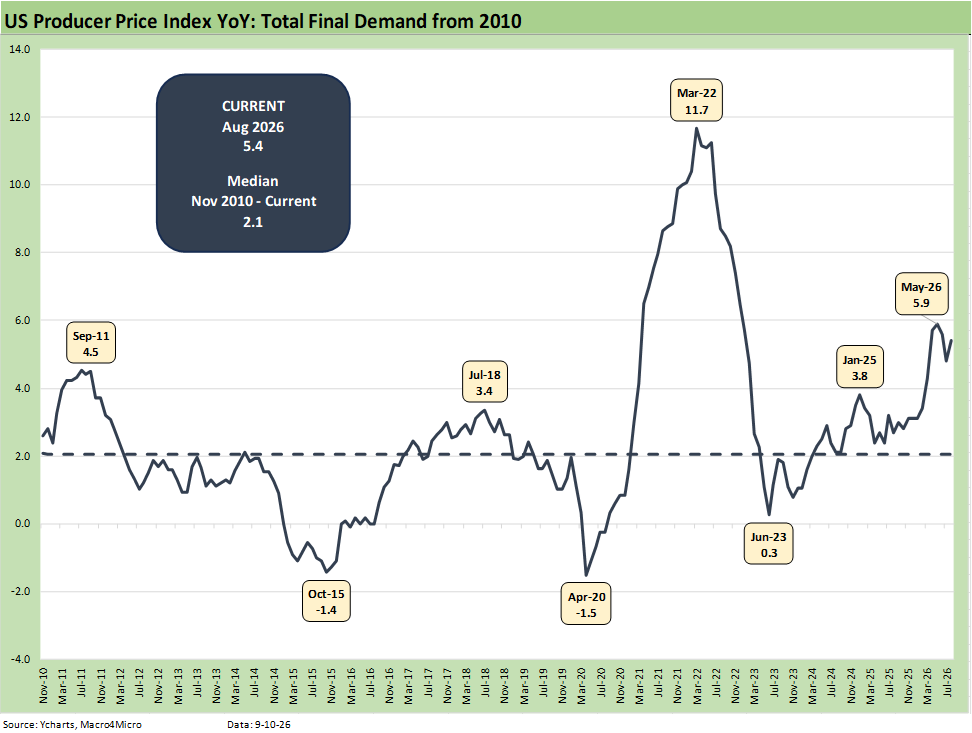
We update the timeline for the Producer Price Index Final Demand. The numbers are most certainly not supportive of the “What? Me Worry?” sales pitch from Trump and Vance.
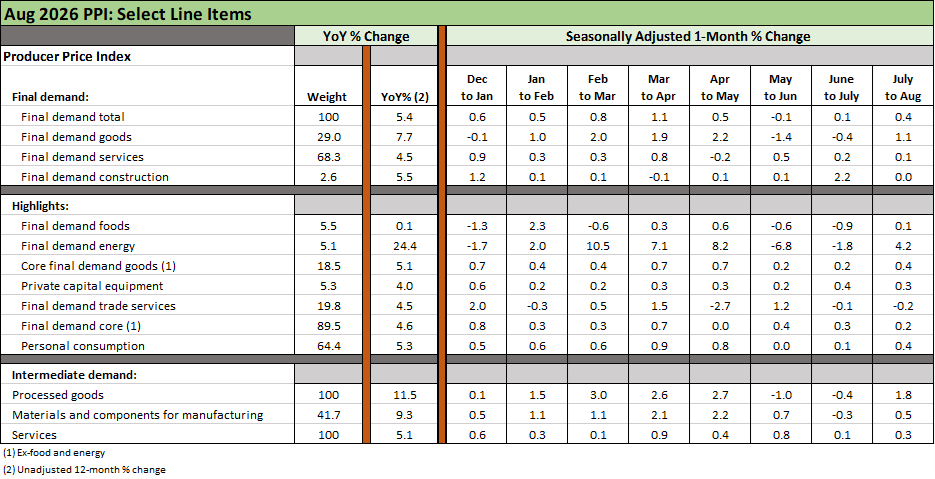
The above table breaks out some of the important PPI metrics that we monitor plus a few smaller line items we like to watch (Construction, Private Capital Equipment). The PPI release provides an extensive and lengthy range of metrics across over 20 pages in the release tables.
The YoY % column offers little support for optimism if you just scan down the list.
The “Final demand” goods” at +7.7%” and “Final demand services” at +4.5% reassures that everything is fine except for goods and services. Bessent must feel better already. Same for Hassett.
Some major “intermediate demand” lines are not reassuring with 11.5% on “processed goods” and 9.3% on “materials and components for manufacturing.” These are tough numbers to feel good about beyond a narrow audience of somnambulists wearing red hats.
See also:
Weekly Tech Check: Semis vs. Software Push-Pull 9-7-26
Weekly Returns: Benchmarks and ETFs 9-7-26
Duration Daze: Post-ZIRP Bond Returns 9-7-26
UST Market: Curve Meets Knuckler 9-7-26
Payroll Aug 2026: Trouncing Low Expectations is “Positive” with an Asterisk 9-5-26
Market Commentary: The Curve 8-30-26
PCE July 2026: Mixed Consumption, Stubborn Inflation 8-26-26
2Q26 GDP: 2nd Estimate 8-26-26