

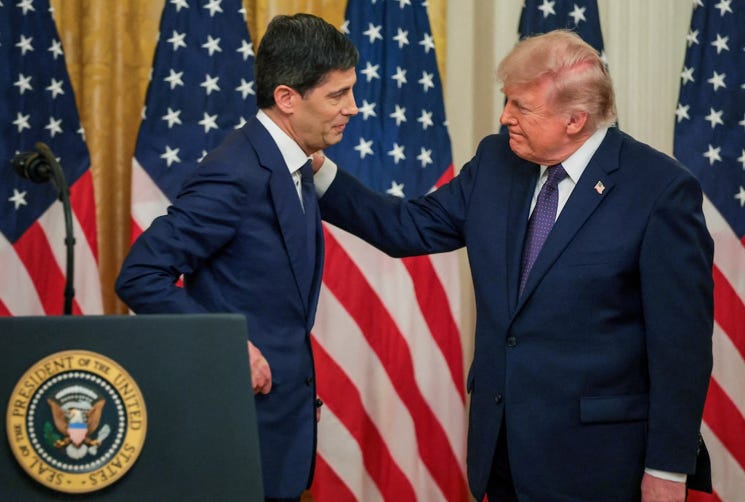
I know where you live new guy…
Warsh gained a lot of credibility with the markets this time around just by simply locking in on the incredibly obvious reality that the country has an inflation problem where the FOMC needs to play its role. It was a low bar to clear to state inflation is a priority, but it was being questioned whether he would clear that bar given Trump’s pressure.
The market reacted with a material increase in the odds of a Sept FOMC hike rising to 59.7% as we go to print, up from 39.9% 1 week ago. For the later Dec 2026 FOMC target, the odds of no change were down to 10.9% from 28.4% 1 week ago with the probability of 1 hike at 38.3% and 2 hikes at 40.1% (vs. 22.8% a week ago). The odds of 3 hikes by Dec 2026 stand at 10.7% vs. 3.5% a week ago. That was obviously a Jackson Hole speech the market believed.
The inflation inputs this week were negative with the July 2026 PCE price index flat YoY and showing no progress. The MoM lines were not helpful. The 2Q26 GDP release last week also updated the 2Q26 PCE inflation numbers (not to be confused with the July monthly PCE inflation rate) with both revised higher for the quarter (see PCE July 2026: Mixed Consumption, Stubborn Inflation 8-26-26, 2Q26 GDP: 2nd Estimate 8-26-26).
The housing sector has been feeling the pain from mortgage rates and rising costs in the building materials chain from tariffs. The week ended with the Mortgage News Daily Survey at 6.81%. Weak new home sales were reported last week that followed poor home start numbers the prior week (see New Home Sales July 2026 8-25-26, Housing Starts July 2026: Grim Numbers 8-18-26).
The comments below are a cut and paste from a weekend LinkedIn post with edits:
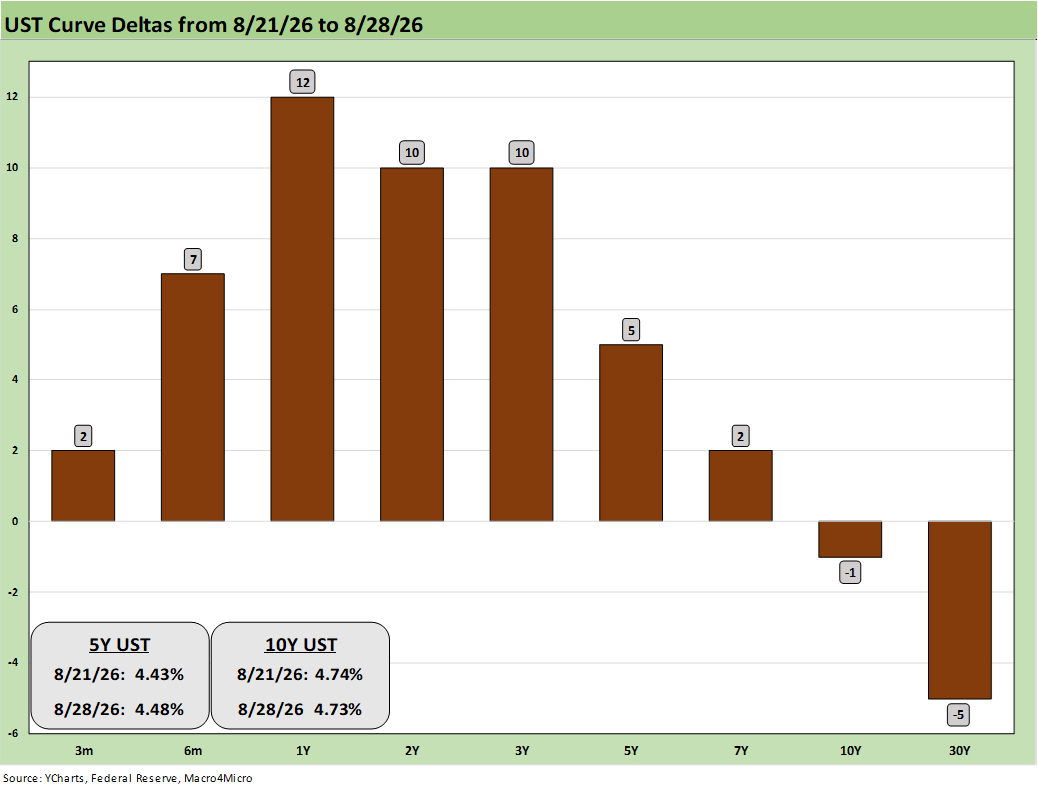
The chart breaks out the weekly UST deltas after a few busy days that included Warsh at Jackson Hole, a sharp drop in oil prices, and more UST curve crosscurrents with Bessent thinking he can play puppet master with the UST curve shape. We saw a mixed update on PCE inflation and income and outlays for July. The 2Q26 GDP release saw quarterly PCE inflation revised higher (by +0.2 bps) as PCE inflation rose to 5.3% headline and 3.6% core. For July alone, PCE inflation was flat at 3.7% headline and 3.3% core (see PCE July 2026: Mixed Consumption, Stubborn Inflation 8-26-26, 2Q26 GDP: 2nd Estimate 8-26-26).
The 1-week UST move was a bear flattener with the 2Y at +12 bps, 5Y at +5 bps, 10Y -1 bps, and 30Y -5 bps. The Friday move after Warsh’s morning speech flowed higher along the curve. For the day, the 2Y posted +12.8 bps, 5Y +9.5 bps, the 10Y +5.8 bps and 30Y UST only +2.2 bps.
The hands-down winner on UST impact was Warsh gaining more credibility with the market on his willingness to support tightening and perhaps even swinging more FOMC votes in that direction for a September FOMC tightening.
As noted in the bullets, FedWatch shows a material increase in the odds of Sept FOMC hike rising to 59.7% as we go to print, down from 39.9% 1 week ago. For the later Dec 2026 FOMC target, the odds of no change were down to 10.9% from 28.4% 1 week ago with the probability of 1 hike at 38.3% and 2 hikes at 40.1% (vs. 22.8% a week ago). The odds of 3 hikes by Dec 2026 stand at 10.7% vs. 3.5% a week ago. That was obviously a Jackson Hole speech the market believed.
The relatively brief Warsh speech did not include much (“Here is a quick overview of what I’ll cover in my remarks this morning. You can call it an outline . . . you can call it a trail map . . . just don’t call it forward guidance.”). The focus was an assertive commentary that more had to be done to get inflation down. That sold the market (for now) after reports of regular calls from Trump to Warsh raised fears of intimidation.
As covered in past commentaries, the cyclical risks of tightening during economic peaks can lead to major market setbacks. The durability of this current cycle gets framed around whether the AI ecosystem investment boom will trump the struggles of the consumer.
Consumers have proven more resilient in 2Q26 and the summer relative to where they started out in 1Q26 with weak PCE growth. Real wage growth has been straddling zero, and that is a wildcard for FOMC policy if wages join the product and services inflation and any pressure from a new wave of tariffs is felt with Canada trade war risks as Mexico is also teed up for USMCA review.
Inflation was stubborn in July for CPI and PCE and above target, and related AI multiplier effects and capex have supported the chain from materials to finished goods and myriad services. Fixed investment in Equipment and Intellectual Property Product lines in GDP drive that home. Construction, Freight and Logistics, and Financial Services have been beneficiaries. This is an unusual cycle from many different angles even if the consumer and lower part of the “K” are feeling pain. Housing is weak and will see costs rise as well even as mortgages are a headwind. Oil will remain the least predictable.
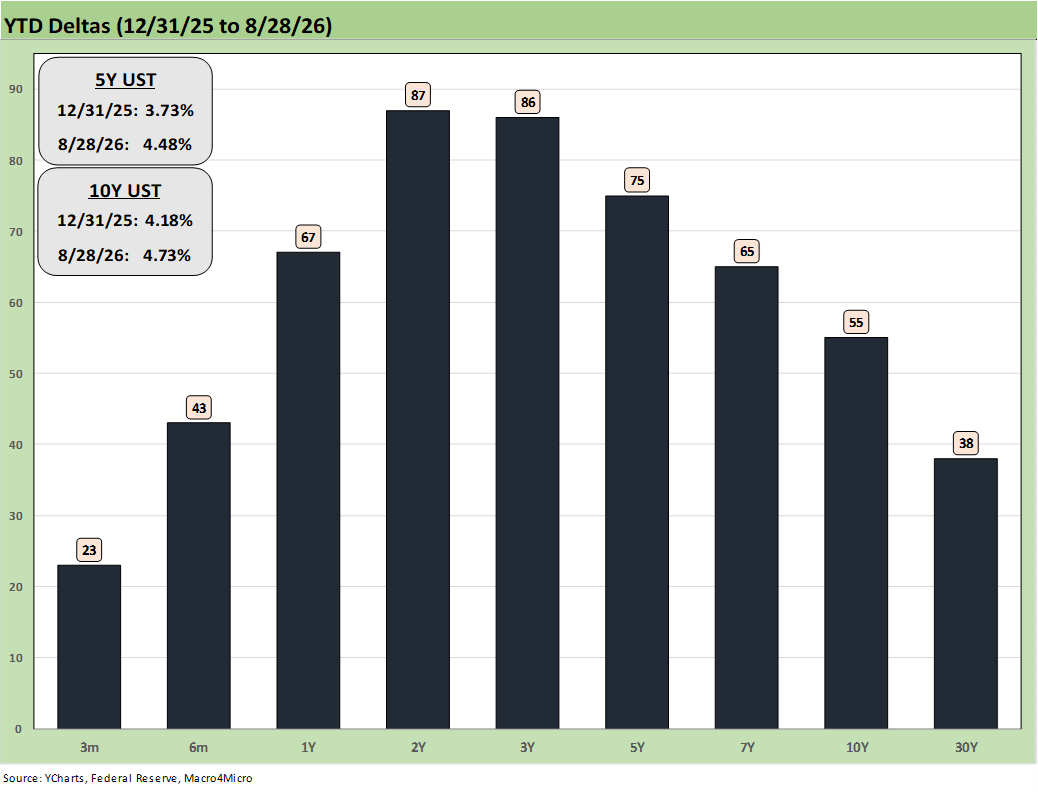
The chart above updates the running YTD UST deltas and tells an obvious story of adverse trends on the back of stubborn inflation, fallout from the Iran War, steady jobs, and resilient demand. The bear flattener from 2Y to 10Y follows sharp moves higher in short term working capital financing. The higher cost short duration financing hits customer financing in such key areas as consumer durables and increased costs of securitization for the corporate sector.
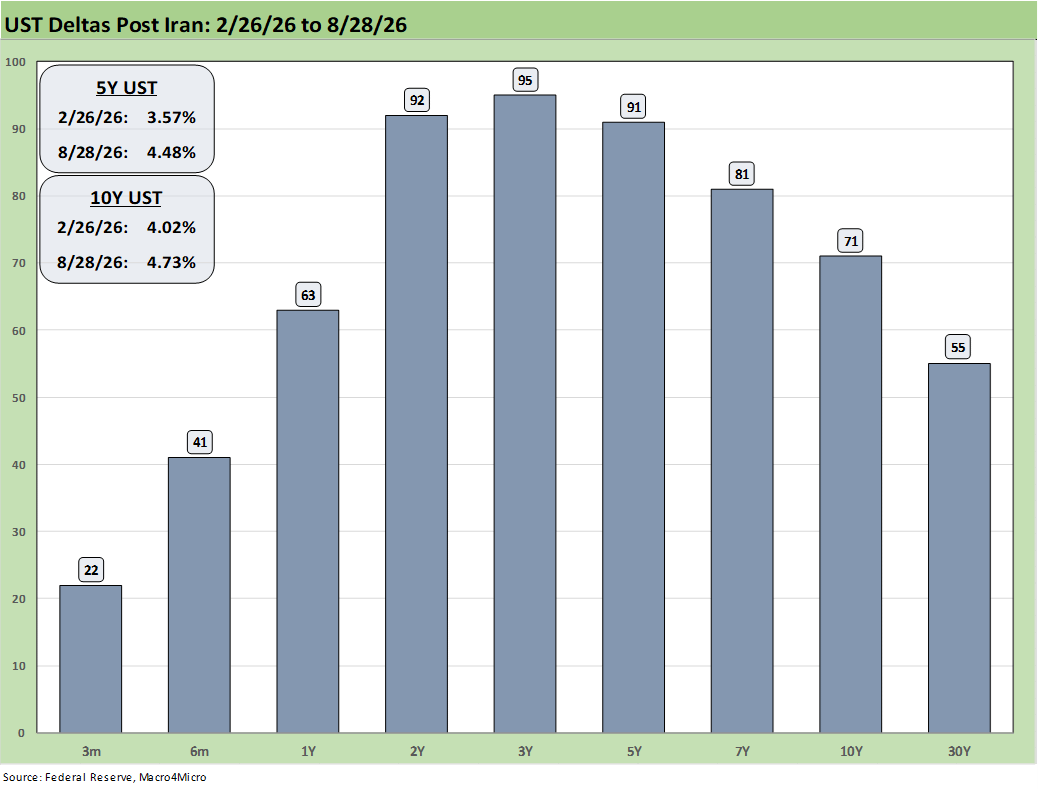
The above chart hammers home how we got there – Iran was the driver.
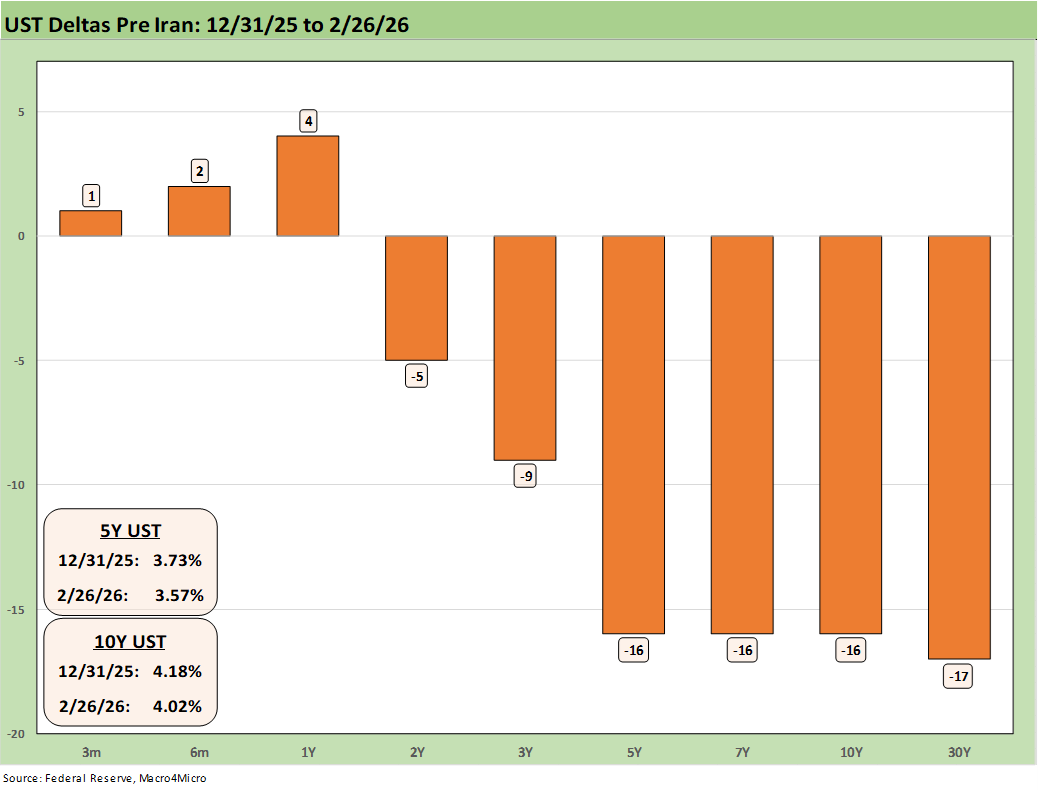
The pre-Iran UST deltas remind us of the systemic cost of the Iran mistake as the market was seeing lower rates and a downward shift ahead of the late Feb 2026 start of bombing and ensuing war.
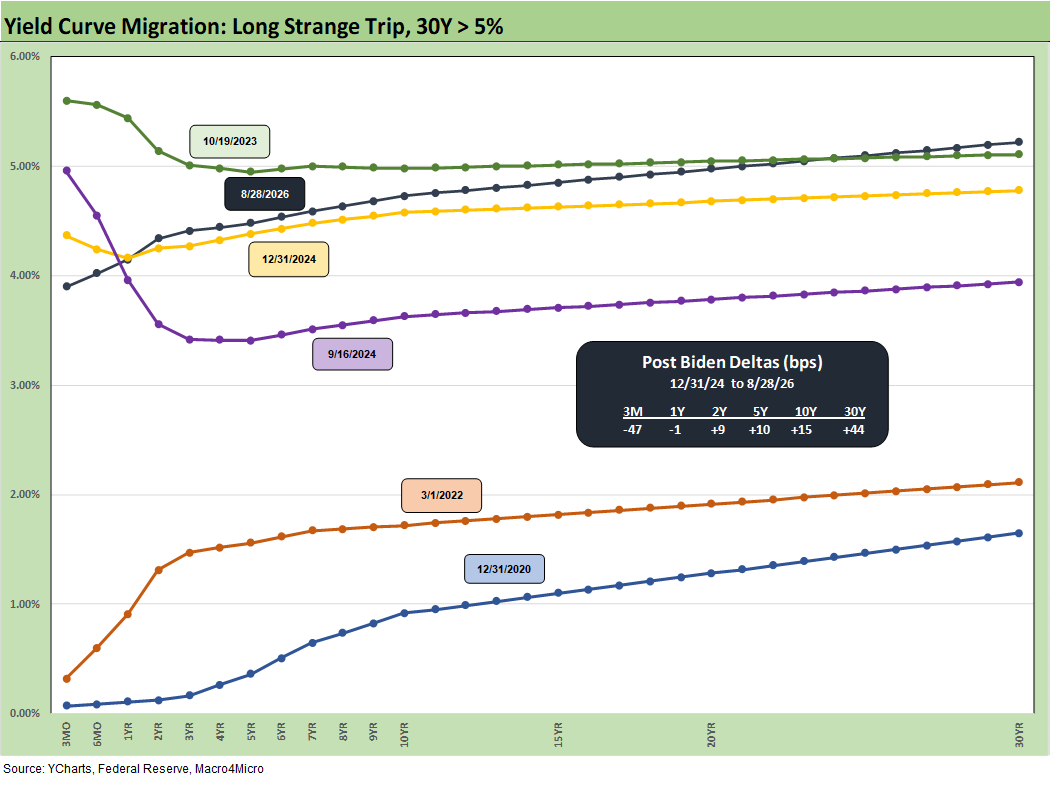
The chart above and those that follow are for memory lane purposes. This chart will be part of the regular updates since it tells a story of historical context and the migration from 2020 across the tightening cycle to the Oct 2023 peak rate on the 10Y then back across the easing cycle in 2024-2025 through current times.
The UST history can be framed against today’s curve and other notable credit market timelines during the economic and monetary cycles of bygone years. The charts offer context on absolute yields and UST curve shape. The scenario checklist to wrestle with on the direction of the curve includes “flatter via FOMC tightening with a steady long end” vs. “upward shift” or “steepening on more inflation pressure from higher oil.”
In the above chart, the move from 12-31-20 and ZIRP across the inflation and tightening cycle of 2021-2022 is clear enough in the move from 12-31-20 to 3-1-22. That came just ahead of the mid-March 2022 start of the tightening cycle and end of ZIRP. The long end is driven by the market, and that vote from the market was obvious.
We like to highlight 9-16-24 UST curve to timestamp what was unfolding immediately before the easing cycle kicked into gear in Sept 2024 through Dec 2024 (see Footnotes & Flashbacks: State of Yields 12-29-24 ). That was when the 10Y was around 3.6% and mortgage rates were near 6.0%. That was around 7 weeks before Trump won the election to take his role in Jan 2025 in a peaceful, uncontested transfer of power (i.e., light on violence and Capitol sackings).
As noted in the above chart, the bear steepening on the long end was a force during 2024, and it has been hard to resist that UST bias across time into 2026. The steady economy and inflation back on the rise from the end of Dec 2024 meant steepening was hard to resist. The 10Y and 30Y UST deltas have not been moving in the right direction even though mortgages are not back to fall 2023 levels. The 30Y mortgage rates as of today was just over 6.8% (6.81%) using the Mortgage News Daily survey.
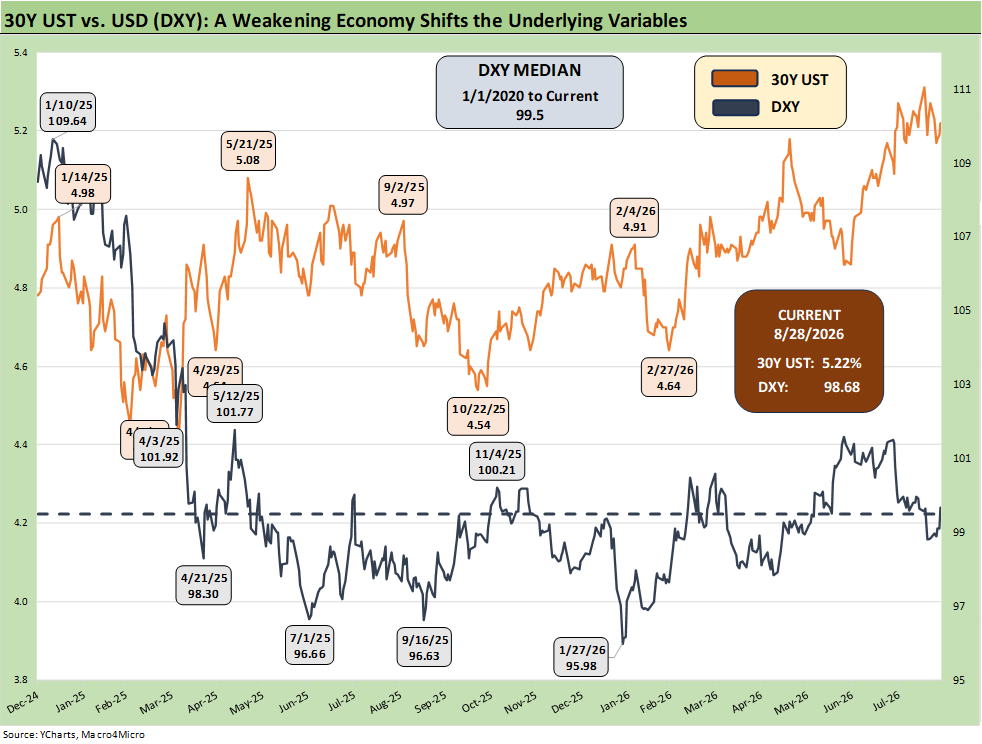
The above chart updates the 30Y UST vs. the dollar index (DXY). That is getting back into focus again as the UST supply pressures and “other worldly” deficits are felt and national debt just keeps on rising. Combined with new milestones in debt levels (the “$40 trillion and climbing” reality), those headlines are tough to counter.
The US Treasury General Account can only buy so many long bonds, and the tendency of Trump to alienate the existing base of international investors makes the currency issue an important variable. Threats this past week on dollar clearing (SWIFT) for those countries that do not submit on Iran’s “Economic D-Day” offered a fresh reminder to the BRICS alternative payment system advocates. That will be back in focus near term as the US and Canada have a trade war, the Mideast is in chaos, and the EU sorts out how much they hate the US (or which country hates us the most). It is getting competitive.
The rule of thumb is that higher yields and economic growth bring a stronger dollar, but higher rates from inflation and UST supply-demand imbalances are a separate story. With Warsh viewed as heavily biased toward easing (if truth serum was administered), this past week’s speech was a relief to the inflation hawks.
Meanwhile, a new wrinkle has been Bessent looking to stabilize long rates through US creative buybacks. Bessent waving the “buyback flag” started out as an “Operation Twist” version (borrow short, buy long bonds) before it quickly shifted to a focus on using US Treasury balance sheet liquidity from the General Account. Both plans were widely panned.
The recurring issue of record debt and steady, dramatic budget deficits are hard to shake. The deficits emanate from massive spending and shortfalls that flow into the sovereign balance sheet. That means more borrowing. The UST market is a line of credit funding fiscal mismanagement.
Meanwhile, the wildcard of oil prices haunts the long end and can infect the inflation targets that dictate the FOMC actions. Tightening would drive interest costs higher on the short-term funding costs from higher short UST. The bear flattener of this past week offered a reminder that the market believes Warsh might be serious about higher rates.
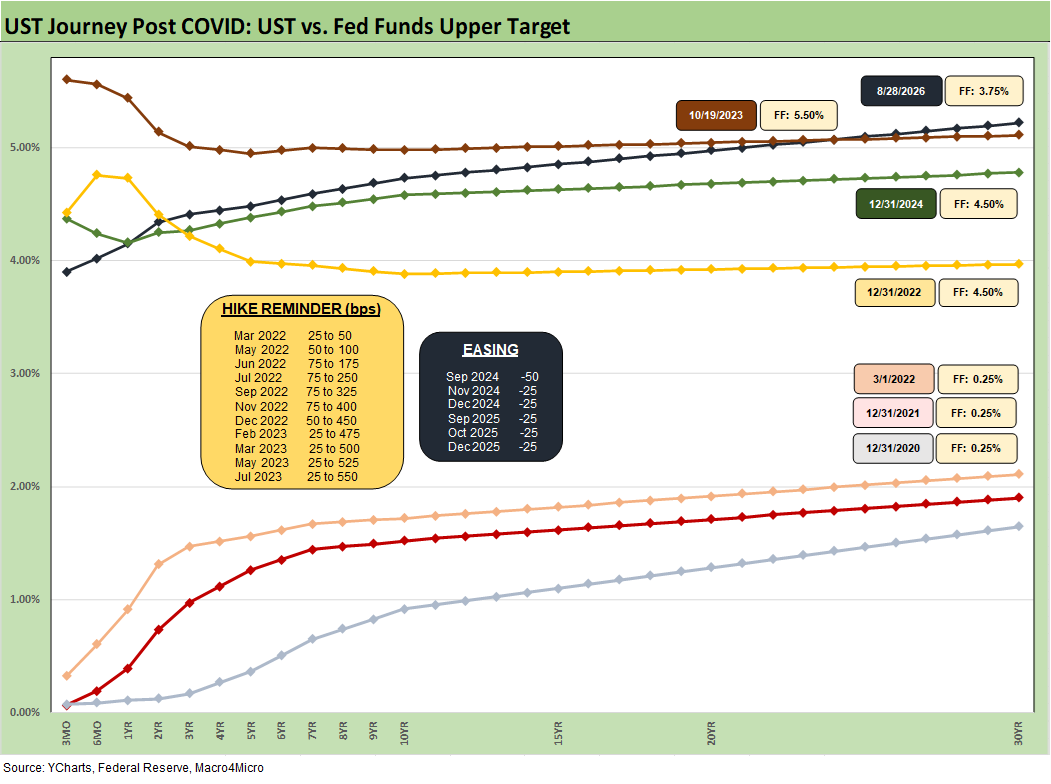
The above chart is one we include as a memory jogger on the troubled journey from COVID and ZIRP across the tightening and easing cycles. We detail the easing and tightening actions by month and magnitude across time in the boxes.
We see the shift after March 2022 to year end 2022 on the tightening and inflation pressures. That was clearly a major move from March to Dec 2022. This timeline cuts across the easing in 2024 and 2025.
Trade wars and tariffs will play a role, and that is getting worse. Wages have been an X factor in past inflation cycles and that has not arrived (yet). Many eyes are looking for any hint of wage pressure that has not shown up at all at this point (see Payroll Deltas July: Mixed Bag, Mediocre Numbers 8-9-26). Negative real wages in a steady economic cycle are supposed to move the needle higher on wages, and that affordability discontent can show up in politics (election year) and policy decisions. Collective bargaining also can play a role.
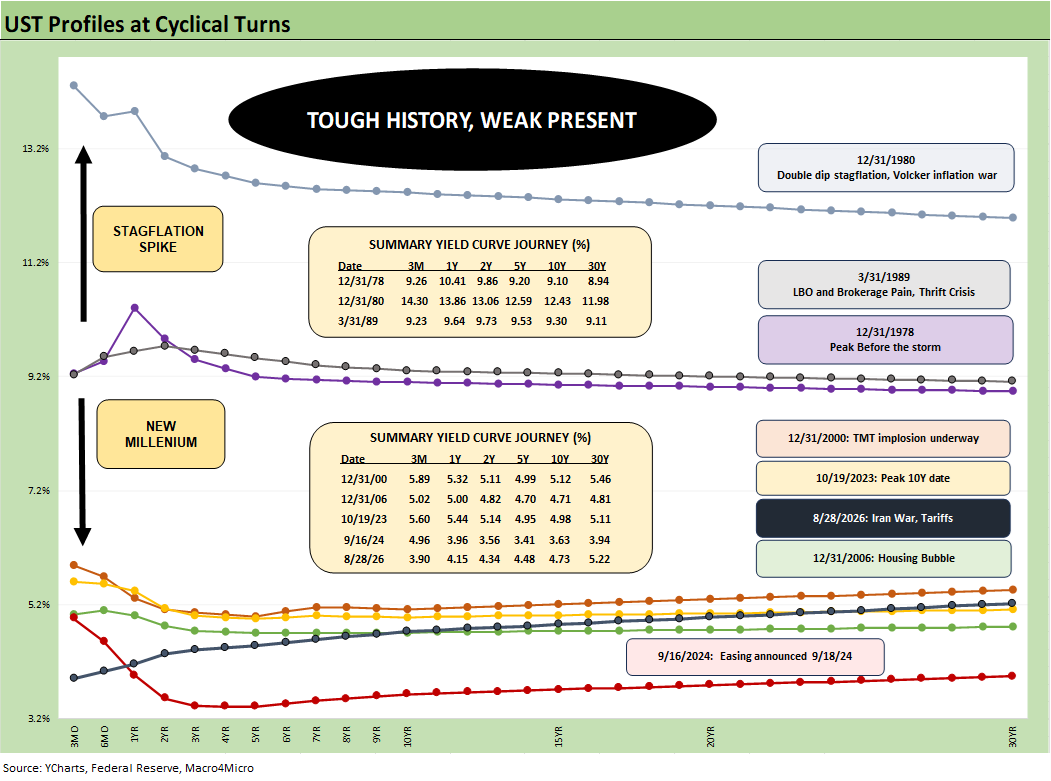
The above UST history revisits the shift from the Carter inversion and peak of 1978 across the stagflationary 1980-1982 double dip that kicked off after an Iranian oil crisis in 1979.
We see the 9-16-24 UST curve sitting on the bottom during the late stages of the Biden administration, but we suspect Trump, Hassett, and Bessent will not be flagging that memory. After all, the UST curve had sent mortgage rates higher again after team Trump was put in office. That does not change the fact that we are still well below the peak mortgage rates of Oct 2023.
One of the key takeaways from history is that flat curves that arrive after some FOMC tightening in a cyclical peak can lead to trouble. The question will get louder if the Fed tightens by year end.
Worries get worse if we start to see an inversion. Credit market peaks such as the transition across 1989 into 1990, the move into 2000 after a +86% NASDAQ year in 1999, and the tail end of 2006 on the way into 2007 all make for some interesting compare-and-contrast drills.
We look at some of these histories in the links at the end of this commentary.
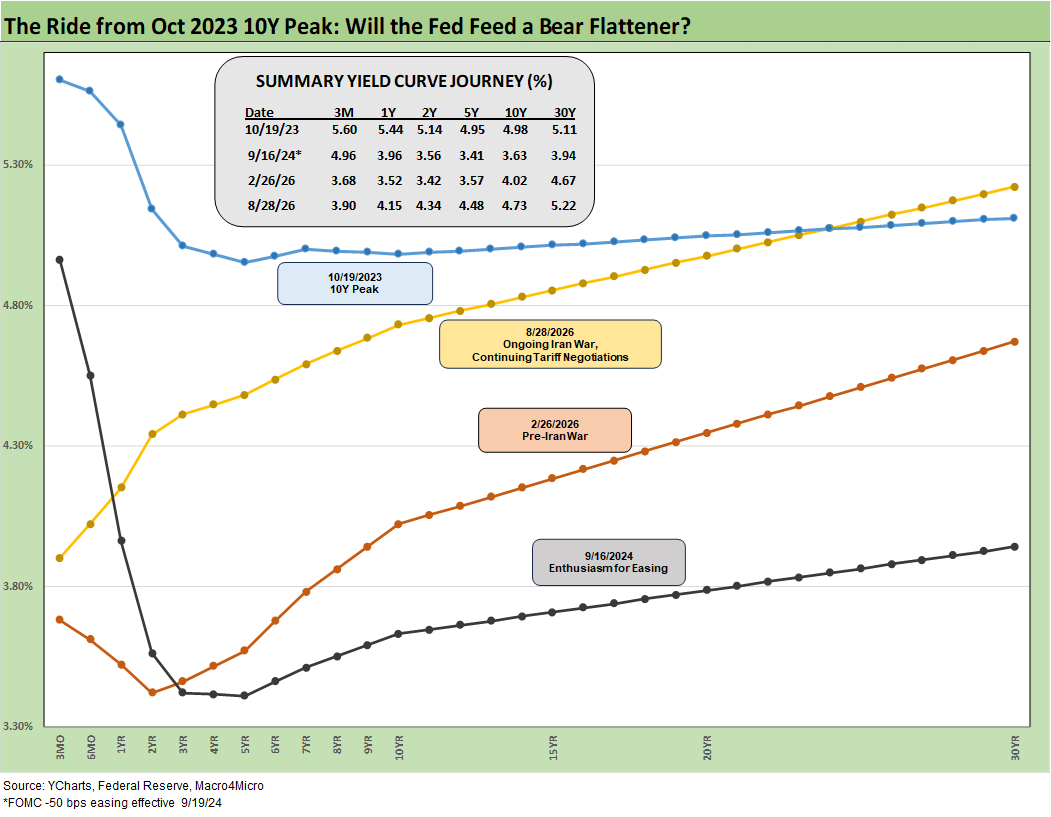
The above offers some more granularity on the migration from 9-16-24, across the pre-Iran war period and then to the current post-Iran Friday close. We include the UST curve from the peak 10Y date (10-19-23) when the 10Y hit 5.0% intraday. The sub-4% yields on the 10Y UST (3.63%) and 30Y (3.94%) UST in Sept 2024 tend not to be a discussion point from Team Trump.
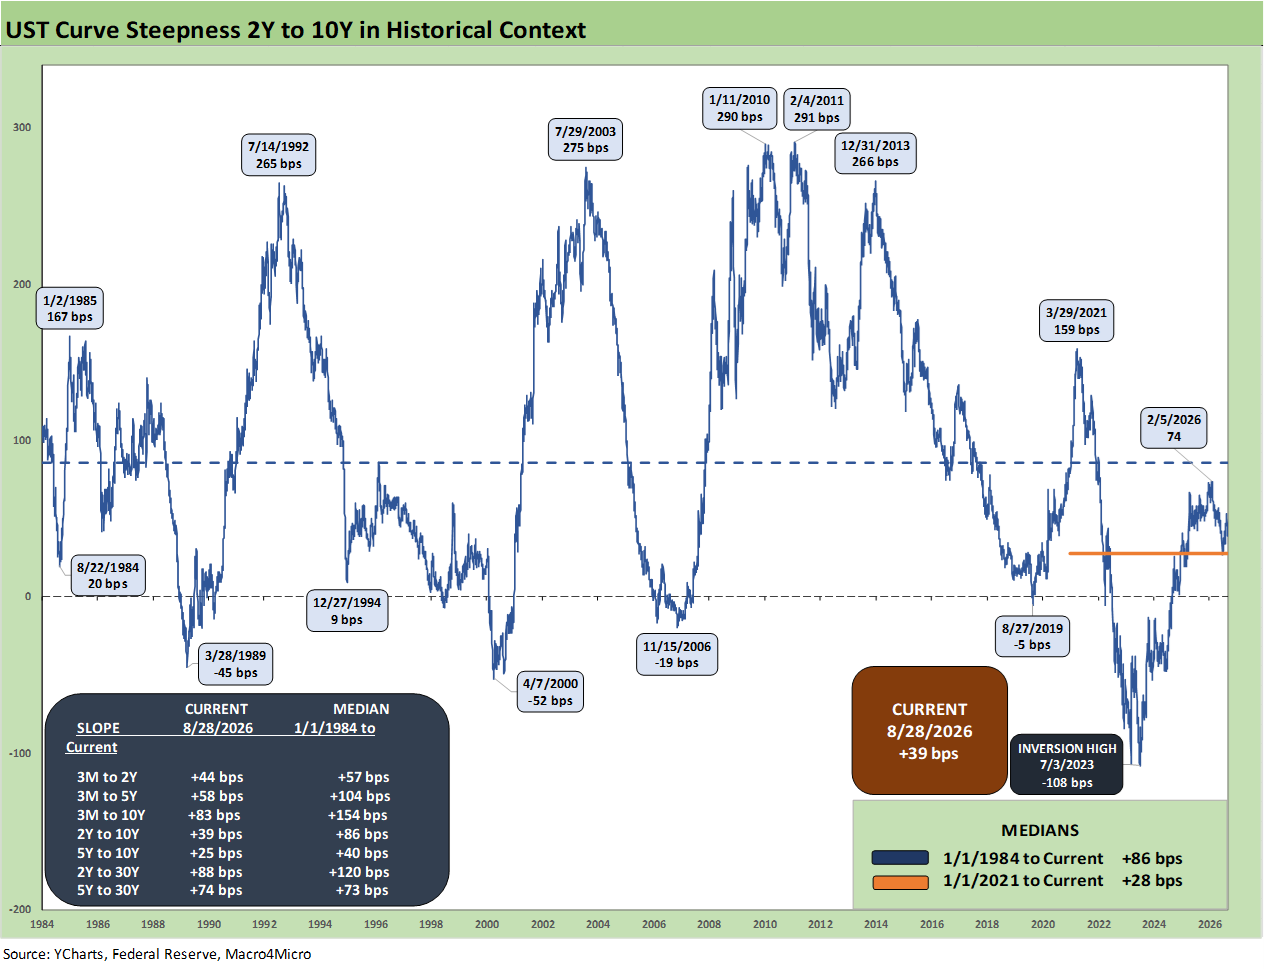
We update the long-term 2Y to 10Y slope history after this past week’s bear flattener as the 2Y UST pushed higher after the Jackson Hole speech. The current +39 bps is less than half the long-term median.
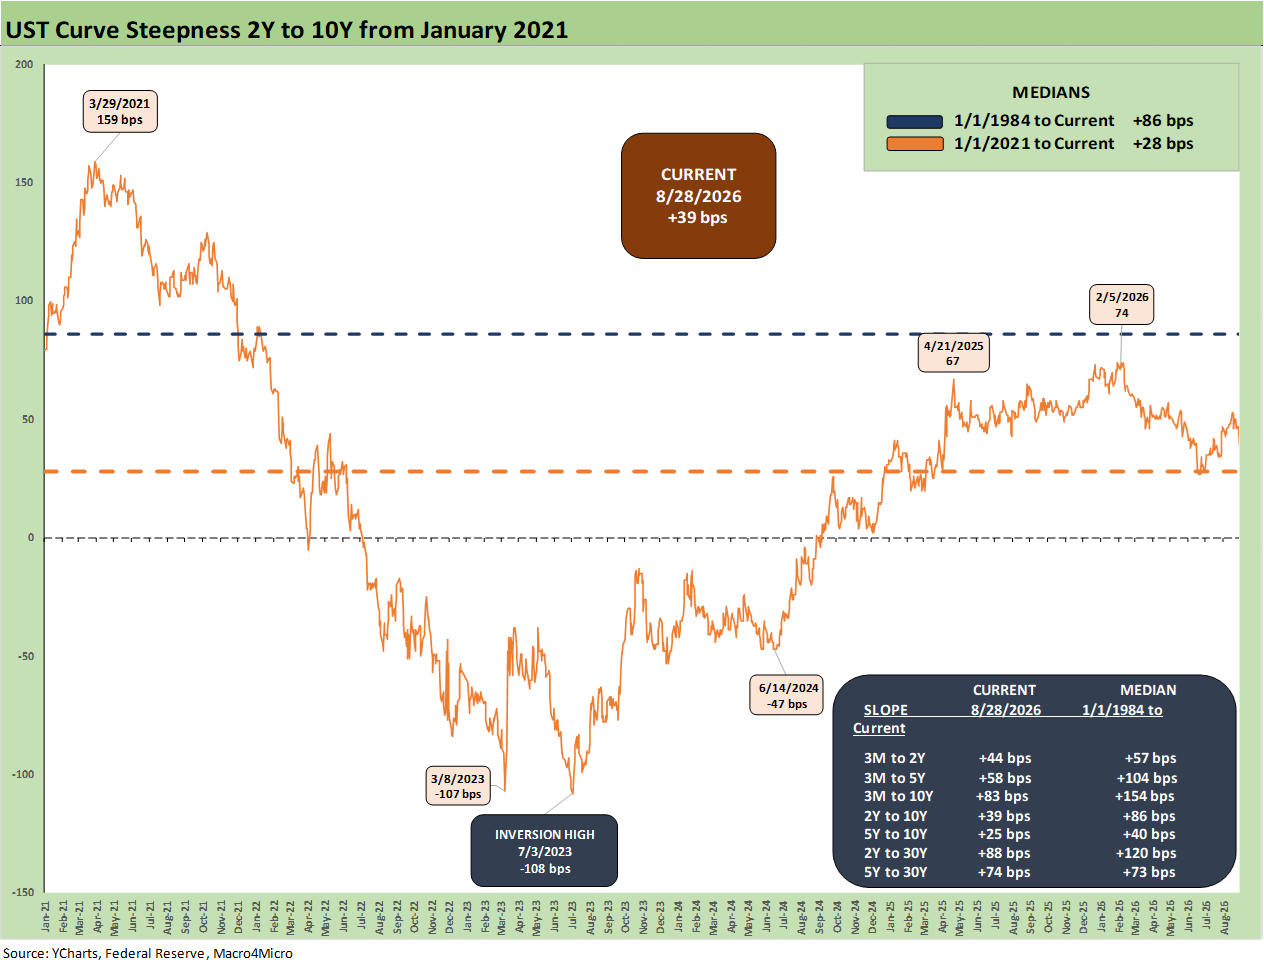
This chart shortens up the timeline for the 2Y to 10Y slope to a start date of early Jan 2021 with ZIRP. The stretch from ZIRP and across the ensuing inflation and tightening cycle into an easing made for a very wild rise. The slope peak of +159 bps in March 2021 gave way to an inversion of -107 bps (3-8-23) and -108 bps (7-3-23).
Flattening and inversion cycles have a rough history for the ensuing economic trends. The ZIRP years were somewhat of an anomaly after a bank crisis and later a pandemic.
With FOMC policy uncertain but odds leaning toward FOMC tightening, the question around the long end looms large for refinancing costs and the housing markets. Financing costs in areas such as autos and housing do not get captured in CPI, but that debt service effect undermines affordability.
See also:
PCE July 2026: Mixed Consumption, Stubborn Inflation 8-26-26
2Q26 GDP: 2nd Estimate 8-26-26
New Home Sales July 2026 8-25-26
Market Commentary: The Curve 8-24-26
US-Canada: Benches Ready to Clear 8-22-26
US-Canada Tariffs: Protection Racket 8-19-26
Housing Starts July 2026: Grim Numbers 8-18-26
Some UST curve histories:
Business Cycles: The Recession Dating Game 10-10-22
UST Curve History: Credit Cycle Peaks 10-12-22
Bear Flattener: Today vs. 1994 and Aftermath 10-18-22
Fed Funds, CPI, and the Stairway to Where? 10-20-22
Greenspan’s First Cyclical Ride: 1987-1992 10-24-22
UST Curves: Slope Matters 10-25-22
Greenspan’s Last Hurrah: His Wild Finish Before the Crisis 10-30-22
Wild Transition Year: The Chaos of 2007 11-01-22
UST Slope Update: Some New Inversion Highs 12-8-22
Yield Curve Lookbacks: UST Shifts at Cyclical Turns 10-16-23
UST Moves 1978-1982: The Inflation and Stagflation Years 10-18-23