
Credit Crib Notes: Toll Brothers (TOL)
We summarize the financial and operating trends for TOL in bullets and charts.


Credit quality trend: Positive. Lower leverage, higher margins, rising volume and pricing, and a demonstrated ability to navigate challenging markets earned Toll a position back in the IG index during the past cycle with July 2023 seeing the last of three major rating agencies moving Toll back to full investment grade.
Operating profile: As the leading luxury homebuilder, Toll combines the impressive status of brand leader in luxury with a distinctive product tier risk profile that is still supported by healthy supply-demand fundamentals and demographics.
Financial trends: Toll’s cash flow and homebuilder working capital resilience remains very much intact in the event of a slowdown in the housing market while leverage is at multiyear lows (well below 2019) and “cash + inventory” coverage of debt is at multiyear highs.
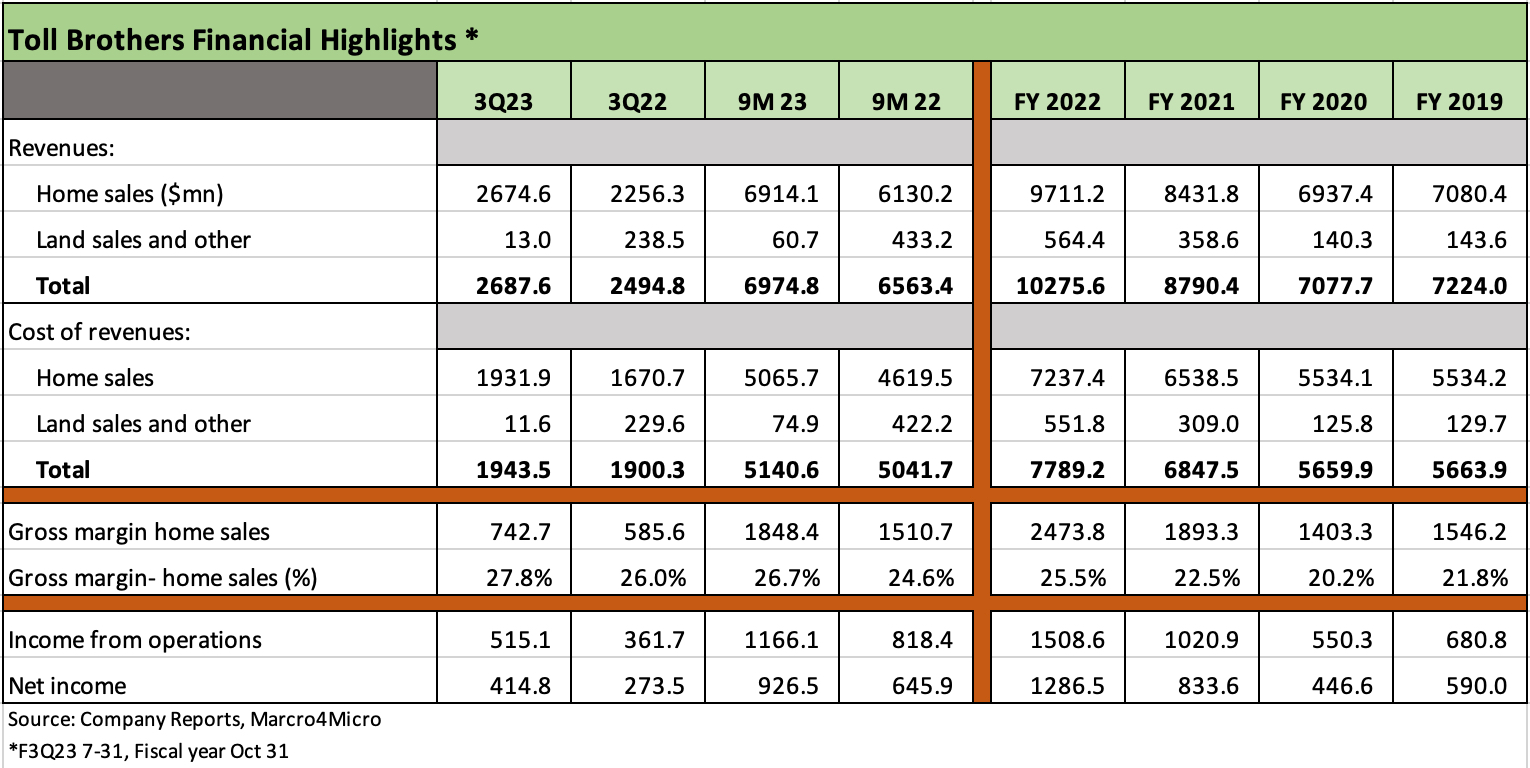
The profitability trends at Toll Brothers are decidedly favorable with home sale margins above 2019 levels and trends favorable in FY 2023 (10-31-23 fiscal year).
Revenues and Net income soared YoY in 3Q23 (7-31 Qtr.) and through 9 months, and the stock performance of Toll reflects the favorable issuer and industry trends as homebuilders face very favorable YoY comps relative to the initial mortgage rate shock reaction during 2022.
Toll raised its guidance for all of its core homebuilding metrics for FY 2023 with its 3Q23 release including gross margins, home sales revenues, and SG&A margins.
Contracts signed during 3Q23 were up 77% YoY in units and +30% in dollars in a favorable and easy YoY comp to 3Q22 when interest rate anxiety and inflation uncertainty had peaked.
Through the mid-Sept 2023 YTD, LTM and trailing 3Y period, TOL equity has been one of the best performers of the Top 5 homebuilders (behind Pulte) in a market where builders have dramatically outperformed the overall broad equity benchmarks.
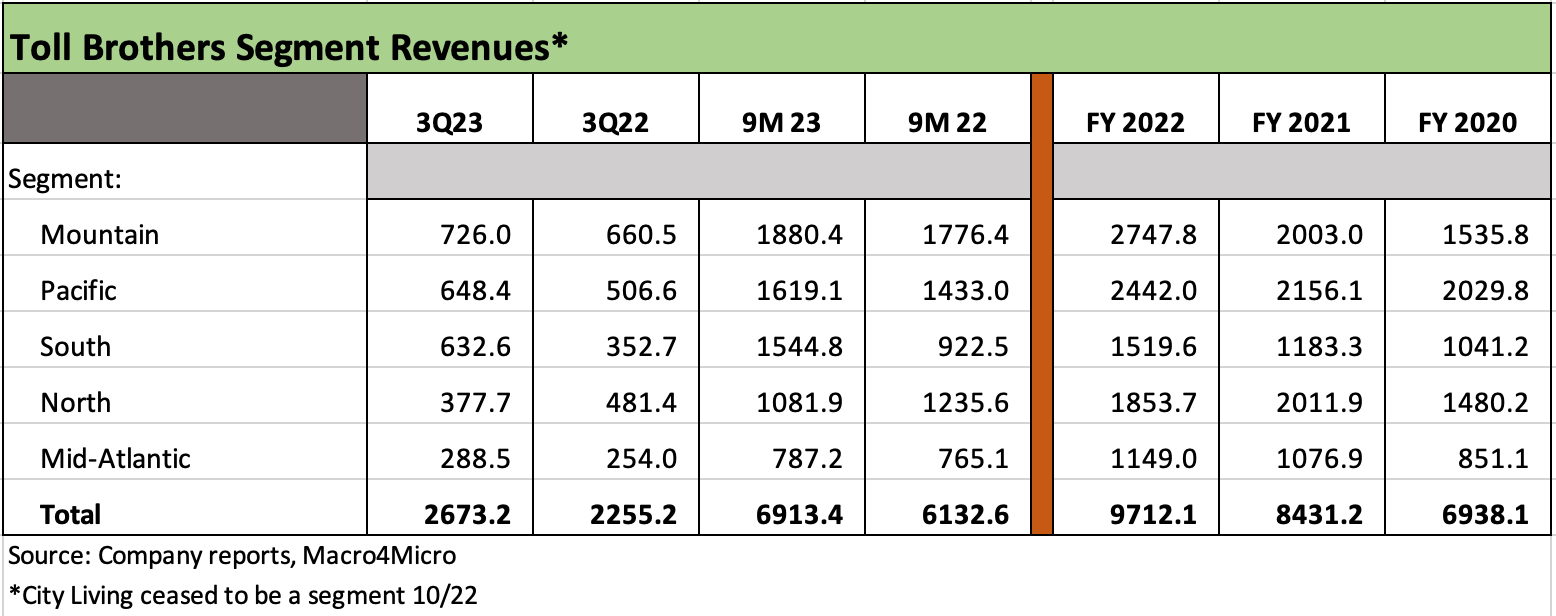
Toll operates across 5 geographic segments as noted in the above chart with good balance across its top three regions (Mountain, Pacific, and the South) with smaller operations in the North and Mid-Atlantic.
Toll changed its segment presentation at the end of FY 2022 as the company concluded the urban high rise luxury operations (“City Living”) was no longer of a scale to be a reportable segment with Toll winding down and divesting much of its remaining “Urban Infill” operation across 2022 as it returned to its legacy focus on “Traditional Home Building” operations.
Toll had 345 active communities at the end of 3Q23, down less than 1% from the end of FY 2022 and up over 4% YoY with a target number of 375 by year end.
Toll owned/controlled over 70K home sites at 3Q23 evenly distributed between owned and options with 8.3K homes expected to be purchased over the “next several years” from JVs where Toll has interests.
“Specs” in 3Q23 sales was around 28% of deliveries and around 40% of sales is targeted.
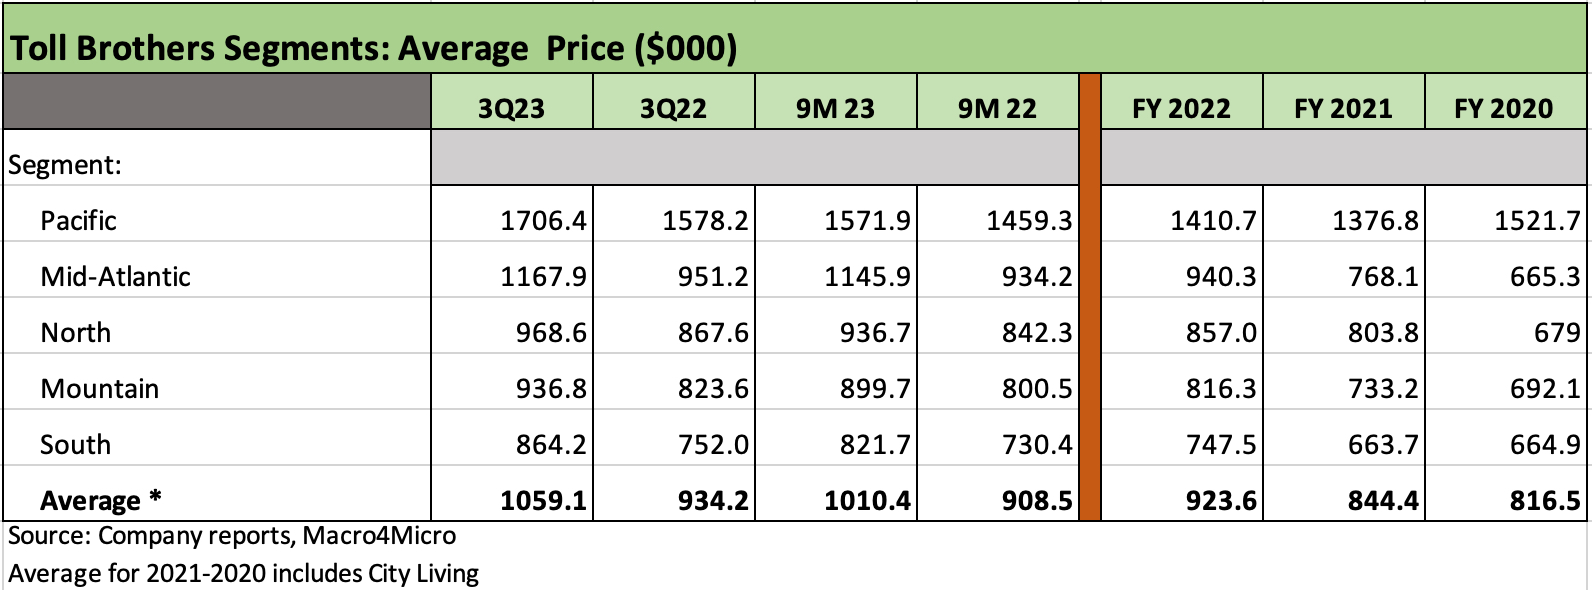
The average price of Toll homes delivered was over $1 million in 3Q23 ($1.06 mn) and 9M 3Q23 ($1.01 mn) presents a stark contrast to the peer group including those with a heavy California-centric mix (e.g., Tri Pointe) since Toll offers a broad geographic mix in its segments at very high average prices.
It is important to keep geographic and product mix shifts in mind when looking at Toll home price trends and distinguish between deliveries, contracts, and backlogs. Regardless, the results are good.
TOL saw base prices climb and incentives decline during 3Q23 with average prices raised by $20K with notable strength in the South and Mountain region where prices are generally lower than in the high price Pacific region.
In a market facing material headwinds in affordability tied to mortgage rates and a spike in monthly payment demands, the customer base of Toll presents a major differentiating factor and brings a relatively favorable risk profile vs. the peer group.
High down payments, lower LTVs on mortgages (68% in 3Q23), and a high mix of cash buyers have stood the test of time across periods of extreme volatility from the credit crisis and housing bubble to the COVID meltdown and now the mortgage spike in what can be viewed as a series of “real world stress tests.”
The wealth of Toll’s average homebuying customer, the ability to pay cash (20% of buyers long-term are all cash but 25% in 3Q23) or the ability to take on a high mortgage contract rate with higher confidence the homebuyer can simply refinance later.

As noted in the chart, leverage is down sharply from 2019 and down YoY and sequentially from FY 2022 with Net Debt % Cap at 20.5% and Total Debt % Cap under 30%.
Asset coverage in the form of “cash + inventory” of 3.6x reflects strong protection for unsecured lenders and mitigates exposure to impairment risk or any scenario of a sharp slowdown in cyclical volumes, which in fact serves to generate high free cash flow on inventory liquidation.
Unsecured loans and unsecured senior notes benefit from the same subsidiary guarantees with minimal maturities until 2025 and a freshly extended $1.9 bn revolver that matures in Feb 2028 with $1.78 bn available at 3Q23 net of LOCs.
Minimum net worth and debt/tangible net worth covenants in the credit agreement (1.75x leverage test as defined) present minimal structural risks with $1 bn in cash on Toll’s books and ready access to refinancing alternatives.
The $650 million unsecured term loan has $101.6 mn due 11-1-25, $60.9 mn due 11-1-26, and $487.5 mn due Feb 2028 with Toll entering into fixed rate swaps (before the spread) in 2020 for much of the exposure. Toll is a very strong counterparty.
Toll has been a reliable repurchaser of stock and pays a dividend as part of its capital allocation strategy with buybacks totaling over $1.5 bn cumulative from 2020 through 2022 and $239 mn through 9 months 3Q23 ($400 mn buyback target for FY 2023).
The Toll dividend yield is just over 1% (just under LEN but slightly more than DHI at latest close).