Toll Brothers F2Q23: Company Comment
We look at a strong 1H23 for Toll Brothers as new million-dollar homes see strong demand
"Is that the entry level Toll Brothers offering?"
Toll Brothers posted a strong F2Q23 quarter as credit quality continues to improve and issuer and fundamentals remain supportive from balance sheet metrics to revenue and earnings.
Improved margins, lower leverage, and an upward revision in volume and pricing expectations for FY 2023 is a good start from the halfway point in the fiscal year with the peak selling season in process.
The management discussion of solid demand for $1 million homes and the need to grow the spec mix makes a statement on the healthy demand on the high end for newly built homes.
The F2Q23 April reporting period (Toll has an Oct FY) and the earnings call offered a good amount of positive color. Unit volume and total revenues were both 2nd quarter records. The results in the table above are very impressive considering that the $1M+ segment of the existing home sales market (as opposed to newly built homes) have been posting the highest % declines in the existing home sales stats (see Existing Home Sales: Will the Party Start? 5-18-23). The new $1 million dollar homes being sold by Toll Brothers are selling well with the company raising guidance for both volumes and gross margins for FY 2023.
The above table details the geographic regions where the company operates. The company changed their reporting segment by ending the City Living segment during the 2022 FY. The Toll luxury apartment operations are well-known in some of the high-cost urban areas, but the segment was too small relative to the traditional homebuilding business.
Toll is an unusual enough company by itself with its dominant position as the luxury leader. The average prices across the geographic segments weighed in at just above $999K with the Pacific segment at $1.58 mn average for 2Q23 and the Mid-Atlantic segment at $1.13 mn. The $982K average for 1H23 was driven by higher average prices in all five regions as detailed in the table. The average price per home in backlog at 2Q23 is $1.1 million.
The fact that they can build a high mix of spec homes at these prices tells you their buyer base is seen as deep. Toll is in fact expecting to grow their spec mix to as much as 40%, which is consistent with recent quarter orders. They expect 30% to 40% spec for the “foreseeable future.” Toll indicated their cash buyers were 23% of sales and those that used mortgages were at an average LTV of 70%. For another interesting statistic, their cancellation rates were only 3.9% in 2Q23, which for its part speaks to their well-heeled buyer base and very high non-refundable deposits (averaging around $85K).
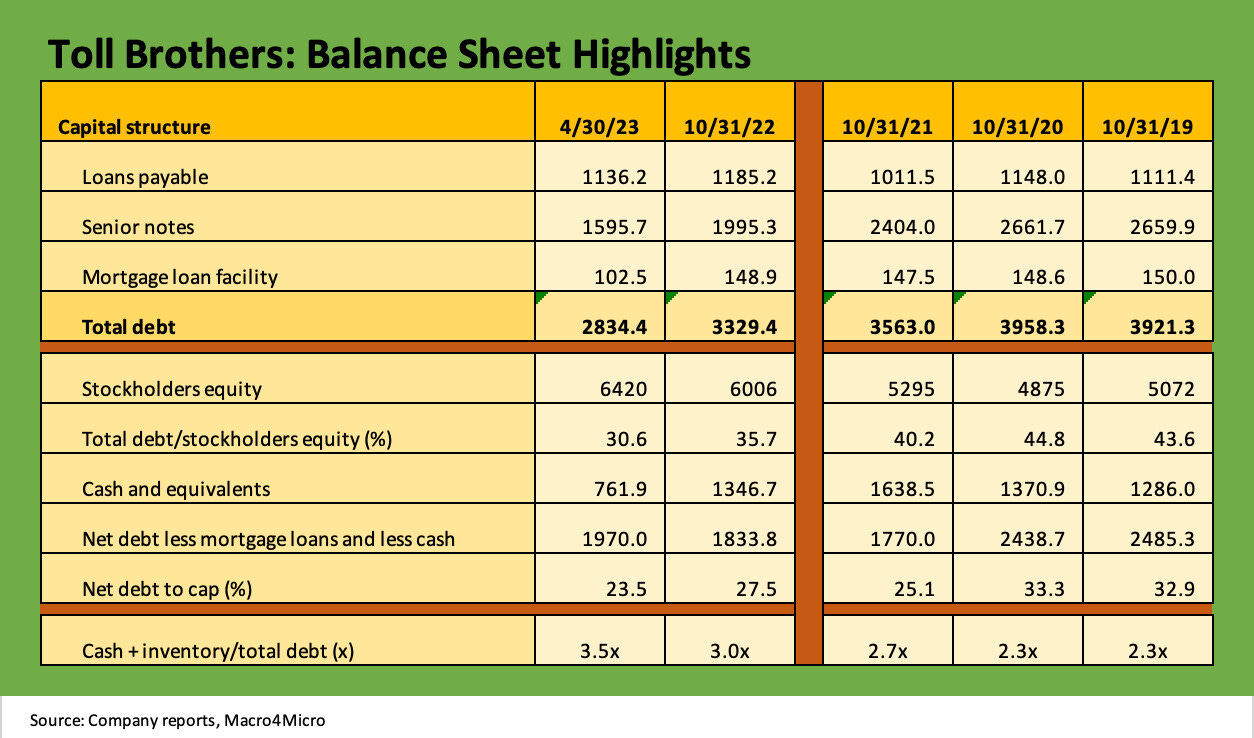
The above table detailed the decline in debt and lower leverage over the past few years. We use the leverage metrics that the company provides, which includes an adjusted net debt leverage measure that backs out a small base of mortgage line borrowings that is matched up against mortgage assets. We also add in our proxy for asset protection in the form of “Cash + Inventory/Total debt.” We see that ratio at a multiyear high for Toll at 3.5x.
A quick note on Toll stock performance…
The chart above frames the stock performance of Toll in the context of the broader homebuilder peer group, the S&P 500, and the homebuilder ETF (XHB), which also includes supplier chain companies. We line them up in descending order of YTD total return. We recently looked at two of the other big players (see Signals and Soundbites: PulteGroup 1Q23 4-25-23, Signals & Soundbites: D.R. Horton 2Q23 4-21-23) and the builders have been solid performers vs. the broader market benchmarks as the UST migration unfolded after an initial sell-off. The peer group has defied the very bearish commentary from the earlier stages of the UST migration and Fed tightening cycle.


