


Framing the duration of the next stage of the 5+ month Iran-US war is a mug’s game, but at least some cause and effects have been tested in how it flows through into the energy cost lines and the curve. At this point, we just hit a new high in the number of countries that have been targeted.
The month of July limps home in tech, duration takes a fresh hit, but oil sets the stage for a fresh round of inflation setbacks when the July numbers get released in August. PCE and the UST curve are signaling inflation worries (see The Curve: Steeper, Inflation Anxiety Remains 8-2-26, June 2026 PCE: Inflation, Income, and Outlays 7-30-26).
This week we get fresh trade data and payroll details. That comes after last week saw 2Q26 GDP post solid PCE growth and fixed investment lines despite the 1.5% headline GDP number. The PCE trends and lower savings rates come despite negative real wage growth (see Employment Cost Index June 2026: Inflation > Wage Growth 7-31-26). A good jobs number might get the market thinking about upside in wages.
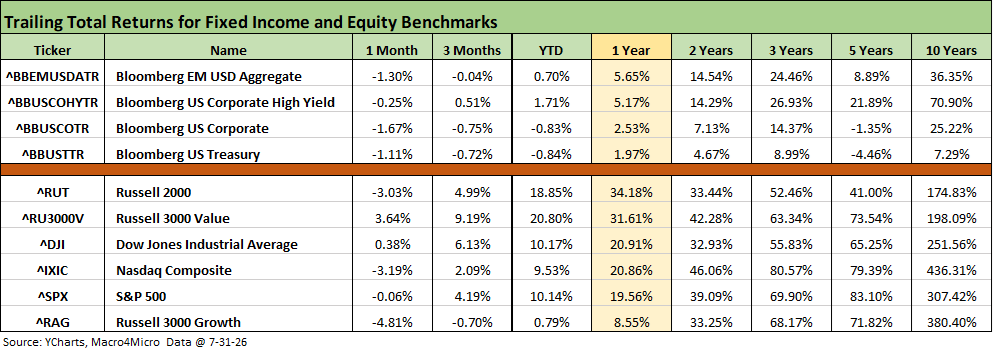
The above table updates the running returns on the debt and equity benchmarks we monitor, and we see all negatives in the 1-month debt column and 3 of 4 negative for the rolling 3 months with only the shorter duration HY asset line posting a slight positive.
The equity market setbacks in July show tech underperformance with the NASDAQ at -3.19% and Russell 3000 Growth at -4.81% joined by a very slight negative for the S&P 500. The Russell 3000 value benchmark beat the group at +3.64% while Russell 2000 lagged at -3.03%.
The 3-month equity timeline still shows strong numbers after a good rolling start for the Russell 2000 and Russell 3000 value along with the Dow and S&P 500. NASDAQ was the weakest of the large caps for 3 months at +2.0%.
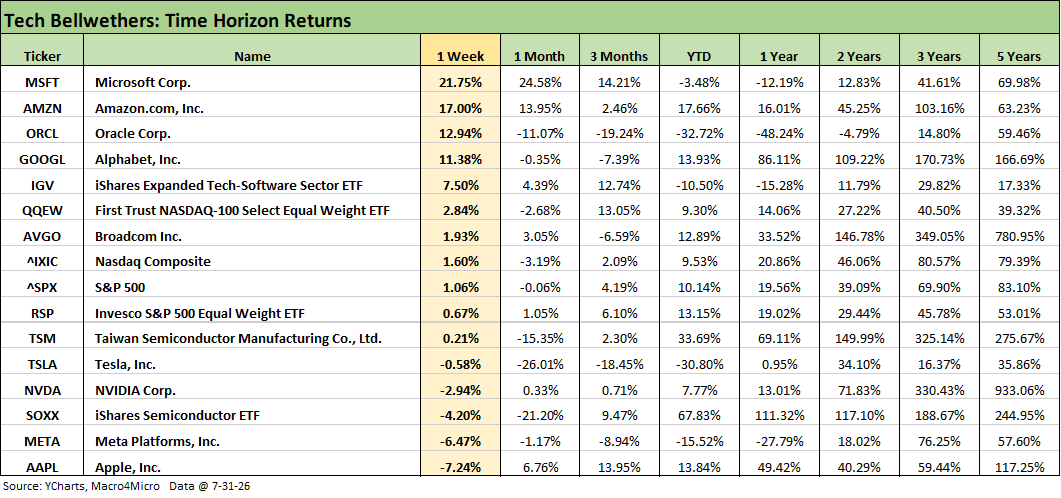
The tech bellwethers diverged with big winners and mild losers on the week. As we covered separately in the weekly recap, Microsoft (MSFT) and Amazon (AMZN) beat the group handily on its earnings release during the week while Apple (AAPL) and Meta (META) took a beating in the bottom 2 slots. We see 3 Mag 7 positive for the week (MSFT, AMZN, GOOGL) and 4 negative (AAPL, META, NVDA, TSLA).
Looking back 1 month, the Semiconductor ETF (SOXX) posted -21.2% in contrast to the +9.47% over 3 months, +67.83% YTD and a dazzling +111.3% over 1 year. TSLA posted an especially bad performance over 1 month at -26.0%, 3 months at -18.45%, and -30.8% YTD. We would also note that NVDA’s performance has stalled YTD at +7.8% with MSFT still in the red YTD at -3.48% despite a banner week of +21.75%.
Below is essentially a cut-and-paste from our Saturday LinkedIn post:
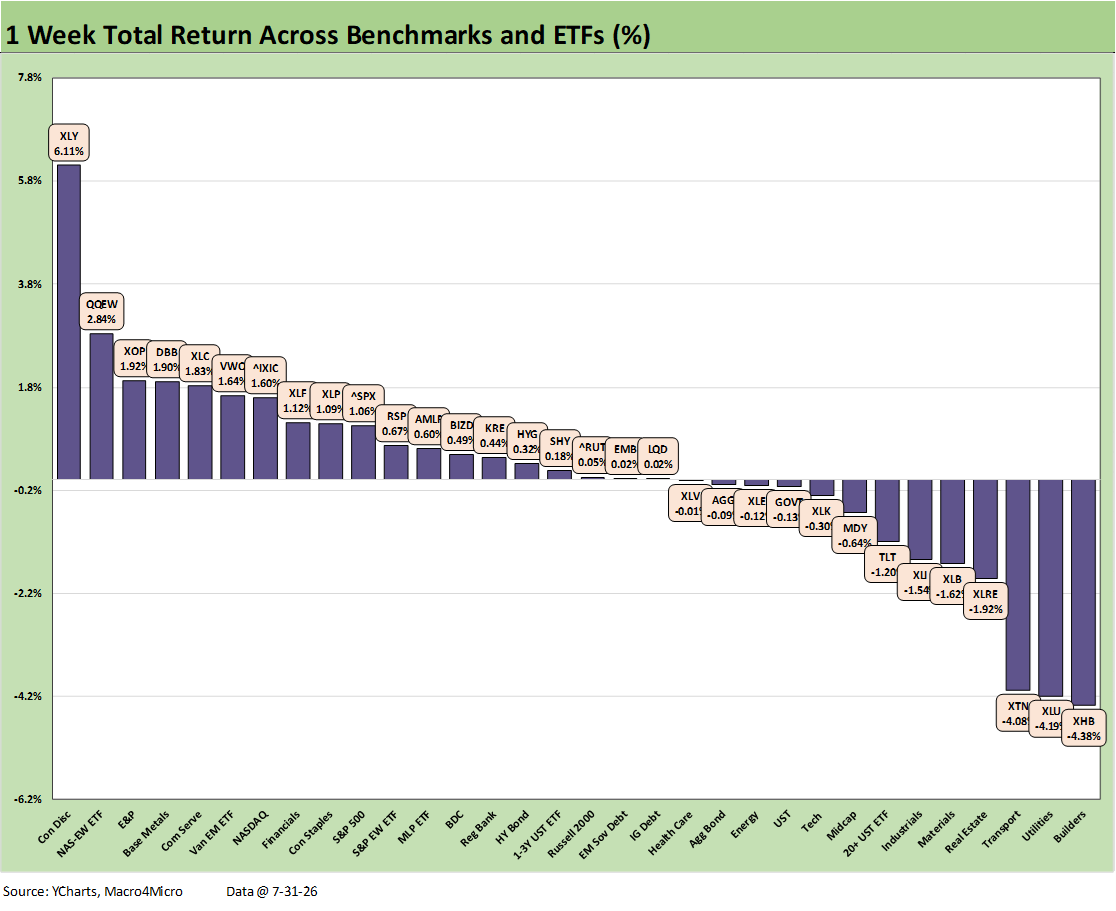
The chart updates the broader group of 32 benchmarks and ETFs that we monitor. Separately, we looked at a “tech check” mix of 32 tech ETFs and single name tech bellwethers as frames of reference. The group in this chart weighed in at a score of 19-13, which was the same score as the tech check list.
Bond ETFs posted a score of 4-3 favoring positive with IG Corporates (LQD), EM Sovereigns (EMB), and the short duration UST 1-3Y ETF among those positive returns that were closer to 0% returns than +0.5%. With the UST curve moving lower on the short end (3M to 3Y lower) and the 5Y to 30Y steeper, the HY ETF (HYG) beat the other bond ETFs but only reached +0.32% as a shorter duration sector.
The wildcard this week was a fresh round of moves in tech with the FOMC inaction and “sparse” (in substance even if not brief on the game clock) commentary from Warsh feeding a UST steepening and jump in the 30Y. Inflation anxiety will remain high ahead of a fresh set of energy numbers that will roll back into CPI, PPI, and PCE for July when the inflation numbers get released in August.
This past week handed the FOMC a wave of decidedly mixed numbers to digest. The PCE price numbers in the monthly income and outlays report remained well ahead of target at 3.7% headline PCE and 3.3% core PCE along with numerous problem line items underneath the headlines (we covered PCE separately).
The 2Q26 GDP this past week brought a solid PCE growth rebound vs. 1Q26 (we covered that in a separate commentary). In equities, the #1 performer on the week was the Consumer Discretionary ETF (XLY) at +6.1% with a heavy influence from Amazon’s contribution at +17% on the week.
The headline +1.5% GDP in 2Q26 does not capture the underlying strength in that GDP report at a time when revenue and earnings growth in the June quarter are bringing generally good news outside some wildly positive tech growth numbers posted in absolute terms –even if the stock valuation response is mixed.
Fixed investment continued to impress in the 2Q26 GDP lines, and that brings a lot of multiplier effects from materials to the supplier-to-OEM lines and the whole array of services infrastructure from freight/logistics to finance. The most important news was the recovery of consumer outlays in 2Q26 after such an ugly 1Q26. PCE is 68% of GDP.
Other top quartile winners include the Equal Weight NASDAQ 100 (QQEW), NASDAQ, and Communications Services (XLC) joined by E&P (XOP) and the Base Metals ETF (DBB). The bottom quartile featured interest rate sensitive sectors: Homebuilders (XHB), Utilities (XLU), Real Estate (XLRE), and the long duration UST 20+Y ETF (TLT).
Below is essentially a cut-and-paste from our Saturday LinkedIn post:
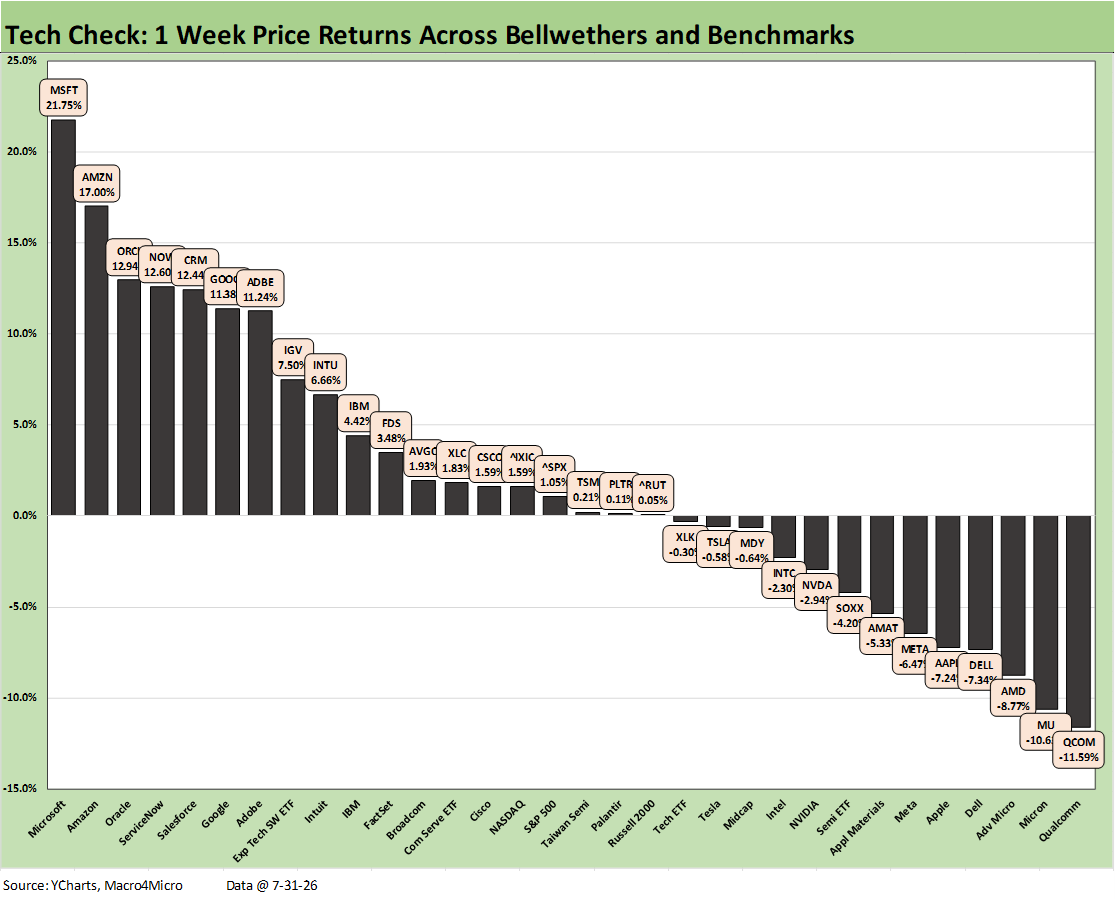
The 1-week returns of the Mag 7 offered another reminder that the tech subsector performance is not a case of “student body right, student body left” (to use an archaic USC football term). We saw 4 of the Mag 7 report this week with 3 Mag 7 stocks in the top quartile and 4 in negative range. The score of the tech check mix at 19-13 showed slightly more diversity in the top tier, but the Software ETF (IGV) in the high quartile at +7.5% still materially diverged from the Semiconductor ETF (SOXX) in the bottom quartile at -4.2%.
Microsoft (MSFT) at +21.75% and Amazon (AMZN) at +17.0% posted positive double-digit returns while Apple (AAPL) and Meta (META) were single-digit negative return losers. Alphabet (GOOGL) posted +11.4% while Tesla (-0.6%) still marches to its own beat. NVIDIA (NVDA) is swept up in the AI chip story and ended the week at -2.9%.
There are no companies that draw more published commentary in the financial media or from the sell side or buy side than the Mag 7, and the earnings report color and market reactions hammer home that there are numerous uncertainties in the top down and bottom-up picture. These variables cut across supplier chain constraints, unit cost pressures that support earnings for some (notably semis) while pressuring margins for others (e.g. Apple, other intermediate suppliers and those competing for chips such as autos, etc.).
Any constraints that challenge production lines and volume is a mixed blessing since pricing power is available, but the ability to meet the demand and maximize the value of the booming capex programs (while pricing long term forward valuation models) gets tricky.
That flows back into pricing and hits the ecosystem from cost-based pricing pressures that can feed inflation (“DRAM” costs that need to be passed on) to subsector headwinds that cannot easily pass through the costs (e.g. automotive and chips). We regularly hear auto suppliers and OEMs bemoaning that they compete with the tech sector for supplies as it roils supplier-to-OEM relationships on component pricing.
Headlines about servers framed how trade battles could unsettle pricing when the smoke clears. The reality is a high trade deficit (Taiwan, Mexico, etc.) can reflect very favorable end markets for US companies. That reality is often lost in the “all deficits are bad, more tariffs please” mentality of Team Trump. Recent history shows trade deficits have been highest when the US economy and consumer demand are strong. Deficits have been lowest when the economy is in turmoil.
We get trade data this coming week after the recent 2Q26 GDP report saw a sharp rebound in “Personal Consumption Expenditures” and still booming fixed investment growth. Earnings news has been good, but wild swings in stocks have challenged markets. Gloomy views on software and SaaS names have been easing, and MSFT certainly shook out some of the bears this past week with its results.
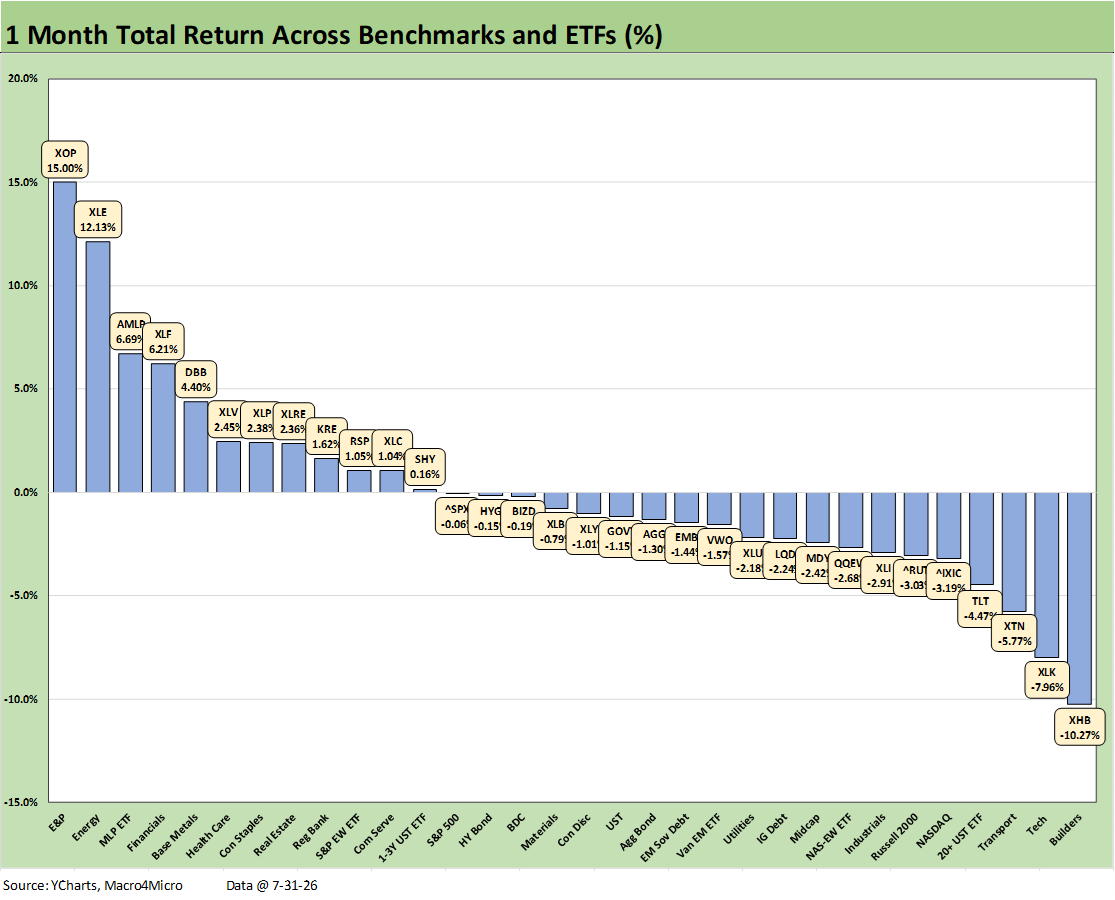
The 1-month timeline underscores a tough July for the markets with a score of 12-20. The easy summary is that bonds were hit and the high-flyer tech names took a relative beating on the month. For bond ETFs, we see 6 of the 7 in the red with only the short duration 1-3Y UST ETF (SHY) barely positive.
Energy ETFs (XOP, XLE, AMLP) were winners in the top 3 slots of the high quartile with Base Metals (DBB) seeing some relief. Banks had a very strong earnings season with Financials (XLF) also in the top 5. The S&P 500 lagged in the 2nd quartile behind the Equal Weight S&P 500 ETF (RSP).
We see the toll taken by the downside volatility in tech and notably semiconductors in July. As we detail in the next chart, the Semiconductor ETF (SOXX) posted -21.2% for the month, and that flowed into the Tech ETF (XLK) above, which sat in 2nd to last. Software saw some relief in July with the Software ETF (IGV) at +4.39% after some ugly earlier months, but tech overall was a drag in broader context with NASDAQ in the bottom quartile above and the same for the Equal Weight NASDAQ 100 (QQEW).
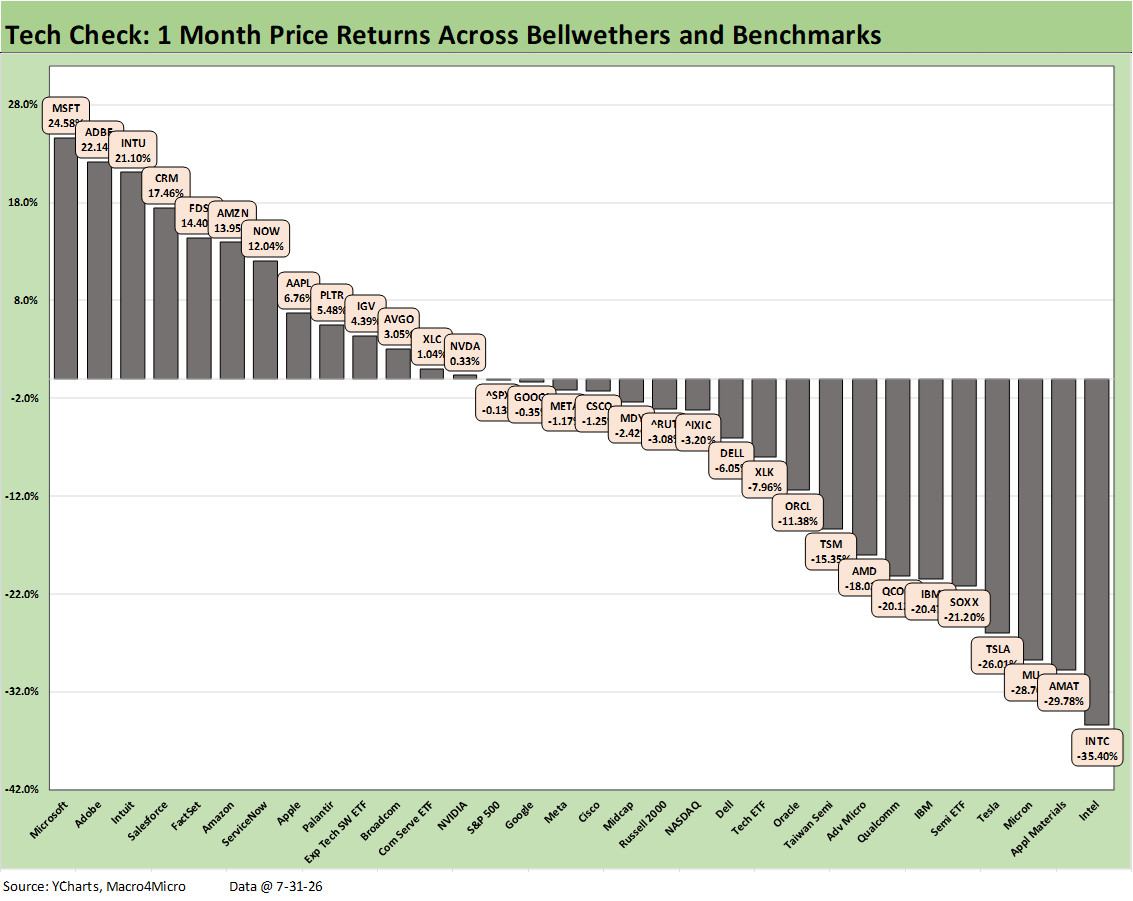
The 1-month tech check list shows a July that hammered some of the big YTD leaders with the semiconductor winners taking a major step back. The bottom 3 are semiconductor-related asset lines with Intel (INTC) in dead last at -35.4%, the capex-driven Applied Materials (AMAT) at -29.8%, and Micron (MU) at -28.7%. To highlight the crazy swings in price, the YTD returns on those 3 names including this abysmal month shows MU at +188.4%, INTC at +144.4%, and AMAT at 97.5%. We detail all those YTD numbers in a separate chart herein.
On the winners’ side of the returns, July was a great month for Microsoft (MSFT) in an otherwise bad year (-3.91% YTD). Adobe (ADBE) was #2 at +22.1% in a partial comeback theme for more software names. Even after this strong month, ADBE is -28.4% YTD. At #3 we see Intuit (INTU) at +21.1%, but INTU YTD returns are in last place at -52.3%. Those types of swings lower confidence in a rational approach to valuation. That is especially the case around the dramatic swings in software and SaaS names as investors raise fears of business model displacement.
Meanwhile, over in the AI ecosystem, there will be plenty of anxiety around infrastructure logjams (notably power and data centers) and the rise of low-cost AI models as we saw in the headlines this week. Taking all that noise and generating a rigorous volume and pricing model for AI ecosystem entities is no small task.
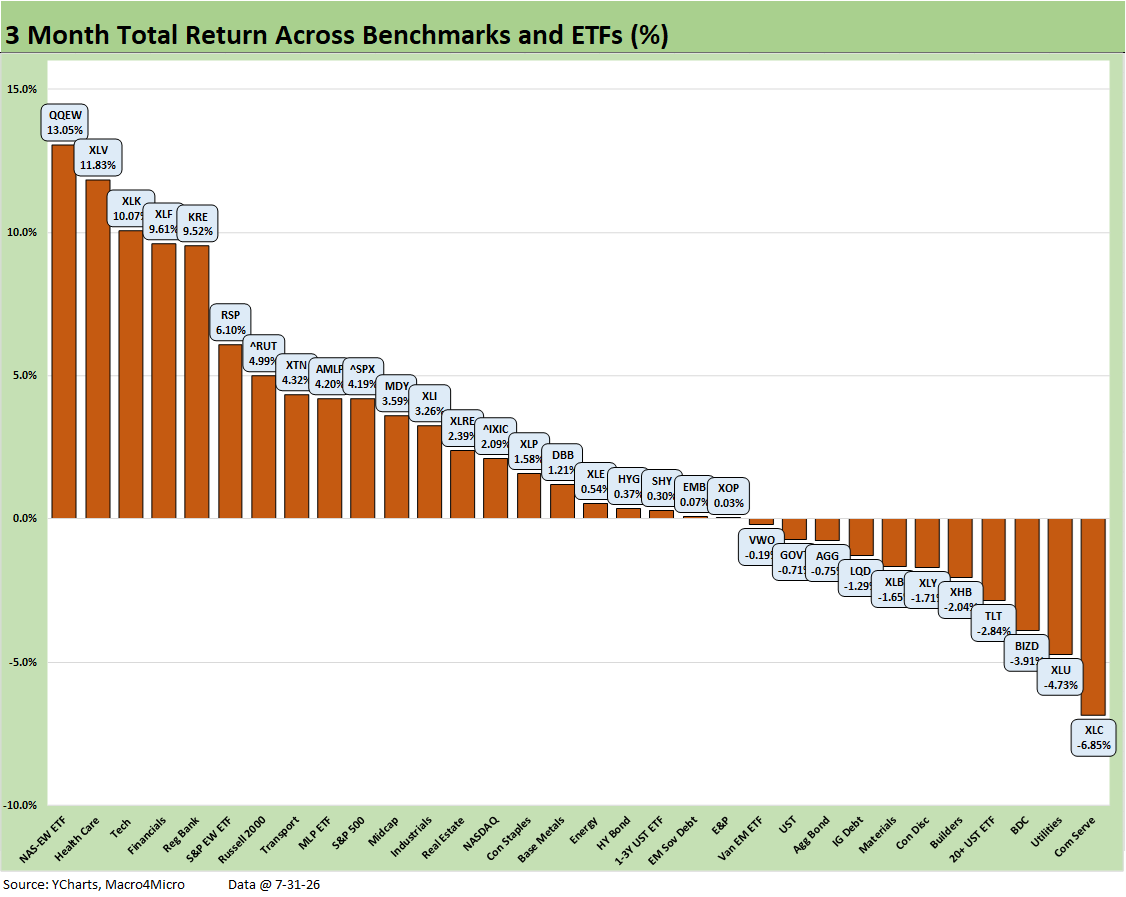
The above chart looks at the rolling 3 months for the broader group of 32 benchmarks and ETFs. We see a score of 21-11 with tech overall showing good performance despite the troubles of June and July. May was very kind in context (see Market Commentary: Asset Returns 5-26-26).
We see the toll taken on numerous asset classes from the adverse UST shift with 4 of the 7 Bond ETFs in negative range and the remaining 3 all under +0.4%.
We see the tech asset lines at #1 (QQEW) and #3 (XLK) and 2 of the top 5 in financial sectors (XLF, KRE) along with Health Care (XLV) in what is a healthy mix. The Equal Weight S&P 500 (RSP), the Russell 2000, and Transports (XTN) round out the top quartile in a reminder the market is not wholly tech-dependent even if the economic cycle is getting a lot of support from the multiplier effects of the capex boom and high fixed investment (see 2Q26 GDP: Good Underlying Numbers Despite Headline 1.5% 7-30-26).
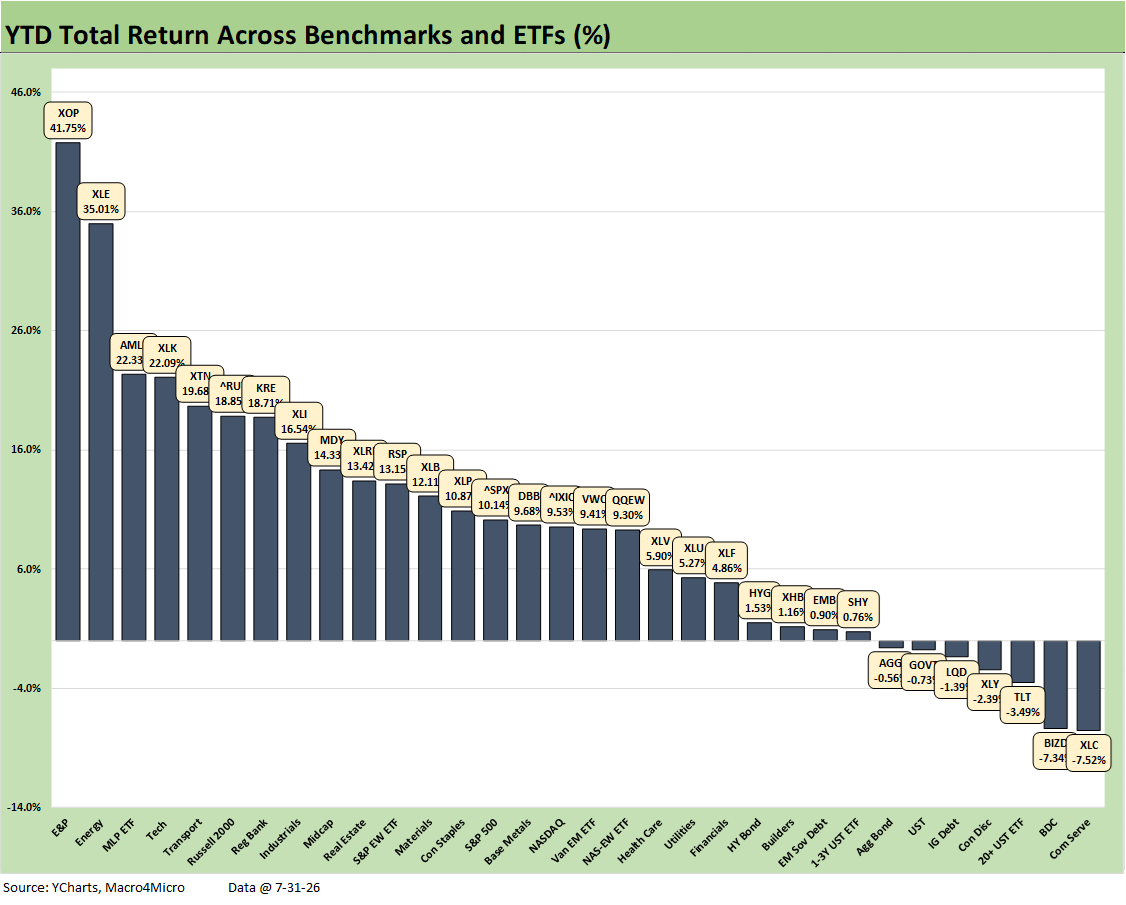
The above chart details the YTD return for the broad group of 32 benchmarks and ETFs with a score of 25-7. The bottom quartile shows 5 of 8 in the bottom tier being in the bond ETF group as duration was punished by the UST curve moves. We detail those UST deltas in a separate commentary (see The Curve: Steeper, Inflation Anxiety Remains 8-2-26).
The bottom quartile includes Communications Services (XLC) in last place below the BDC ETF (BIZD). The Consumer Discretionary ETF (XLY) is also in the negative zone. XLY was hurt by Tesla (TSLA), Lowe’s (LOW), McDonald’s (MCD), and Booking Holdings (BKNG) among others.
The winners in the top quartile include the top 3 as energy names with E&P (XOP), Energy (XLE), and Midstream (AMLP). Tech (XLK) placed #4 with Transports (XTN) rounding out the top 5. Russell 2000 small caps made the top quartile ahead of the S&P 500 and NASDAQ in the lower half of the 2nd quartile. Rounding out a well-diversified top quartile was Regional Banks (KRE) and Industrials (XLI).
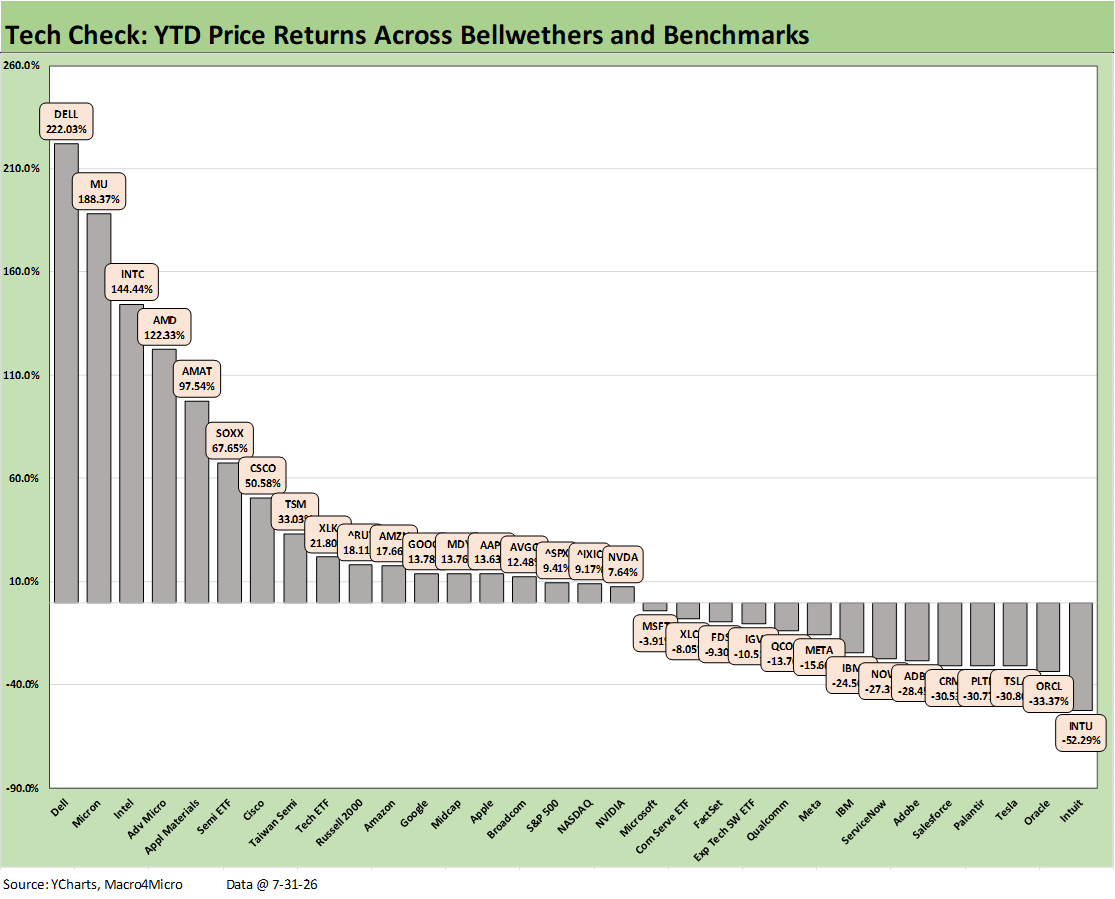
The YTD tech check list provides a stark reminder of what an amazing year it has been for semiconductors and other tech subsectors that are directly in the demand crosshairs of the AI ecosystem such as Dell and Cisco. We see Dell (DELL) at +222.0% and Micron (MU) at +188.4%. It took +97.5% to make the top 5 with Applied Materials (AMAT).
We also see how tough the year’s negative themes have hit software with 6 of 8 names in the bottom quartile in the Software/SaaS subsector joined by Tesla and IBM in the bottom. The top of the low quartile was IBM with -24.5% down to last place Intuit (INTU) at -52.3%. Oracle (ORCL) is one off the bottom at -33.4%. Palantir (PLTR), which reports this week, posted -30.7% and Salesforce (CRM) was at -30.5%.
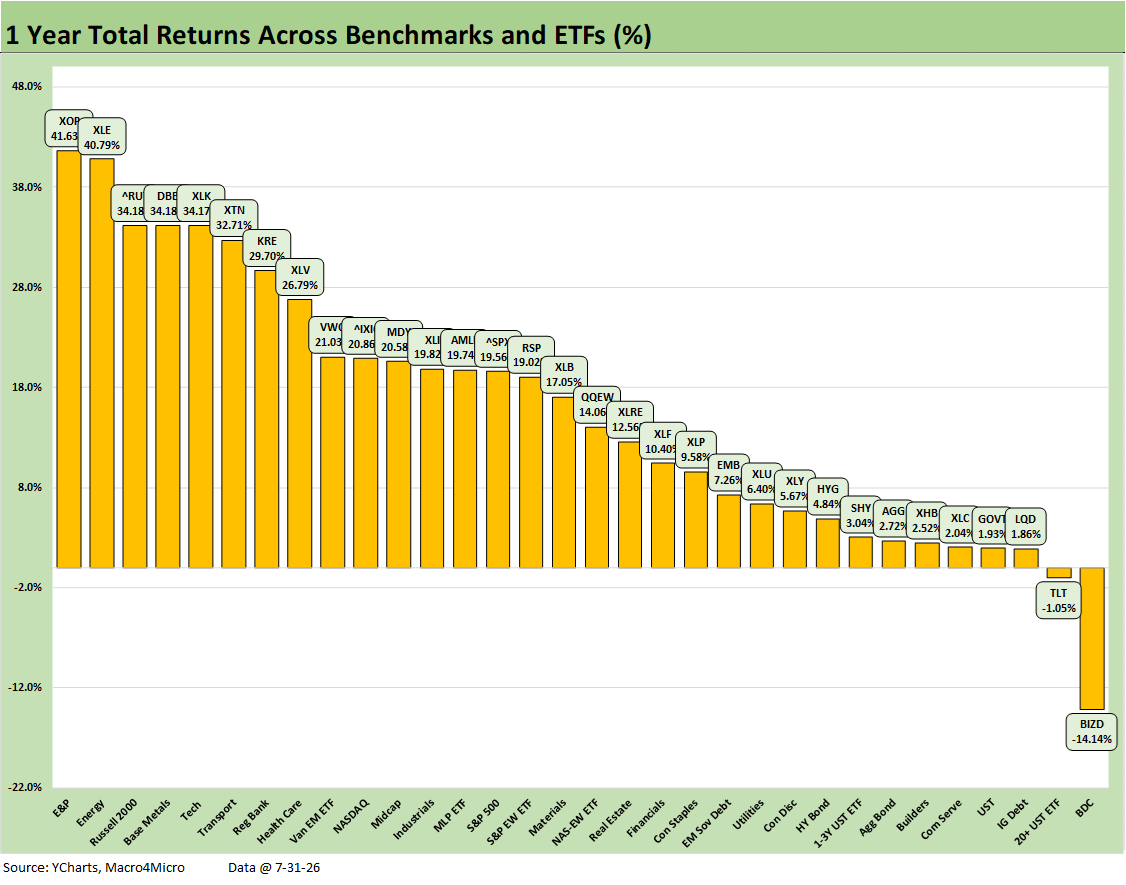
The above chart wraps up the LTM returns with a 30-2 score and only the BDCs (BIZD) and the long duration 20+ UST ETF (TLT) in the red. The median return was around +15.5% and it took +26.8% to make the top quartile. We see 5 of the 7 bond ETFs in the bottom quartile.
See also:
The Curve: Steeper, Inflation Anxiety Remains 8-2-26
Employment Cost Index June 2026: Inflation > Wage Growth 7-31-26
June 2026 PCE: Inflation, Income, and Outlays 7-30-26
2Q26 GDP: Good Underlying Numbers Despite Headline 1.5% 7-30-26
Market Commentary: Asset Returns 7-27-26
Yield Curve: Vegas Odds Keep Moving 7-26-26
New Home Sales June 2026: Soft Pricing, Tepid Volumes 7-25-26
Synchrony: Consumer Bellwether Reassures on Quality 7-23-26
Earnings Season Beckons: Homebuilder Stock Returns 7-20-26
Earnings Season Beckons: Comparative Auto Equity Returns 7-20-26
Housing Starts June 2026: 5 Units or More is Not a Crowd 7-19-26
Industrial Production June 2026: Sideways Syndrome 7-18-26
Company Profile: Ford Motor and Ford Motor Credit 7-17-26
Producer Price Index June: Still Hurts…Just Less 7-15-26
CPI June 2026: Eye of the Storm? 7-14-26
Existing Home Sales June 2026: The Stall is On 7-11-26
Employment Situation June 2026: Back to a Crawl 7-2-26
JOLTS May 2026: Openings Flat, Hires Down, Layoffs Up 7-1-26