

We detail the trailing shareholder timeline returns for the legacy Detroit 3 (asterisk on Stellantis) vs. the Japan 3.
Ford and GM post better numbers in comparative returns to the peer group over the past year with the US market somewhat of a ground zero for evaluating supplier chain and material cost risks in the new trade environment.
The pressure on consumers has not weighed very heavily on the new vehicle buyers in 2026, but the bias of forecasts is for moderate downside in light vehicle sales for the full year subject to what could go wrong if Iran and trade war risk go the wrong way.
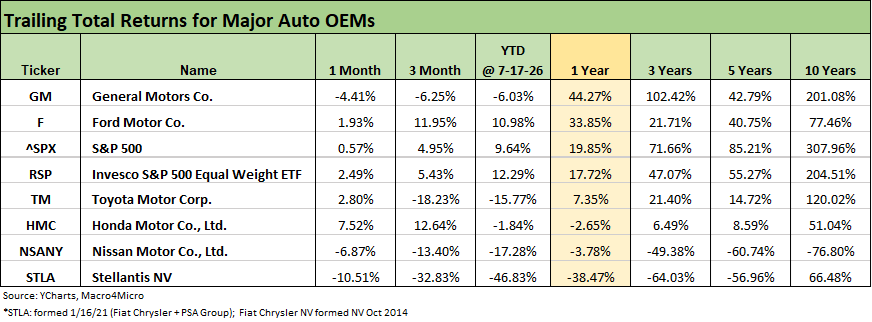
The chart details the running timeline equity returns for the bellwether high volume OEMs in the legacy Detroit 3 (Stellantis has an asterisk on that label) framed against the Japan 3 (Toyota, Honda, Nissan). We present a range of timelines and line them up in descending order of total returns for the trailing 1-year period.
With GM reporting on July 21, Ford teed up for July 28, and Stellantis for July 30, the market will get a chance to hear how the Iran fallout, tariffs, and higher consumer financing costs are playing out. Visteon also reports (July 23), but the major Tier 1 and Tier 2 suppliers generally report in following weeks. The color on how the materials and tariff effects are playing out will be important input. White House trade reps can do their spin, but double entry accounting is alive and well. Someone pays the costs in whole or in part along the chain.
The peak spring selling season is under our belts, and the expectations with gasoline price spikes hitting household discretionary cash flow will see some cause-and-effect details even if it is simple logic such as higher demand for hybrids. The yield curve does not promise cheaper retail financing or lower monthly payments on higher price vehicles. The supplier-to-OEM chain is facing mounting costs from tariffs and more expensive tech components (DRAM, etc.) in competition with the AI ecosystem.
Last week, we looked at Ford to tee up the recent history in model volume performance and Ford Motor Credit metrics (see Company Profile: Ford Motor and Ford Motor Credit 7-17-26). We had earlier done a similar exercise for GM (see Credit Profile: General Motors and GM Financial 10-9-25). Both Ford and GM are in very good shape.
Ford and GM have demonstrated operational resilience and strategic dexterity to adjust to a radical shift in trade and propulsion strategies created by the Washington whipsaw. The shift from the “War on ICE” (the other ICE) to the “War on EVs” was very costly and the political risk factors and erratic trade policy still lurk on the chalkboard (USMCA “review” and possible trade war or termination).
Long term strategy and intermediate tooling commitments and supplier contracts are hard to manage when the left vs. right whims tend to dominate the policy planning rhetoric. After all, these auto manufacturers make cars for Democrats and Republicans as well as for extremists on both sides of the political spectrum. They also employ a lot of both.