


Despite the temptation to extrapolate from AI and high related capex to a broader industrial boom and the “Golden Age” for manufacturing pitched by the White House, the numbers just are not there with capacity utilization in manufacturing below 2022, 2023 and 2024 levels.
On the other side of the partisan ledger, there is no sign of the vaunted “collapse” often cited as caused by Trump policy critics. Industrial production is steady even if manufacturing capacity utilization of 75.7% is well below the longer term median of 78.4% (post-1967). Capacity utilization is below shorter timeline medians of numerous prior cycles with 76% and 77% handles.
The theme is “steady as she goes” in another boring set of IP numbers in June. Total industrial production ticked higher MoM by +0.1% but up +1.1% from a weak set of June 2025 numbers. That said, the June 2026 capacity utilization of 75.7% is slightly ahead of June 2025 at 75.6%. That remains below the 1972-2025 average of 78.2%. We last saw 78% handles for a quarter in 2023 and a 77% handle in 2024 (back when Trump says the country was “dead”).
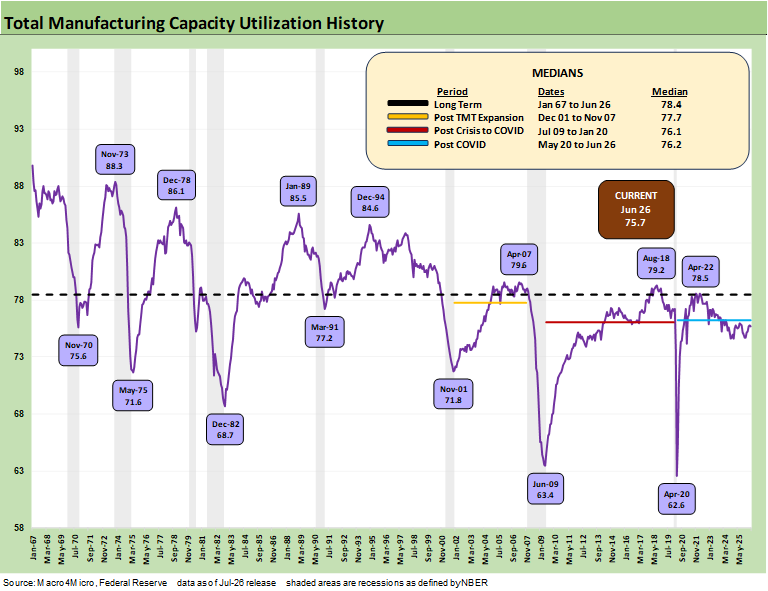
The above chart is somewhat of a regular replay of the history of the industrial production cycles across time from 1967 through today. We have covered much of this in the past, but we roll the historical recap forward for convenience. We get new readers and students all the time, so we use it as a mini history. For those used to this history, I added some new angles in this version but otherwise you can skip to the next chart.
Here’s a topical summary of the history sections:
A look at the top down utilization numbers…
A brief cyclical lookback on replay…
Bring on the tech boom and excess…
The credit crisis arrived in the summer of 2007 and peaked in late 2008…
COVID, ZIRP, and a license to print risk…
Time for the new age transition to AI plus some old school crises…
As an “old guy” who covered such industries as autos and steel credits back in the 1980s (and worked on a few audits of resources and energy companies), we have seen plenty of cyclical stress and secular shifts. I came of working age in the first stagflation wave and oil spikes of the 70s and early 1980s, and much of the “old and new” is evident these days. Cyclical change and secular trends always get mixed in, and the evolution (or collapse) of industries is not new. The manufacturing sector is wrestling with the tariff waves in a world with global supplier chains. Oil spikes are not new.
For June, the “business equipment” line of industrial production is doing quite well at +5.4% with “information processing” up by +8.2% in June YoY. Consumer durables are down YoY with the exception of the “home electronics” line (Table 1 of the release). Defense and space equipment is up by +6.5% but construction supplies only +1.5%. Within Industry groups, “computer and electronics” was +9.2% YoY. Overall, durables manufacturing in industrial production was +3.2% and nondurables was -1.1%.
A look at the top down utilization numbers…
The capacity utilization trends are covered in the charts below, but it is always good to keep in mind that there are two moving parts: capacity growth and the rate of utilization. Over/under expansion relative to demand can shape pricing power (e.g. semiconductors on a global scale).
The current 75.7% for total manufacturing utilization is well below the long-term median of 78.5% and below the post-COVID median of 76.2%. The industrial production and capacity utilization numbers are among many metrics that take the label of “greatest economy in history” off the table. Whether GDP growth or payroll trends, the current economy is a bottom quartile economy when the growth of the 1980s and 1990s are factored in (see Presidential GDP Dance Off: Clinton vs. Trump 7-27-24, Presidential GDP Dance Off: Reagan vs. Trump 7-27-24).
The wildcard for this current cycle is the scale of the fixed investment that is now ramping up around the AI ecosystem. The multiplier effects cut across the full array of products and services and extend across many major trade partners with Taiwan at the top of the list (see Taiwan: Stakes are High, US Awareness is Low 5-17-26, US-Taiwan Trade: Risks Behind the Curtain 2-1-26).
The consumer sector and PCE have been unimpressive, but fixed investment is now soaring (see GDP 1Q26 Final: PCE Growth Plunge 6-25-26). If you like comparing numbers (not a Washington thing) as opposed to spewing partisan adjectives, Trump 1.0 did not even frame up all that well vs. Carter and Biden – let alone the 1980s and 1990s (Gut Checking Trump GDP Record 3-5-25, Trump’s “Greatest Economy in History”: Not Even Close 3-5-25). Trump 2.0 is off to a slow start on GDP growth and payroll additions pale in comparison relative to the earlier glory years of the 80s under Reagan and the 90s under Clinton. That clear conclusion requires more numbers and less adjectives than we hear today.
A brief cyclical lookback on replay…
The chart shows the material swings across expansion booms and busts. That includes the aftermath of some highly damaging oil spikes that brought on cyclical weakness and later saw capacity utilization plunge. There were a lot more structural changes underway in those cycles than just oil and gas price pressures.
The pace of industry restructuring was notably the case in the 1980-1982 double dip as well as the recession of late 1973 to early 1975 when the Arab Oil Embargo set off chain reactions that turned the post-1973 period into an ebb-and-flow of macro nightmares for inflation and the consumer. Currency trends and labor costs were going through major changes across many years.
The May 1975 low of 71.6% followed the first bout of severe stagflation that unfolded after the Arab Oil Embargo. The 1980-1982 double dip recession came after the 1979 inflation spike took off with the Iranian oil crisis. The themes from Middle East wars or OPEC clashes (Iran vs. Iraq in the 1980s, Iraq vs. Kuwait/US in 1990) are being revisited today. There is room for conflict to get much worse with a wide range of potential geopolitical outcomes.
Capacity utilization saw a 68.7% low in Dec 1982 as the economy was just coming off the recession trough. The first Gulf War came after the August 1990 invasion of Kuwait with capacity utilization hitting a low in March 1991 at 77.2%, which is above where capacity utilization stands now in 2026. That takes some of the edge off the “greatest economy in history” hype.
Bring on the tech boom and excess…
The age of tech and credit excess in the late 1990s brought some new swoons with 71.8% in Nov 2001 after the TMT meltdown and HY default wave rolled in. The Utilities and Power sectors and Telecom capex all took a beating in that time frame.
We recently saw a market commentary comparing and contrasting the tech bubble of the 1999-2002 swing with today’s valuations in the AI ecosystem. That writer had referred to the tech bubble of 1999 as NOT a case of balance sheet pressures as his theory was simply about valuation metrics. We are not sure which tech bubble he was referring to during 1999 but he missed 2 of the 3 letters in “TMT”. He was using internet stocks as his focus. The internet stock bubble was very different from the debt-fueled telecom (T) and media (M) credit cycle and market implosion.
The telecom-related, debt-funded capex and balance sheet stress of 2000-2002 was ugly with many cash flow bleeders heading to chapter 11 and distressed debt restructuring that also brought industry consolidation. The credit stress was much higher and the counterparty credit quality was much worse in 2000-2002 than what we see today. That does not change the fact that 2026-2027 will remain highly dependent on raising much more debt to “finish the job” that is being built into revenue growth and earnings models. That is anything but assured. If the debt markets balk, the stock valuations will see a lot of pain.
The credit crisis arrived in the summer of 2007 and peaked in late 2008…
The next crisis in the manufacturing sector plotted above came with the post-credit crisis low of 63.4% at the recession trough in June 2009. Mortgages and derivative excess caused a very real systemic panic and deep risk aversion from the Lehman Sept 2008 period and well into 2009. Banks and brokers collapsed and the whole Ghostbuster scenario (“cats and dogs living together”) started to play out. Fears of cascading counterparty collapses rose as did worries around mass credit contraction hitting a broad swath of businesses. That in turn led to bailouts by the UST and protracted action by the Fed (see Wild Transition Year: The Chaos of 2007 11-1-22).
That period in late 2008 and into 2009 was famous for the bankruptcy and bailout of GM and Chrysler and how that reverberated across supplier chains from materials to components. TARP and late 2008 had already hooked up the “bailout infusion.” The credit contraction threat was very real, and the recovery in payrolls was slow to unfold with the consumer hammered by housing sector pain (Autos: War Stories & Anecdotes 9-22-23).
COVID, ZIRP, and a license to print risk…
COVID edged out the June 2009 utilization bottom with a record low of 62.6 in April 2020 and a wild 2-month recession. That pandemic period saw ZIRP, supply-demand imbalances and later the Russian invasion of Ukraine and ensuing oil spike that set off inflation and a tightening cycle that still did not trigger a 2022 recession. The Fed should get some credit for navigating that timeline even if late to the party.
In the context of manufacturing, the ZIRP brought a wave of refinancing and extension of liabilities, low cost of capital encouraging investment and pent-up demand that rewarded rebounding inventories and capex. Consumer financing was cheap and captive finance companies had credit that the finance sector was ready and willing to offer.
Time for the new age transition to AI plus some old school crises…
As we detail below in the recession histories, the idea of what is low or high for capacity utilization in the context of corporate sector profitability is not as direct as one might think. Breakeven volumes, cost structures and pricing power are key drivers of profits.
The tariff excess as a core Trump policy only makes that unit cost analysis more complicated as we head into a new round of energy-related cost pressures in 2026. Material costs (notably petrochemicals, base metals), operating costs for companies, and consumer discretionary household cash flow headwinds make for a tricky set of moving parts shaped by erratic geopolitical decisions.
The AI upside as well as the fallout and related fears is a new variable in the mix that cuts across both the services and goods sectors. What AI will mean for productivity improvement vs. payroll contraction will be an ongoing test of theories. Even if AI proves true to the valuation promises and brings a “revolution” to the economy, many will also pay the price.
Revolution is a term often associated with a body count (even if jobs and not KIA). We have been getting a taste in the recent SaaS services panic. Those SaaS services markets consume a lot of goods and have a lot of employees. Total paychecks drive PCE, which is 68% of GDP.
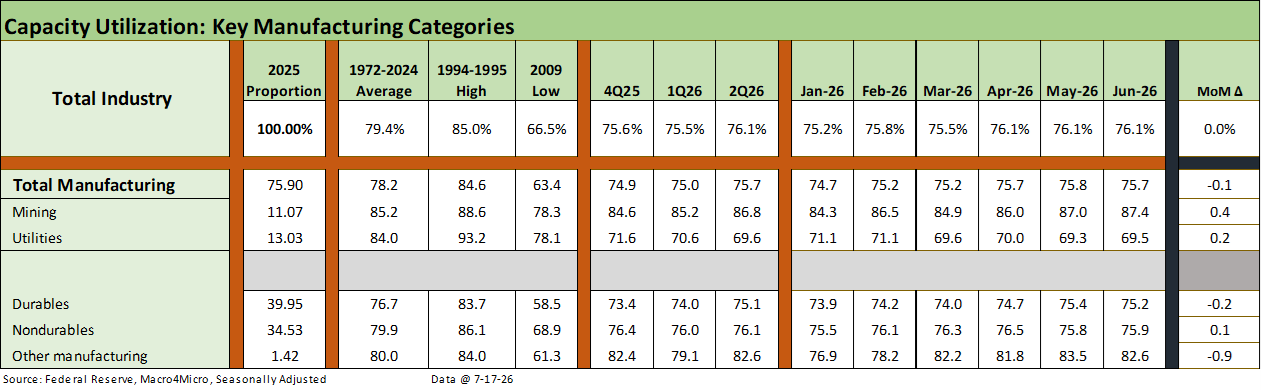
The above table breaks out the high-level groupings with total industry and total manufacturing posting a mix of positive and negative variances in June 2026. We include a “delta column” on the right.
Mining and Utilities moved higher for the month, and the rational expectation is that utilities will see more capacity added and more demand. The data center and power supply issue is more pressing and getting more political by the day in an area where there has been working class bipartisan anger around the side effects of such projects on power costs and water threats among other issues. That controversy has spread to Canada where we are seeing more legislative and regulatory battles around the data center capacity plans.
It may be local on a center-by-center basis, but it will find its way into an assessment of data center adequacy at some point for growth, AI ecosystem valuations, revenue models, and cost structures. Any sense of faltering optimism around volumes (e.g. international restrictions on AI), pricing power, regulatory backlash, or political risks (elections have consequences, etc.) could roil valuations.
We see Durables and Nondurables as the main events to track, and durables showed some aggregate weakness this month, ticking slightly lower as a group. The durables sector is especially important with all of the supplier-to-OEM multiplier effects of tariffs and oil spikes. Some industries will lose and some will win.
The IEEPA SCOTUS setbacks and recent attempts by Trump to counterattack by “creatively” using existing tariff legislation is struggling in the courts. Trump goes to “Plan B” and “Plan C” in his attempts to cut Congress out of the tariff decisions. He is hanging his hat on Section 301 and has invoked “forced labor” rules as a loophole. He recently threatened France with triple digit wine tariffs even without IEEPA. He seems to forget the EU works as a bloc. He also threatened Canada over wildfire smoke even as the USMCA is up for review.
Looking back from 2025 into early 2026, we see Manufacturing in a relatively narrow range and the same for Durables. Tariffs have not moved the production needle much so far, but that does not tell the profitability story on the tariff cost impact. Most people (outside the White House) know that buyers/importers write the check for the tariff, so that implies a higher breakeven volume or some offsetting actions in other costs or pricing.
Those tariff impacts will only play out over time across working capital cycles. Pricing decisions are more likely to come at a lag given the White House pressures, so there is a lot more to play out in 2026 earnings seasons and in company color ahead of FY 2027 when midterm results will be in hand.
The inflation story has turned into a negative variable for the macro picture in 2026. The “good news, bad news” aspect of a resilient industrial sector is that higher input costs can lead to the exercise of pricing power that flows into inflation. That beats the stagflation alternative but will keep life challenging for the FOMC and “Team Warsh” (if he can assemble a supportive voting team).
The Iran effects eased up in June and now are heading back in a negative direction in July. “War is hell” but it is also very unpredictable for macro effects.
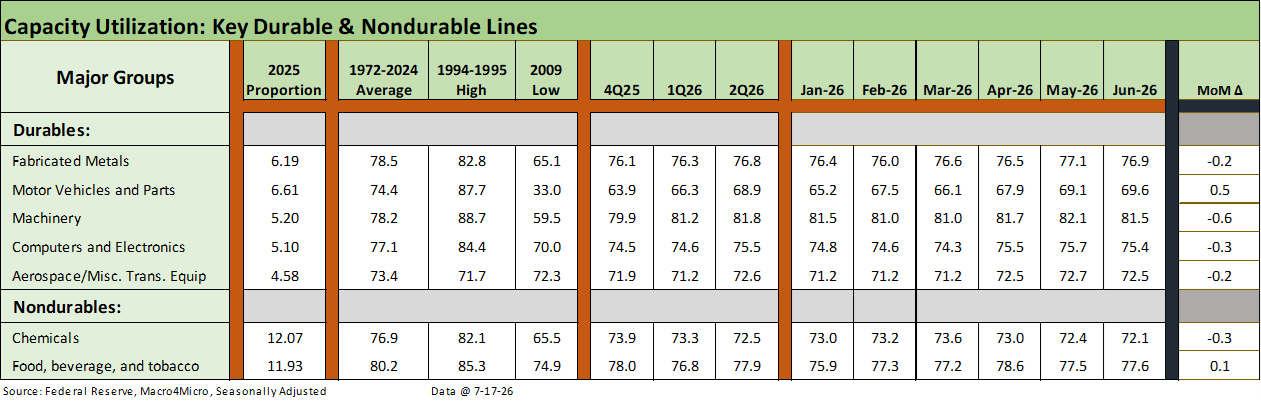
The above table breaks out the details for the top 5 Durables lines and the two largest Nondurables lines. We include the capacity utilization deltas in the column on the right. We see more negative moves across all the major durables industries with 4 of 5 lower. “Motor Vehicles and Parts” moved higher. The two major Nondurables lines were split with Chemicals down and Food, Beverage and Tobacco slightly higher.
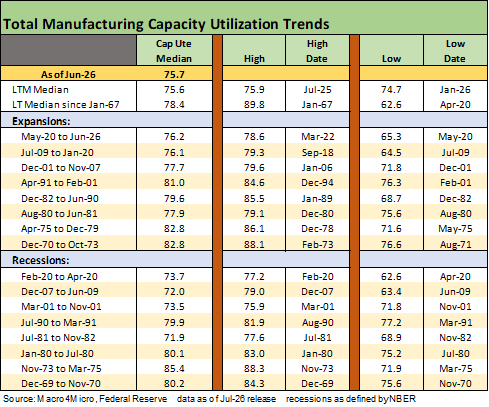
The above table updates the capacity utilization history for expansions and recessions. As we routinely discuss, the ability of companies to generate solid profits at lower capacity utilization in today’s markets relative to past cycles is tied to both automation and the evolution of low-cost global supplier chains.
Low-cost supplier chains are getting severely undermined by tariffs and are now facing supply chain headwinds from the Iran War energy effects and the related supply-demand imbalances.
The “AI story” and what it all means for productivity and headcount will be a big part of the risk analysis ahead. The natural outcome will be less jobs in a service intensive economy such as the US. The irony is that the most immediate impact on jobs has been in tech, but that payroll retrenchment can easily spread.
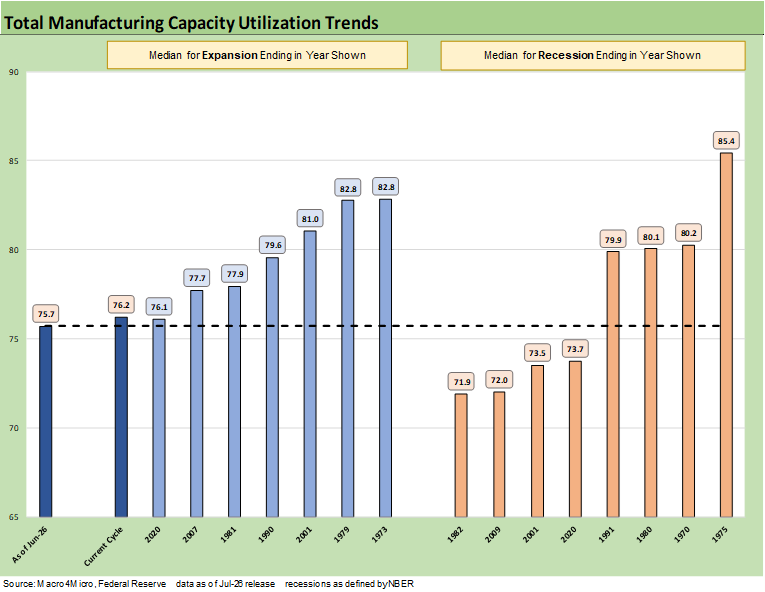
The above chart details economic expansion and recession averages and lines them up by height as a frame of reference. We see the current level on the left at 75.7%. The fact that the current capacity utilization is below numerous recession averages posted on the right side of the chart also scoffs at the recurring “Golden Age” and “hottest country” rhetoric.
In the context of the tariff priorities and reshoring ambitions, the slack capacity implied by the chart in historical context underscores that the analysis is a lot more complicated than just “build more plants” and “keep tariffs high” to force reshoring. That is a story told on an industry-by-industry basis. It gets into themes around pricing power, cost structures and sourcing risks (tariffs, etc.). These days the topical questions revolve around “AI winners and losers” in productivity and the relative ability to adjust and engage in tariff cost mitigation strategies.
The multiplier effects are important, but the relocation of supplier chains and OEM assembly relocation and retooling is by definition very slow to unfold given intrinsic lag times, tooling equipment, and contracts in place. It is a slow and painful process battling against the reality of automation and downsizing in some industries.
Manufacturing jobs edged slightly higher in June 2026 on a MoM basis by +3K but remains lower YoY by -38K (see Employment Situation June 2026: Back to a Crawl 7-2-26, JOLTS May 2026: Openings Flat, Hires Down, Layoffs Up 7-1-26). If we look back to the end of 2024 (Dec 2024), manufacturing jobs are lower in June 2026 by -160K. If we go back to Dec 2023 vs. June 2026, the decline in manufacturing jobs is -312K lower now with most of that in durables. That is not something to brag about. These numbers are all sitting in the BLS releases. Hassett or Bessent might want to take a peek as they toss around qualitative praise of themselves.
There is also the fact that the cost of relocation has risen with all the tariff effects for materials, components, and qualified labor. Autos are the main relocation stories, but that is generally going to be tied to existing infrastructure and not a strategy of all-new greenfield plants.
In the end, many companies can just wait for Trump to “move on” and revisit plans later. For autos, the attack on investment in EV related manufacturing has undermined some projects completed, in process, or in the concept stage. Fear of trade wars also can slow roll some reshoring and onshoring ideas.
The issues around the USMCA review and its fate effectively make planning much more difficult if not impossible to do with clear economic certainty on trade rules. Trump’s signaling that he may terminate the USMCA entirely regardless of any legal interpretations on whether his sole-actor decision is even legal. That adds more drama to a policymaking framework that does not lack controversy in the best of times.
See also:
Producer Price Index June: Still Hurts…Just Less 7-15-26
CPI June 2026: Eye of the Storm? 7-14-26
Market Commentary: Asset Returns 7-12-26
Existing Home Sales June 2026: The Stall is On 7-11-26
Happy 250th Birthday America 7-3-26
Employment Situation June 2026: Back to a Crawl 7-2-26
JOLTS May 2026: Openings Flat, Hires Down, Layoffs Up 7-1-26
Music to Ponder: Hope Rising or Blood Simmering? 6-30-26
The Election Gambit: Economic Risk and Policy Uncertainty 6-29-26
JD Vance and Nixon History: Clueless 6-27-26
Personal Income & Outlays May 2026: Bad Inflation, Balanced Spending 6-26-26
New Home Sales May 2026: Weak Volumes, Stable(ish) Prices 6-25-26
GDP 1Q26 Final: PCE Growth Plunge 6-25-26
Trade Deficits: The Moving Parts and Macro Goals Matter Most 6-24-26
The FOMC Dance: Will Warsh and Trump Find a Rhythm? 6-17-26
Housing Starts May 2026: Weaker for both Single Family and Multifamily 6-16-26
Geopolitical risk: Trump’s Nuclear Saber Rattling? 6-14-26
Remembering D-Day: June 6, 1944
The Fall of CBS 6-3-26