


Hear we go again. Another day, another slope conundrum.
The market was not impressed by Warsh’s long-winded noncommunication and smirks with the FOMC news this week. UST shifts have now taken the 30Y UST above the fall 2023 highs while the 10Y UST still has some room to maneuver with mortgage rates just above 6.8% or around 100 bps inside the Oct 2023 highs.
The UST curve shape is relatively common for the 2Y to 30Y UST slope across the cycles and for now is below the long-term median.
The inflation backdrop is a lot more challenging than some earlier cycles, however, given the moving parts of oil, war, and the scale of the deficits. The distance of CPI and PCE from inflation targets is a policy pressure point.
The potential for the AI frenzy to be gut-checked as a speculative bubble overlaps with UST risk in the face of record IG tech borrowing needs to fund the capex. Rising long rates also do not help the growth stock “valuation math.”
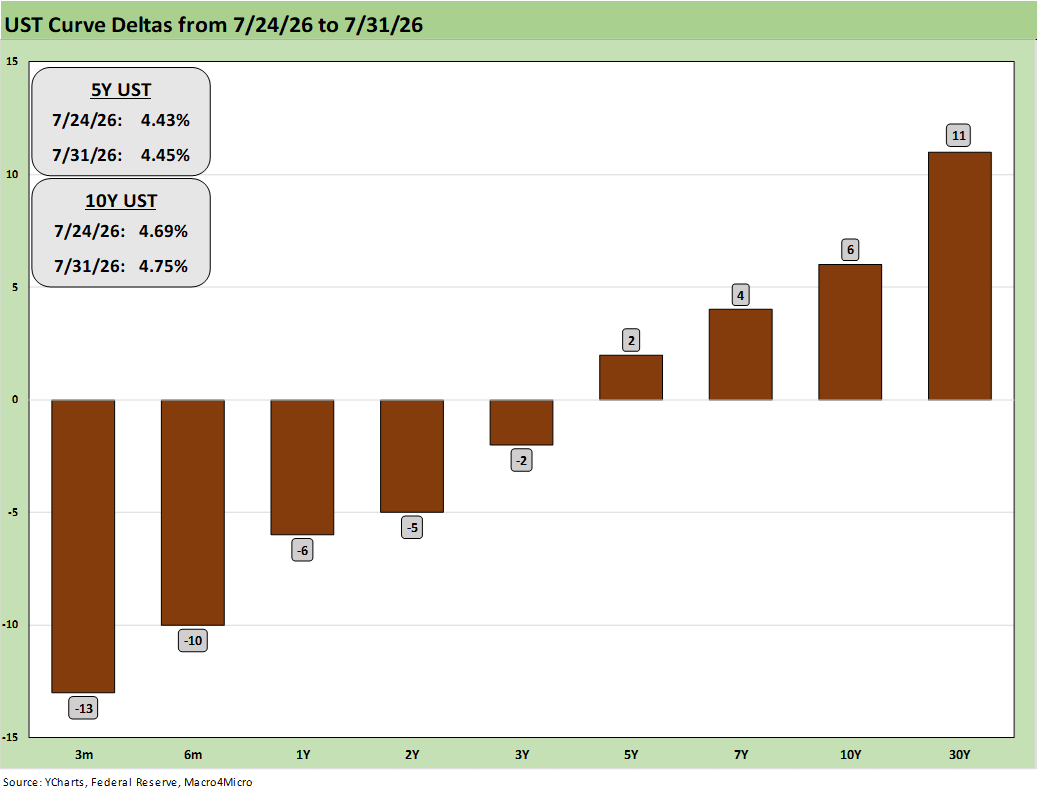
The above UST weekly deltas show the steepening beyond 3Y UST to 30Y combined with the rally on the front end as the FOMC made their decision to hold the line. Just a glance at the UST shapeshifting tells a tough story for housing (flow-through of 10Y UST into 30Y mortgages). Duration will bear the brunt and discount rate assumptions on growth stocks could get revisited.
The rising 30Y UST raises questions around the relative mix of variables driving rates higher across inflation expectations, UST supply vs. demand (notably offshore demand questions), or oil risks. This past week’s headline flavor included Japanese yen support and how those funds are sourced. There is always the budget deficit spiral with a spiking interest rate bill, soaring defense costs, and UST supply that will only get worse. Trump’s on/off Iran War escalation threats offer reminders of how easy it is to tack on an unexpected trillion or two on the deficits tab.
The fears of diminished UST demands or net selling offshore cannot be ignored when the US is working hard to get on the “world’s most hated list.” The supply and demand swing factor is always pricing. Trade partner clashes will likely create even more problems with the EU and Canada for UST holdings.
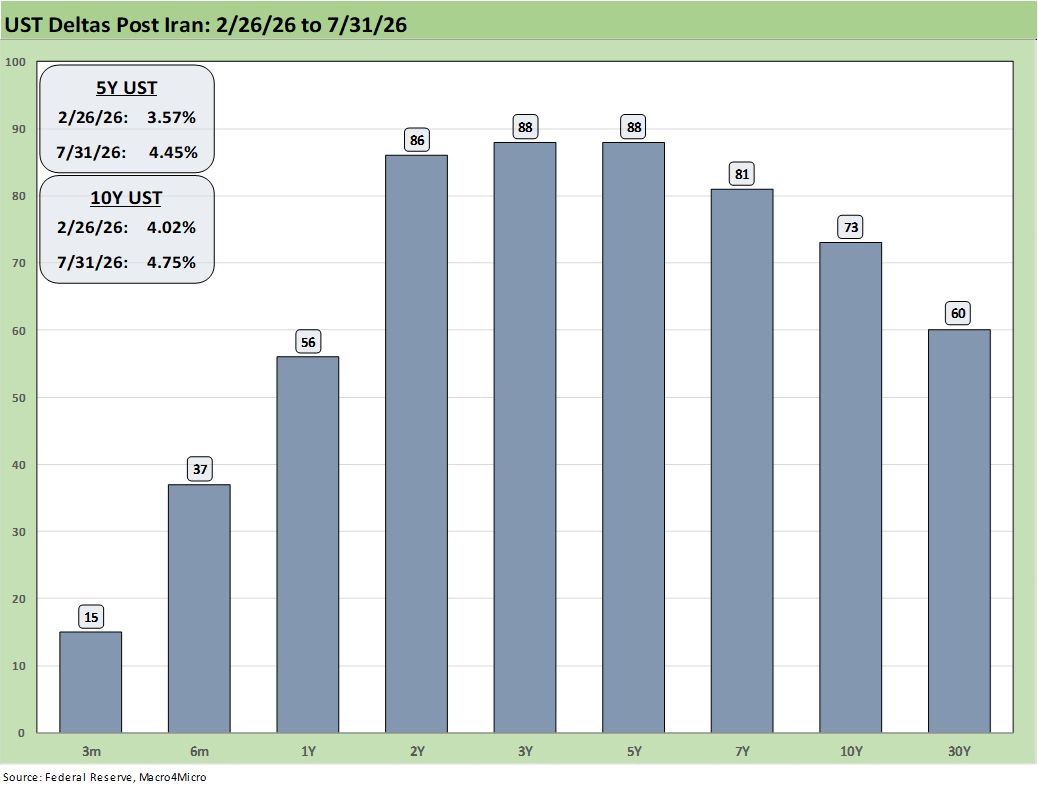
The above updates the post-Iran UST deltas (bombing began Feb 28) as inflation and anxiety over how pervasive energy effects cut across direct energy use (notably gasoline), materials costs (notably petrochemicals and downstream derivatives), and price passthroughs. Oil takes a toll on both headline and core inflation and hits a lot of cost lines.
Even those not around for 1973-1974 and 1979-1981 price spikes can at least remember the Ukraine impact after the late Feb 2022 Russia invasion. Team Trump never brings that up since that might entail deflecting any allocation of blame from Biden or Powell. That invasion did a lot of damage to a global commodity.
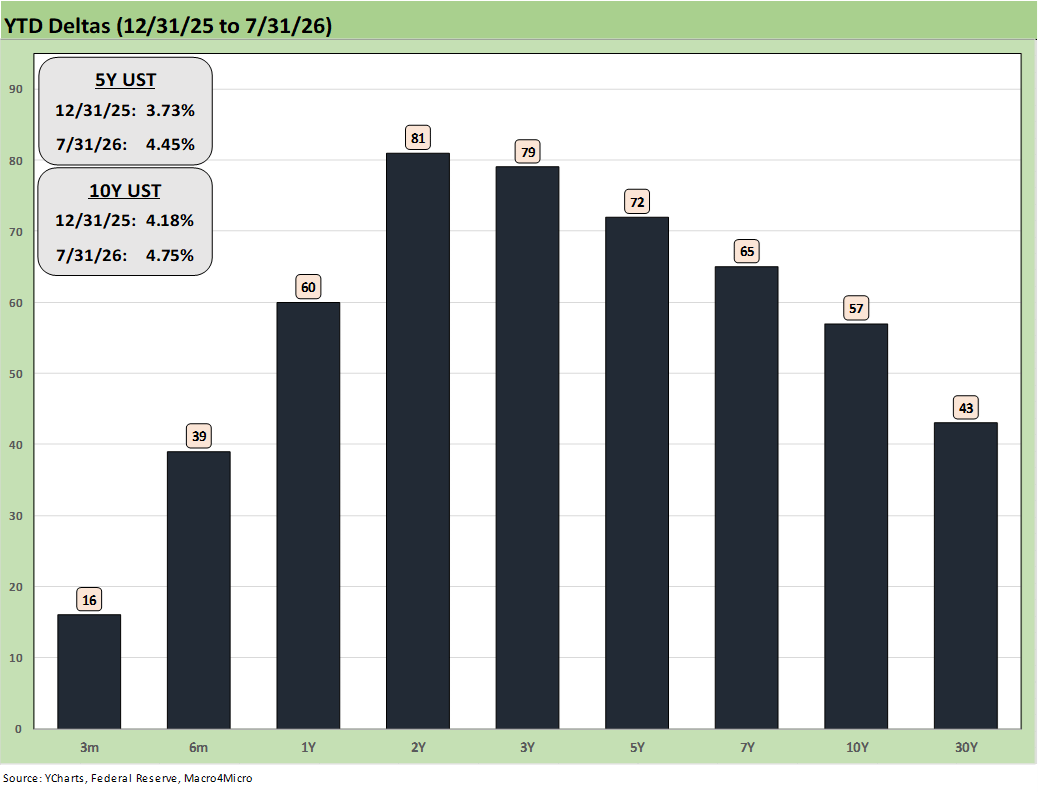
The above updates the YTD UST deltas with that move heavily tied to Iran. Duration and quality bond ETFs have been hit with 5 bond ETFs in the bottom quartile in our YTD asset return charts (to be updated and posted later). We see 4 of 7 in negative range with the long duration 20+ UST ETF (TLT) posting the worst return among the 7 bond ETFs at -3.49% followed by the IG Corporate ETF (LQD) with its longer duration posting -1.39% YTD, GOVT at -0.73% and AGG at -0.56%. That was not a winning formula for the bond allocation YTD given the UST curve action.
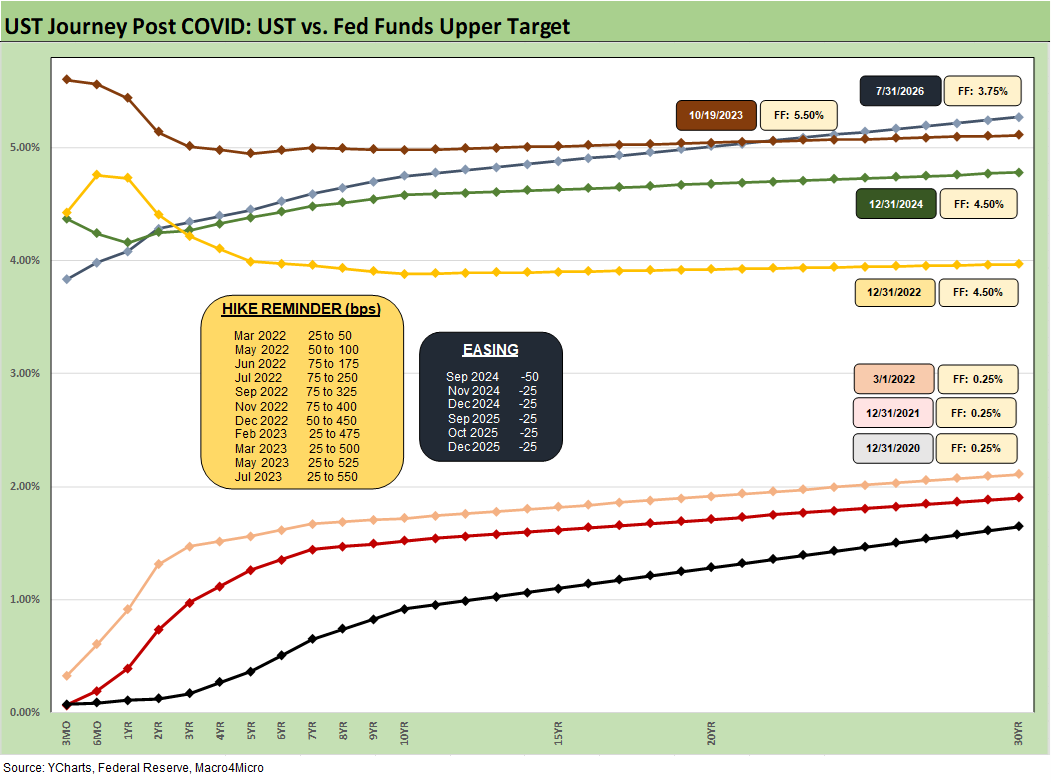
We include the UST migration chart again this week as a memory jogger on the upward climb from the end of 2020 as the COVID vaccine and ZIRP set off a wave of pent-up demand, risk taking, and supply-demand imbalances in the goods markets.
We roll forward that historical recap of the stimulus and COVID relief actions of the 2020-2021 period in our monthly PCE commentary, so we won’t revisit that one here (see June 2026 PCE: Inflation, Income, and Outlays 7-30-26). The collective weight of COVID, supply-demand imbalances (my favorite is 40% handle CPI on used vehicles and empty lots), and Russia-Ukraine is often downplayed and reverts to just the usual politics.
The bear steepening in 2021 was when the alarms were supposed to be going off at the Fed and notably in the fall as duration was getting pounded. This is where the “too late” criticisms of the Fed stick.
The UST curve took a beating after the 3-1-22 date as noted above. The long walk to 12-31-22 levels is glaringly evident in the above chart with the upper target of 25 bps (0% to 0.25% in ZIRP) moved all the way to an upper limit of 4.5% and a modest inversion at the end of 2022.
Then 2023 took the UST curve from 3M to 10Y to UST cyclical highs that also brought the Oct 2023 high of a 4.99% close on 10-19-23. Mortgages were a shade under 8.0% with some just above that level in that timeline subject to what mortgage survey you were looking at (Note: Freddie Mac typically posts lower rates on quality and structure, see Footnotes & Flashbacks: State of Yields 10-21-23).
As noted in the 7-31-26 yield curve in the chart above, we are moving back into the 2023 zone further out the curve with 10Y still below that peak but the 30Y UST above that period. The question for the UST oddsmakers is how many hikes we will see by year end. What will that mean for the 3M- 5Y UST segment?
There are plenty of questions to ponder. Will oil prices, steady cyclical fundamentals, more tariff pressures, a consumer recovery, and a desire for better wages get the FOMC alarmed? Will we see an upward parallel shift overall, more steepening, or a rise on the front end bringing a mixed flattener? We expect tightening and steepening on the balance of negative factors.
As we go to print, FedWatch is showing a 37.2% probability of 1 hike by the Dec 2026 FOMC meeting with the odds of 2 hikes at 42.1%. The odds of no change are 8.8% and 3 hikes slightly higher at 11.9%. The macro risks would need very bad outcomes for the inflation drivers to get the full curve back as high as Oct 2023, but the 30Y is already past that. The 10Y UST is the biggest threat to the housing market and mortgages, so that gets a lot of focus.
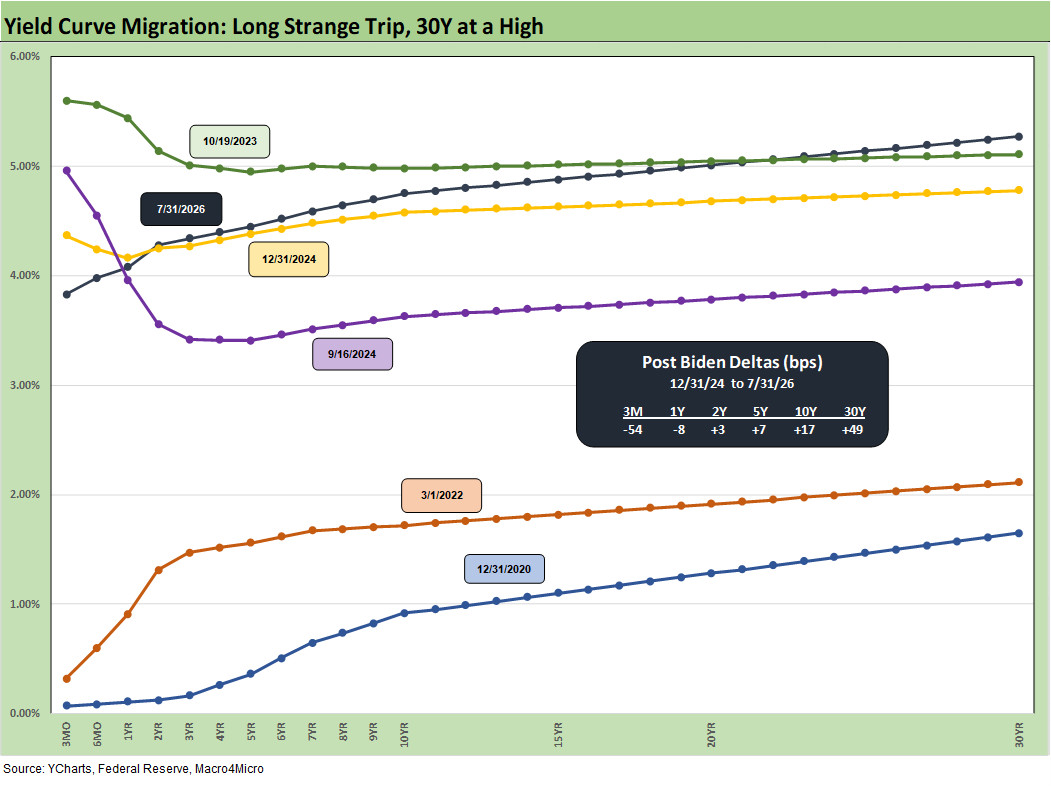
The above adds a few other angles to the migration history but zeroes in a bit more on the start of easing cycle in Sept 2024 when the UST rally saw an impressive move from the fall 2023 highs and the curve rolled into an impressive bull flattener. That market saw the 3M move lower from 9-16-24 while the 2Y to 30Y moved higher (notably in the 10Y to 30Y). The 3.6% 10Y UST of Sept 24 seems like a long time ago.
The late 2024 period into 2025 was an eye opener for many who were handicapping a sustained rally and flattener. Whether it was the underlying macro variables or the expectations that shifted with the election, the UST curve went into serious steepening mode by the end of 2024 on the way to where we are now.
The 2025 performance of the UST has been addressed often, and that also defied many forecasts from very serious market strategists and asset managers for a bull flattener. That most certainly did not play out in 2025 from the fall 2024 period (see The Curve 12-15-25).
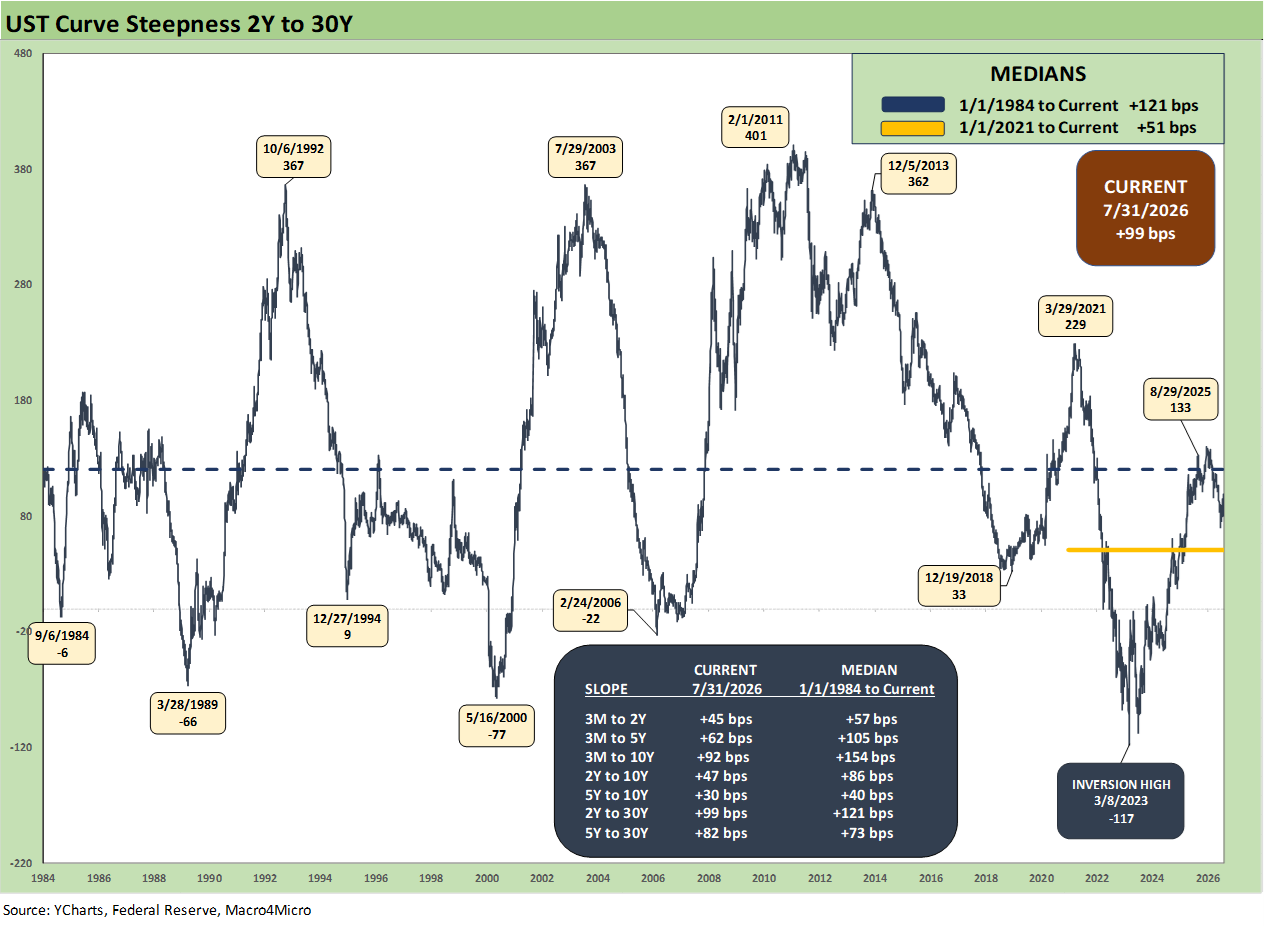
The above chart updates the history of the 2Y to 30Y UST slope that has received more than a little attention this past week. We update the historical medians for various curve segments in the box along with the timeline for 2Y to 30Y above. The +99 bps to end last week is comfortably below the long-term median from early 1984 of +121 bps.
The 2Y to 30Y slope has clearly seen dramatic swings across the post-stagflation Volcker years and into the steady rise in rates across the 1980s, the Greenspan easing years of the early 1990s and his post-tech bubble easing of 2001 (see Greenspan’s First Cyclical Ride: 1987-1992 10-24-22, Greenspan’s Last Hurrah: His Wild Finish Before the Crisis 10-30-22). As a reminder, Greenspan ran from summer 1987 to early 2006.
The trick with UST slopes such as 2Y vs. 30Y is to look at the absolute rate backdrop from the FOMC which dictates the short end segment. The ZIRP years and slow normalization before COVID took a lot of years and has distorted what constitutes “high rates.” (see UST Moves: 1988-1989 Credit Cycle Swoon 10-20-23, UST Curve History: Credit Cycle Peaks 10-12-22).
For the 30Y, the key drivers vary from inflation to supply. For example, the absence of supply late in Clinton’s second term helped drive an inversion. A lack of UST supply is not something we are likely to see again in my lifetime (or anyone’s lifetime who is walking the planet today). The steadily growing excess of supply from COVID to today is going to be around for years - and rising.
Some UST curve histories:
Business Cycles: The Recession Dating Game 10-10-22
UST Curve History: Credit Cycle Peaks 10-12-22
Bear Flattener: Today vs. 1994 and Aftermath 10-18-22
Fed Funds, CPI, and the Stairway to Where? 10-20-22
Greenspan’s First Cyclical Ride: 1987-1992 10-24-22
UST Curves: Slope Matters 10-25-22
Greenspan’s Last Hurrah: His Wild Finish Before the Crisis 10-30-22
Wild Transition Year: The Chaos of 2007 11-01-22
UST Slope Update: Some New Inversion Highs 12-8-22
Yield Curve Lookbacks: UST Shifts at Cyclical Turns 10-16-23
UST Moves 1978-1982: The Inflation and Stagflation Years 10-18-23