


AI: What could possibly go wrong? Going rogue?
With an FOMC meeting this week, an advance estimate on 2Q26 GDP, fresh PCE news for June on inflation and income and outlays, and 4 more Mag 7 earnings reports with related capex updates, there will be a lot for the market to digest.
As covered in our yield curve update posted yesterday, the news has not been good for duration and mortgages, so the sustained escalation in Iran will remain front and center on UST yields and steepening risks (see Yield Curve: Vegas Odds Keep Moving 7-26-26).
As we head to print today, the odds from FedWatch of no change from the FOMC this week stand at 59.7% with a 40.1% probability of 1 hike. If we look ahead to the odds of FOMC moves by the Dec 2026 meeting, we see 7.5% odds of no change, 31.2% for 1 hike, 38.8% for 2 hikes, and 19.2% for 3 hikes. That is not setting the table for good news in housing or in consumer finance. It also casts a cloud over “valuation math” and bond asset class performance.
On a positive note, corporate earnings remain strong in a busy reporting season, fixed asset investment has been exceptional with a heavy “AI” angle, and the consumer appears to be mending in 2Q26 from a grim 1Q26. Payrolls are steady, but real wage trends are ugly with savings rates lower. Housing is faltering.
The political muck and mire is not helping the legislative uncertainty risk, rational thinking on dealing with Iran is lacking, the direction of the deficit and UST supply is bad, and any hint of better relations with trade partners (notably Canada and EU) is diminished given the potential for tariffs. Ugly relations with allies could curb UST demand offshore, and tariffs could undermine purchasing power/affordability even more.
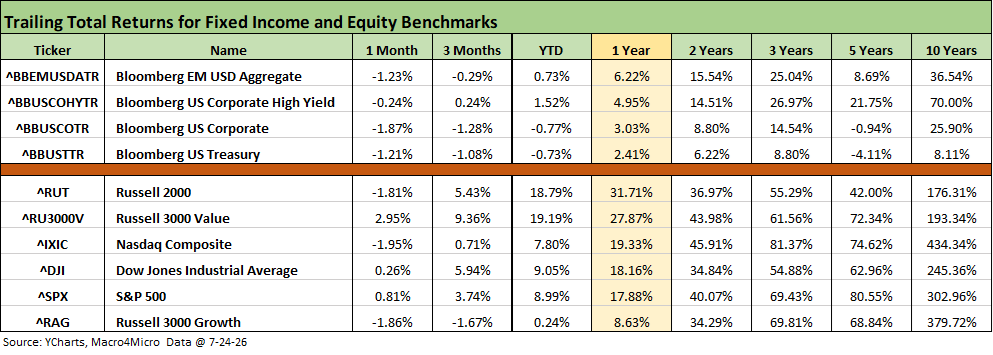
The trailing 1-month period has shown weak performance in both debt and equities as noted above. The UST curve has wagged the debt markets with rates rising with returns negative for the trailing 1-month and 3 of 4 negative for the trailing 3-month period. Only the shorter duration credit benchmark of HY bonds is slightly positive for 3 months.
The recent lagging performance in tech is addressed in other charts, but the main themes as we covered each week are the ebb and flow of software, which had mostly been ebbing. That contrasts with the record YTD returns for the semiconductor group even after the material declines of June and a few brief freefalls.
The weakness in NASDAQ and Russell 3000 Growth is evident in the negative returns. The Russell 2000 also faded for the past month after a solid 3-month move and very favorable YTD performance.
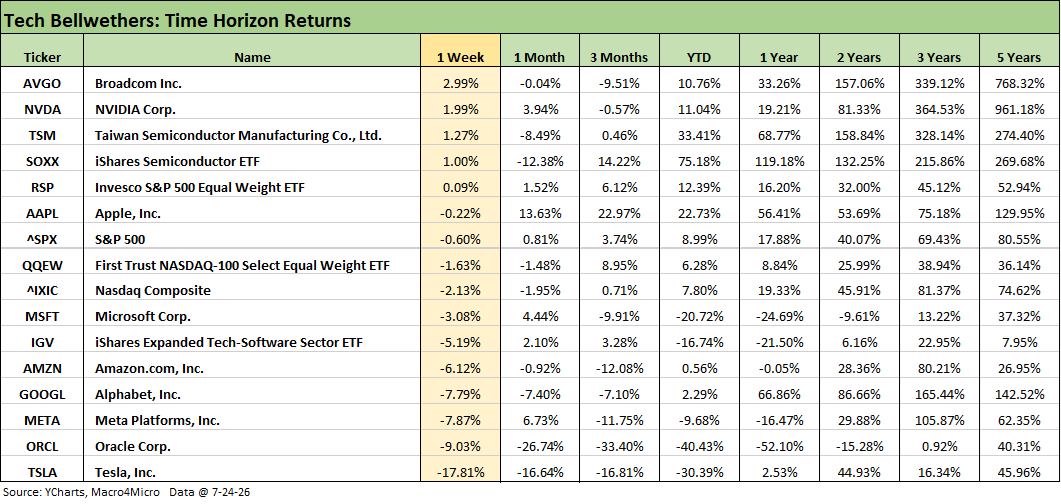
The tech bellwethers posted a relatively bad week in 2026 context with a subset of semiconductors posting good number but with 6 of the Mag 7 in the red. The Software ETF (IGV) was in the red while the Semiconductor ETF (SOXX) posted a positive return just below Taiwan Semi (TSM), NVIDIA (NVDA), and Broadcom (AVGO). Looking back for the rolling 3 months highlight the lingering effects from the steep June selloff.
The following is basically a cut and paste with some edits from the update posted on Saturday on LinkedIn:
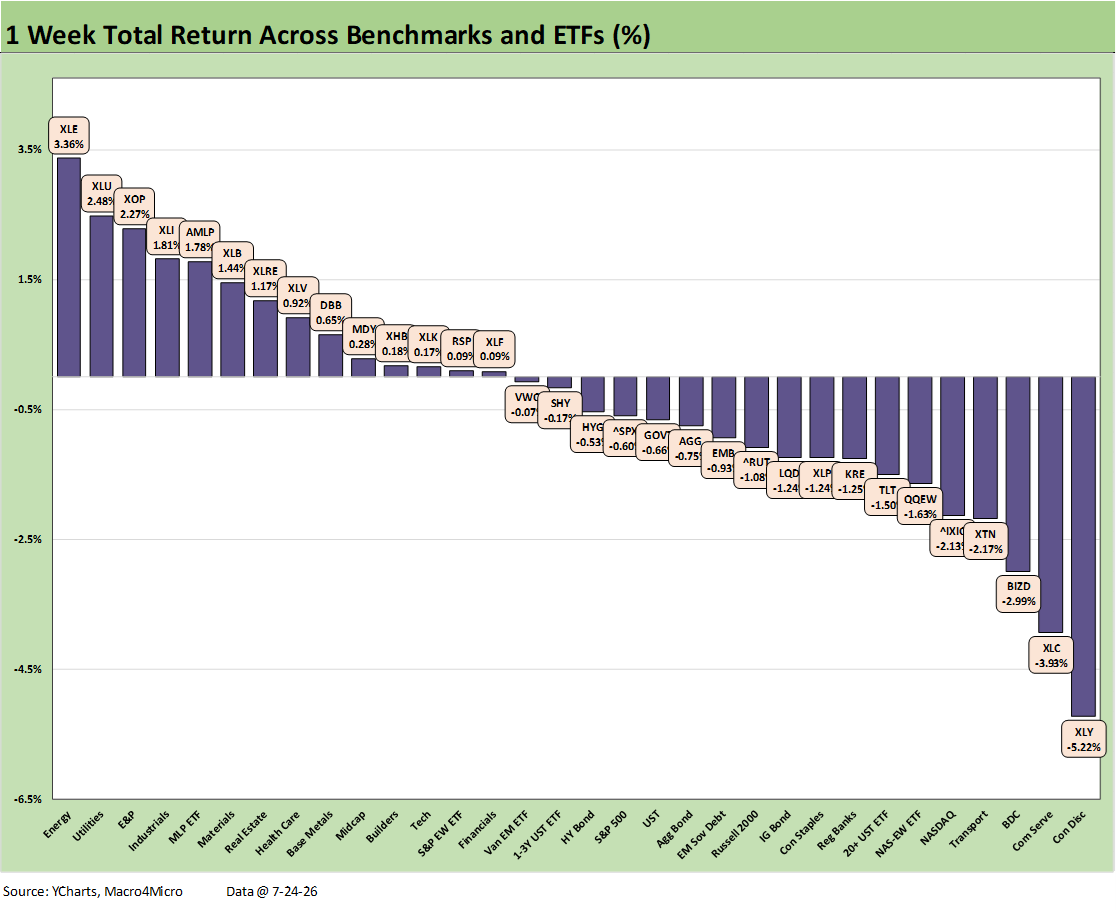
The chart shows a relatively balanced week for the group of 32 with a 14-18 positive-to-negative score, but it was a rough week for the large cap benchmarks (S&P 500, NASDAQ) and the Russell 2000. The S&P 500 had a very favorable score for the 11 sectors with 8 positive and 3 negative, but Consumer Discretionary and Communications Services were pummeled.
We saw Mag 7 getting hit hard as evident in some bellwether ETFs (XLY, XLC). Amazon (AMZN) and Tesla (TSLA) dragged down the Consumer Discretionary ETF (XLY) in last place while Meta (META) and Alphabet (GOOGL) took Communications Services (XLC) down to 2nd to last. XLC also was held back by Comcast (CMCA), T-Mobile (TMUS), and Warner Brothers (WBD).
The Mag 7 had only one name in positive range for the week with NVIDIA performing well but TSLA in dead last on our tech check list by a hefty margin at -17.8%. We look at the Mag 7 names in our separate tech check weekly return update.
The tech lines also see a mixed recovery in the semiconductor names that pulled the Tech ETF (XLK) higher in this group of 32. Despite the semis, the broader NASDAQ was mired in the bottom quartile, where it was joined by the Equal Weight NASDAQ 100 ETF (QQEW). Intel (INTC) was a notable exception in semi performance as its earnings report did not reassure. These days it seems if you raise capex people worry. If a major player cut capex, it could start a crisis.
Bond ETFs saw all 7 names in the red as the UST curve focused on noisy oil headlines, inflation fears, and renewed anxiety around UST supply risk. The PCE inflation numbers and FOMC meeting could create some new excitement this week, but the setback in Iran will have more looking ahead to July CPI and PPI numbers as oil has pushed higher again.
Among the winners, we see energy related ETFs in 3 of the top 5 slots with Energy (XLE), E&P (XOP), and Midstream (AMLP). Rounding out the top 5 were the Utilities ETF (XLU) and Industrials (XLI). The top quartile included Materials (XLB), Real Estate (XLRE), and Health Care (XLV).
On a mild, positive note for homebuilder exposure in the face of 6.8% handle mortgage rates, we see the Homebuilder ETF (XHB) stay in positive range in what has been a lower volatility sector of late. Pulte and DHI reported numbers that did not alarm despite the industry’s softer backdrop.
The following is basically a cut and paste with some edits from the update posted on Saturday on LinkedIn:
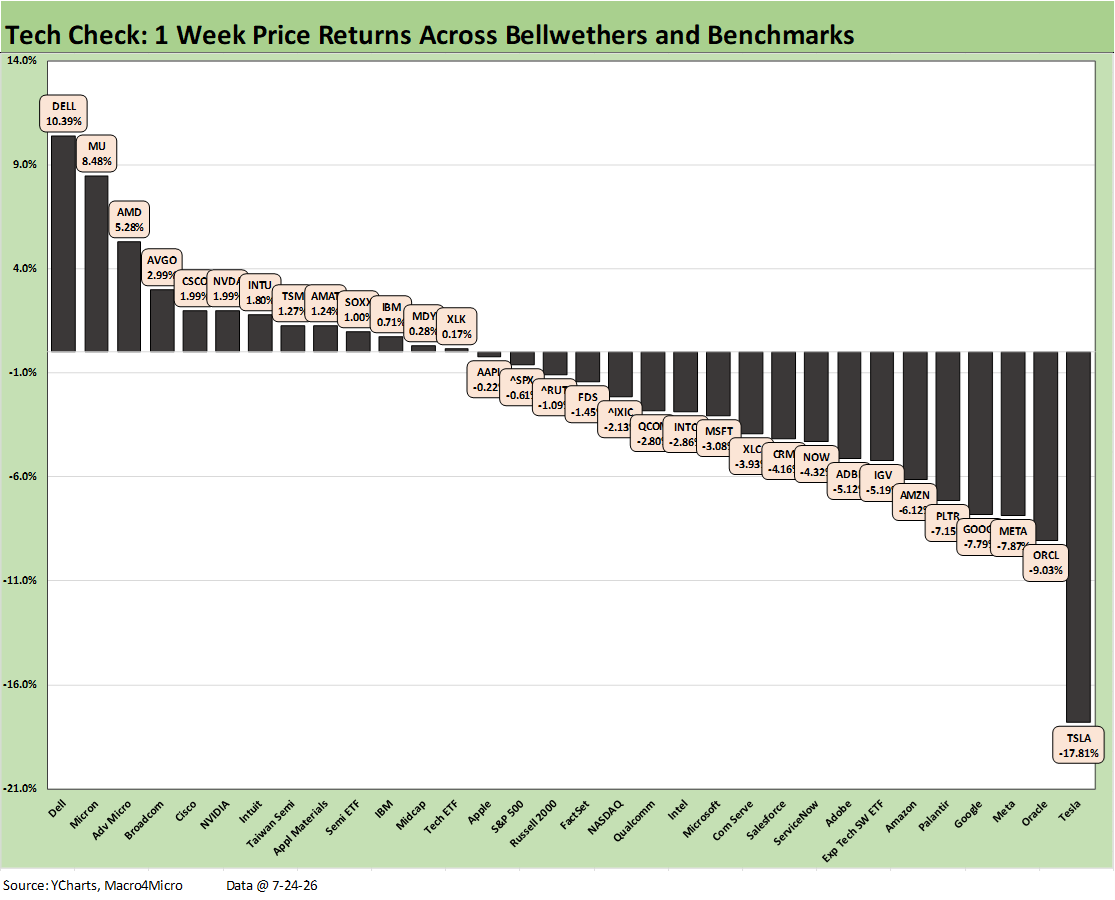
The chart updates the 32 asset lines in our tech check list of benchmarks, industry ETFs, and single names. The score of 13-19 was unimpressive with software and SaaS names again heavily in the red. We see 6 of the Mag 7 in negative return range along with NASDAQ, the S&P 500, and Russell 2000 in negative range. Only NVIDIA (NVDA) of the Mag 7 broke into the positive range for the week.
The most glaring outlier was Tesla in dead last with -17.8% or almost double the negative return of Oracle (ORCL) in 2nd to last as ORCL continues to struggle in 2026. The bottom quartile also includes Meta (META), Alphabet (GOOGL), Palantir (PLTR), Amazon (AMZN), the Software ETF (IGV), and Adobe (ADBE).
The Semiconductor ETF (SOXX) was in the upper end of the 2nd quartile with +1.0% as some major names such as Intel (INTC) were holding it back. INTC posted a -2.86% from the prior Friday close but was -14% intra-week with its earnings. The earnings tone some days seems to be higher capex is a problem even while lower capex could be a tragic setback in bullish growth scenarios built into valuations.
Among the AI ecosystem, the best performer was Dell (DELL) at #1 at +10.39% just ahead of Micron (MU) at #2 with Advanced Micro (AMD) holding down #3 with 5.28%. Rounding out the top 5 was Broadcom (AVGO) and Cisco (CSCO) with NVIDIA posting the only Mag 7 positive return just behind it at +1.99%. The only SaaS name to crack the top tier was Intuit (INTU) #7 while Taiwan Semi (TSM) wrapped up the top quartile.
We see a range of the numerous software and SaaS-based services names including half the bottom quartile with the other half from the Mag 7.
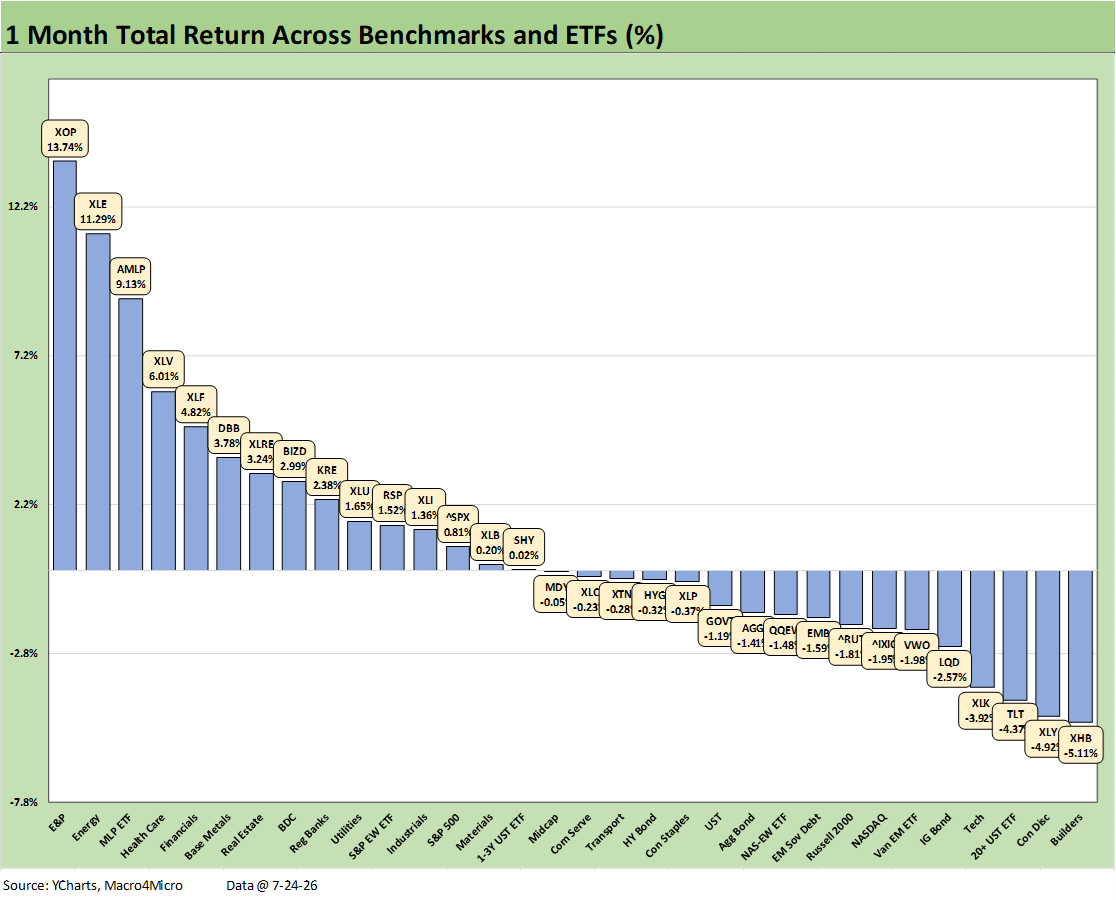
The 1-month period for the broader mix of 32 asset lines posts a balanced score of 15-17 with tech struggling for that period and the 7 bond ETFs showing 6 of 7 in the red with the short UST 1-3Y ETF (SHY) barely positive.
The bottom quartile has the Homebuilder ETF (XHB) on the bottom on mortgage rate pressure and weak macro color on housing. We also see Consumer Discretionary ETF (XLY) in second to last with Amazon and Tesla both in the red among major holdings. Semiconductors had a weak stretch during the volatility and that pushed the Tech ETF (XLK) into the bottom quartile.
Among benchmarks, NASDAQ and Russell 2000 ended up in the bottom quartile while the S&P 500 and Midcaps worked their way into the lower half of the second quartile.
It is not a surprise that the setbacks in Iran handed the first 3 slots of the top quartile to the energy lineup with E&P (XOP) at #1, Energy (XLE) at #2, and Midstream (AMLP) at #3. Rounding out the top 5 is Health Care (XLV) and Financials (XLF), where the major banks and regionals have posted some very steady and solid results.
Regional Banks (KRE) were just across the line at the top of the 2nd quartile. In addition, the BDC ETF (BIZD) made it into the top quartile ahead of their main earnings wave ahead. Real Estate (XLRE) made the top quartile in a good sign for how real estate is viewed.
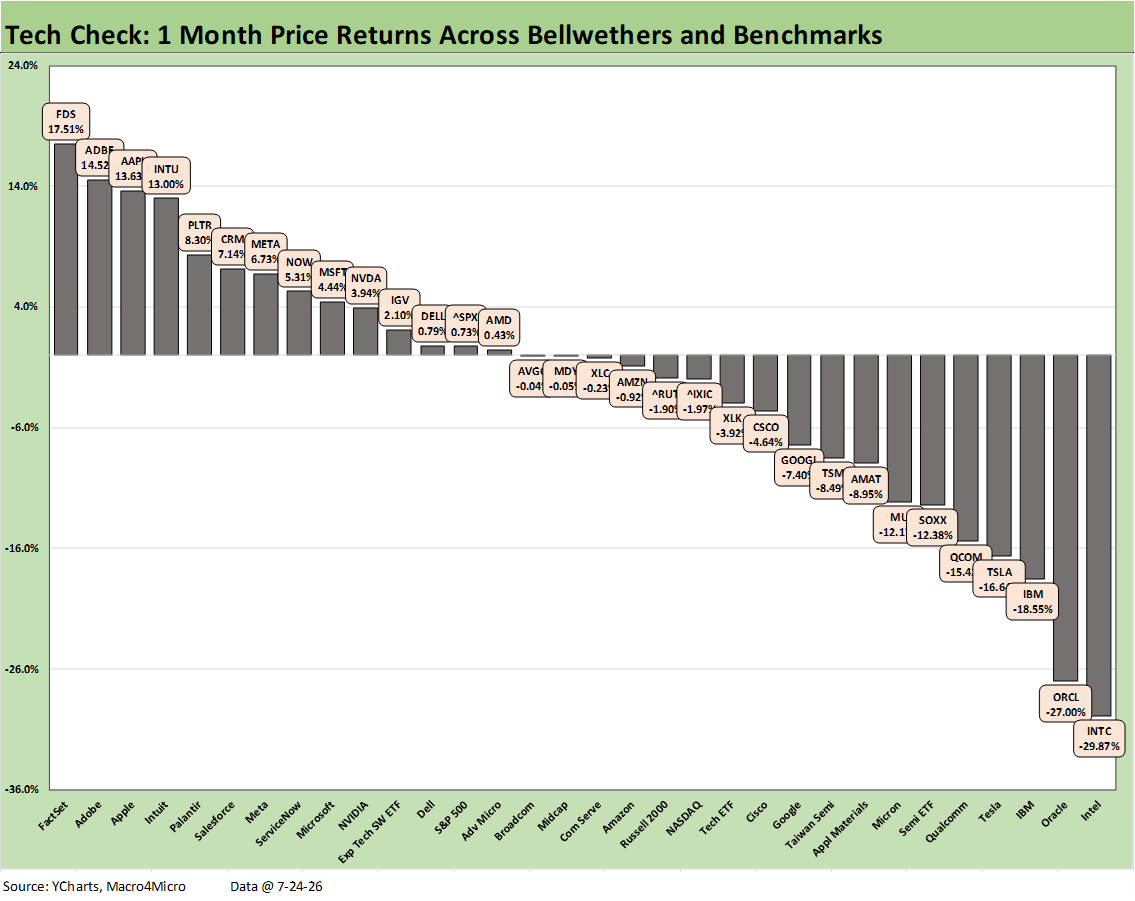
The 1-month performance of the tech check mix highlights the retrenchment after an amazing ride higher. A notable example is Intel (INTC) in last place after its earnings report even with strong earnings as some capex jitters always seem to surface. INTC was down by -29.87% for the month. That stock hit came after the 2Q26 earnings report beat estimates and was still banner success material. That said, INTC is still up by +150% YTD.
For tech, the AI ecosystem is in a place where rising capex can make investors nervous, but any hint of a pullback in capex might generate a crisis on the idea that “they must see something.” Any signs of the hyperscale giants stepping back or data center setbacks at the local level taking on a larger scale would challenge the unbridled optimism around investment in the AI ecosystem.
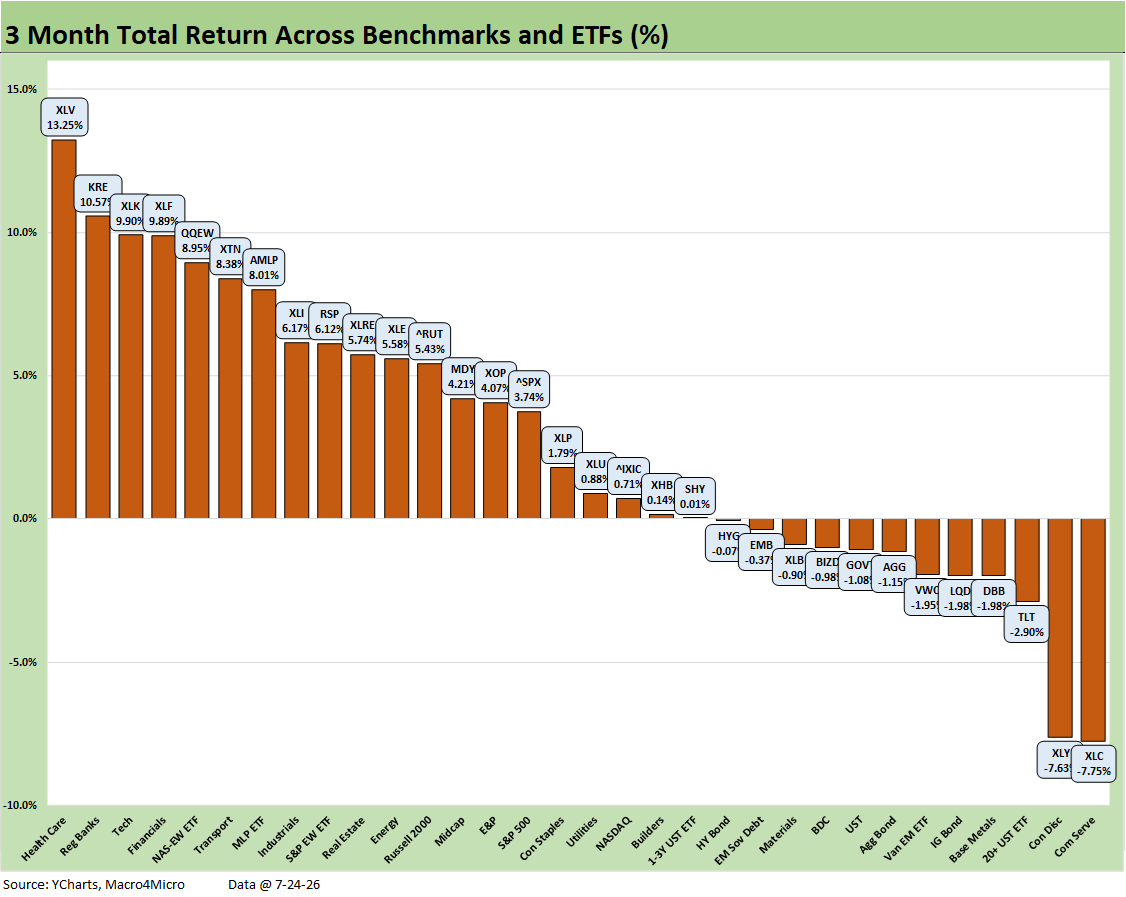
The 3-month returns for the broader group of 32 benchmarks and ETFs posts a score of 20-12. The bottom tier shows the Communications Services ETF (XLC) on the bottom with Consumer Discretionary ETF (XLY) in a near tie as both were dragged down by Mag 7 weakness.
We see the same mega cap and concentration challenge facing both XLC and XLY in the YTD performance chart that follows. The Mag 7 headwinds for XLC include Meta (META) and Alphabet (GOOGL) with large issuer concentrations while XLY numbers faced challenges from Tesla (TSLA) and Amazon (AMZN). TSLA, META, and AMZN were in double digit negative range while GOOGL managed high single digits in the red. XLC had the added pain of Netflix (NFLX) with around a -23% return over 3 months.
The adverse UST curve shift hit high quality and longer duration bond ETFs with 4 of the 7 in the bottom quartile and 6 of 7 negative. Only the short duration UST 1-3Y was positive (but essentially 0%). We also see the Base Metals ETF (DBB) as the brief easing in the Strait crisis offered some relief that may go in the other direction now.
The winners in the top quartile showed breadth of subsectors with Health Care (XLV) on top followed by Regional Banks (KRE) and Tech (XLK) in the top 3. Rounding out the top 5 were Financials (XLF) and the Equal Weight NASDAQ 100 (QQEW). XLK and QQEW offer a reminder of how strong the performance was in the spring given the beatdown that unfolded in June and recent weeks for numerous tech names. We also see Transports (XTN), Midstream Energy (AMLP), and Industrials (XLI) in the top tier.
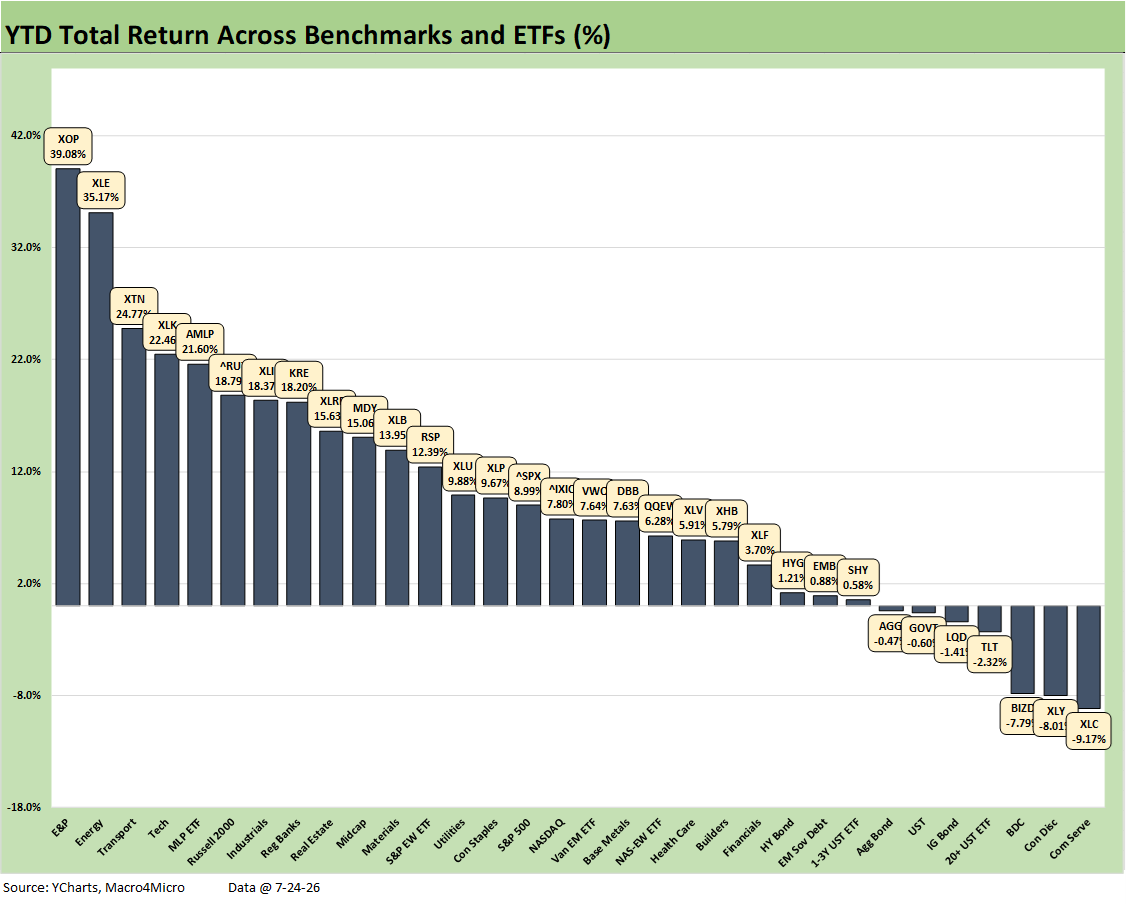
There is no getting away from the fact that 2026 has been a great year for many equity subsectors. The score of 26-7 includes 4 bond ETFs among the 7 negative returns. The BDCs (BIZD) have moved up to 3rd to last and even made into the top quartile for the trailing 1-month.
The big winner YTD include E&P (XOP) at #1 with Energy (XLE) at #2 and Transports at #3 with no Tech (XLK) showing up until #4 just ahead of Midstream Energy (AMLP) at #5. On a favorable cyclical note and some reassurance in breadth YTD, we see the Russell 2000 small caps at #6 with Industrials (XLI) and Regional Banks (KRE) wrapping the top quartile.
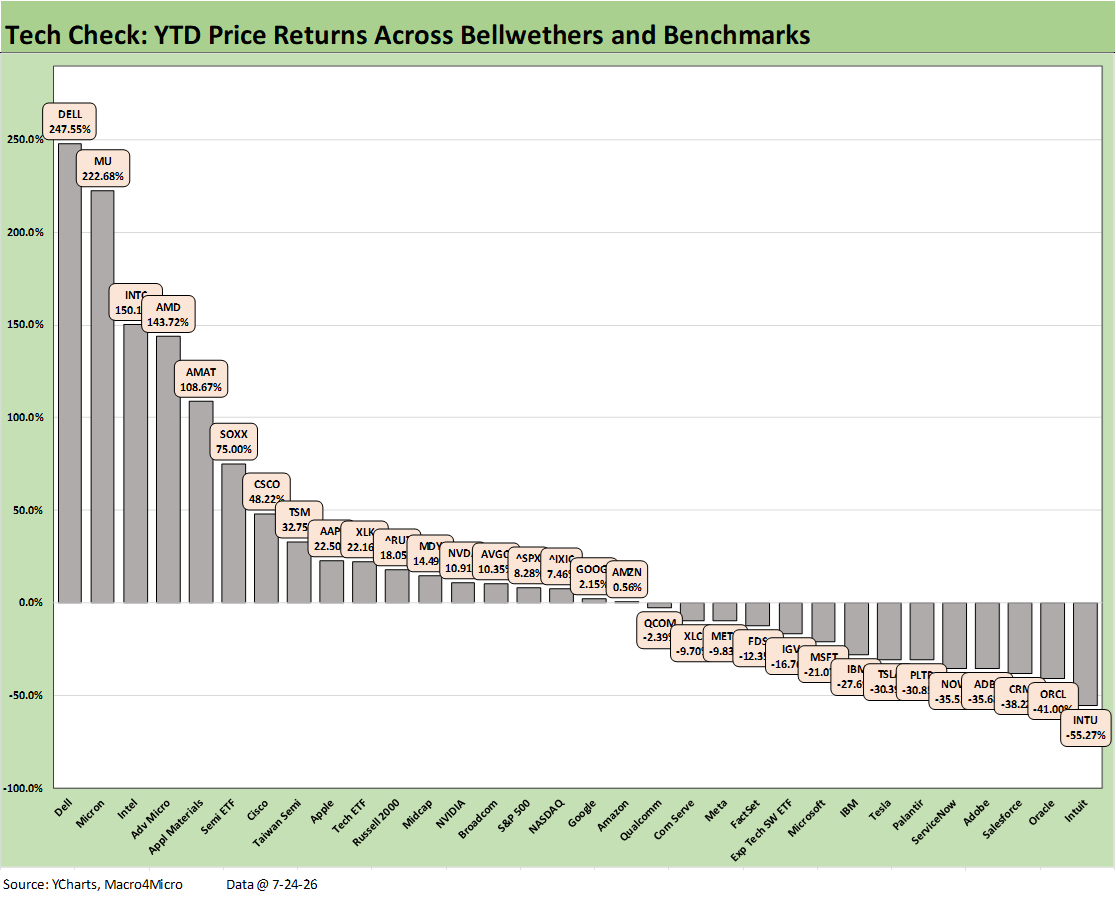
The wild year for tech is very in evidence with the “Tech Check” mix showing dazzling winners as well as devastating losers. We see 5 names of the AI ecosystem in triple digit returns with Dell at #1 at +247.5% followed by semiconductor-related names in the next 5 slots which includes the Semiconductor ETF (SOXX) at #6. Rounding out the top quartile was legacy leader Cisco (CSCO) and Taiwan Semi (TSM).
The theme of AI displacement and SaaS business model eradication hammered the software and SaaS based services names across the spring and into summer. The Software ETF (IGV) at -16.7% in the 3rd quartile shows a 91.7 point return differential below the SOXX ETF.
More than software has taken a hit with IBM as a legacy diversified player now also in the bottom quartile YTD. We see the bottom quartile running from -27.6% for IBM at the high end of the bottom quartile down to Intuit (INTU)at -55.3%.
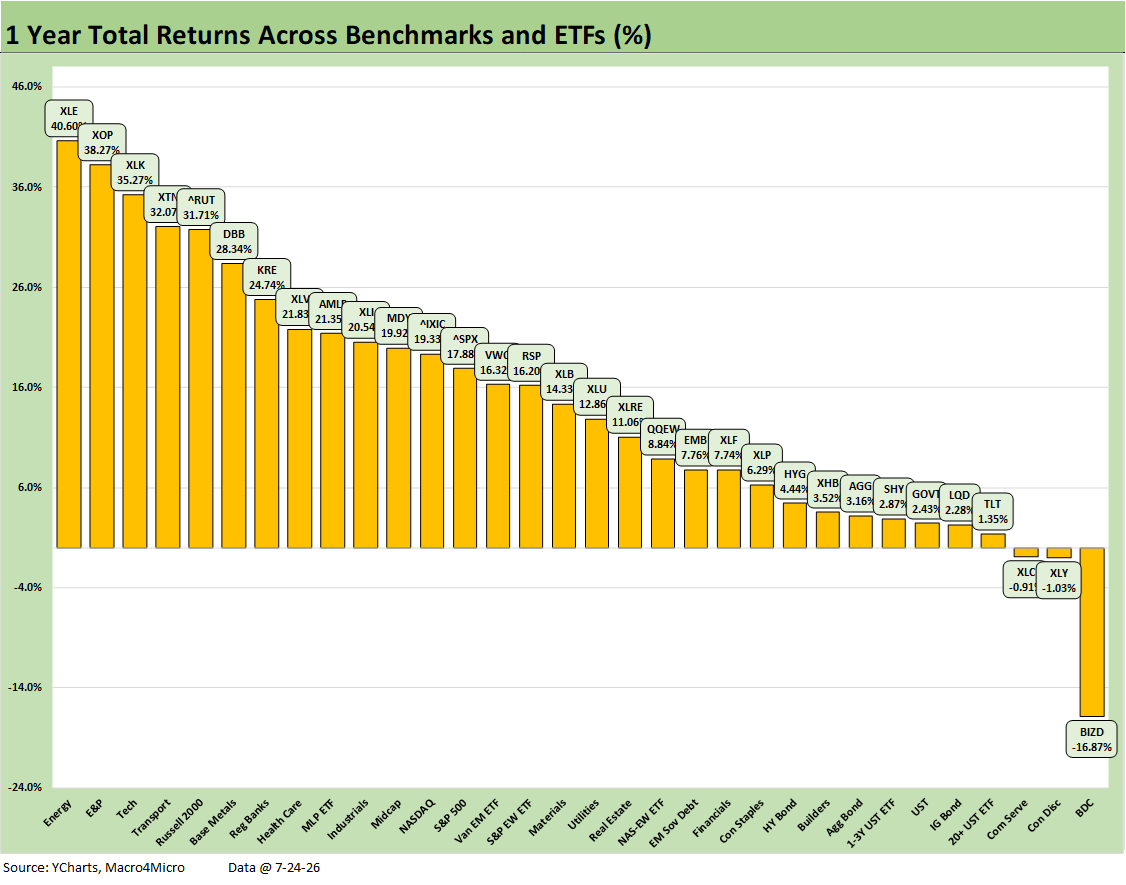
The 1-year score remains impressive at 29-3 but with 2 new additions to the negative ranks this week with the Consumer Discretionary ETF (XLY) and the Communications Services ETF (XLC).
XLY is feeling the pain of some consumer weakness LTM. TSLA was a modest negative over 1 year in the -5% range while other losses among major holdings included Royal Caribbean (RCL), Booking Holdings (BKNG), McDonald’s (MCD), Home Depot (HD), and Lowe’s (LOW) among others. Iran fallout did not help travel costs while the 1Q26 period offered fairly glum personal connumeration growth trends.
XLC is feeling weak returns at META at almost -16% and Netflix (NFLX) around -40%. XLC also saw weak LTM numbers from Disney (DIS), Comcast (CMCSA), and T-Mobile (TMUS) also taking a beating.
See also:
Yield Curve: Vegas Odds Keep Moving 7-26-26
New Home Sales June 2026: Soft Pricing, Tepid Volumes 7-25-26
Synchrony: Consumer Bellwether Reassures on Quality 7-23-26
Earnings Season Beckons: Homebuilder Stock Returns 7-20-26
Earnings Season Beckons: Comparative Auto Equity Returns 7-20-26
Housing Starts June 2026: 5 Units or More is Not a Crowd 7-19-26
Industrial Production June 2026: Sideways Syndrome 7-18-26
Company Profile: Ford Motor and Ford Motor Credit 7-17-26
Producer Price Index June: Still Hurts…Just Less 7-15-26
CPI June 2026: Eye of the Storm? 7-14-26
Existing Home Sales June 2026: The Stall is On 7-11-26
Happy 250th Birthday America 7-3-26
Employment Situation June 2026: Back to a Crawl 7-2-26
JOLTS May 2026: Openings Flat, Hires Down, Layoffs Up 7-1-26
Music to Ponder: Hope Rising or Blood Simmering? 6-30-26
The Election Gambit: Economic Risk and Policy Uncertainty 6-29-26
JD Vance and Nixon History: Clueless 6-27-26
Personal Income & Outlays May 2026: Bad Inflation, Balanced Spending 6-26-26
GDP 1Q26 Final: PCE Growth Plunge 6-25-26
Trade Deficits: The Moving Parts and Macro Goals Matter Most 6-24-26
The FOMC Dance: Will Warsh and Trump Find a Rhythm? 6-17-26
Geopolitical risk: Trump’s Nuclear Saber Rattling? 6-14-26
Remembering D-Day: June 6, 1944
The Fall of CBS 6-3-26