

· Housing has been feeling the mortgage pain flowing into monthly payments while supply issues in single family homes are still a headwind. Multifamily continues to carry the ball for the headline trends in total starts.
· The +19.0% increase in total starts MoM from May included -0.2% in single family and +76.3% for multifamily, which was at a high for the trailing year. The YoY total starts posted +3.5% with single family at -3.2% and multifamily at +19.3%.
· More markets are starting to see downward price pressure in new homes based on builder color, and we get new home sales data this coming week. Last month’s median price moved higher (see New Home Sales May 2026: Weak Volumes, Stable(ish) Prices 6-25-26).
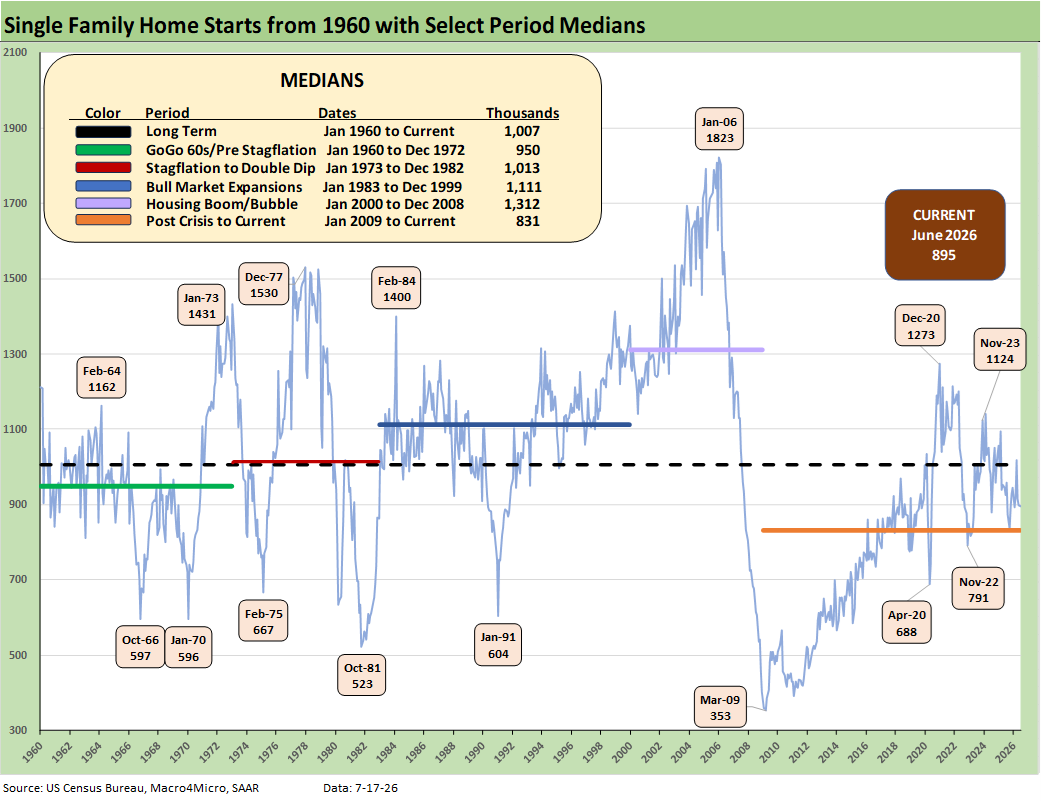
The above chart offers a clear reminder of the wild single family residential construction cycles across the decades. With favorable demographics for housing demand, the current starts run rate of 895K (vs. 897K as revised in May) is still well below the long-term median of 1007K and below all the timeline medians posted above except for the “crisis to current” timeline starting in Jan 2009 at 831K, which is in a similar zone in the post-crisis period.
The current backdrop includes mortgage rate pressures undermining the affordability of monthly payments with the Mortgage News Daily 30Y survey closing Friday at 6.63% (down from 6.75% earlier in the week). Mortgage rates are not likely to get much better from here in the peak housing season and with the Iran War and Strait of Hormuz crisis more likely threatening UST bear steepening than bull flattening. That comes after seeing mortgage rates flirt very briefly with crossing below the 6.0% line in Feb 2026, just before the Iran War.
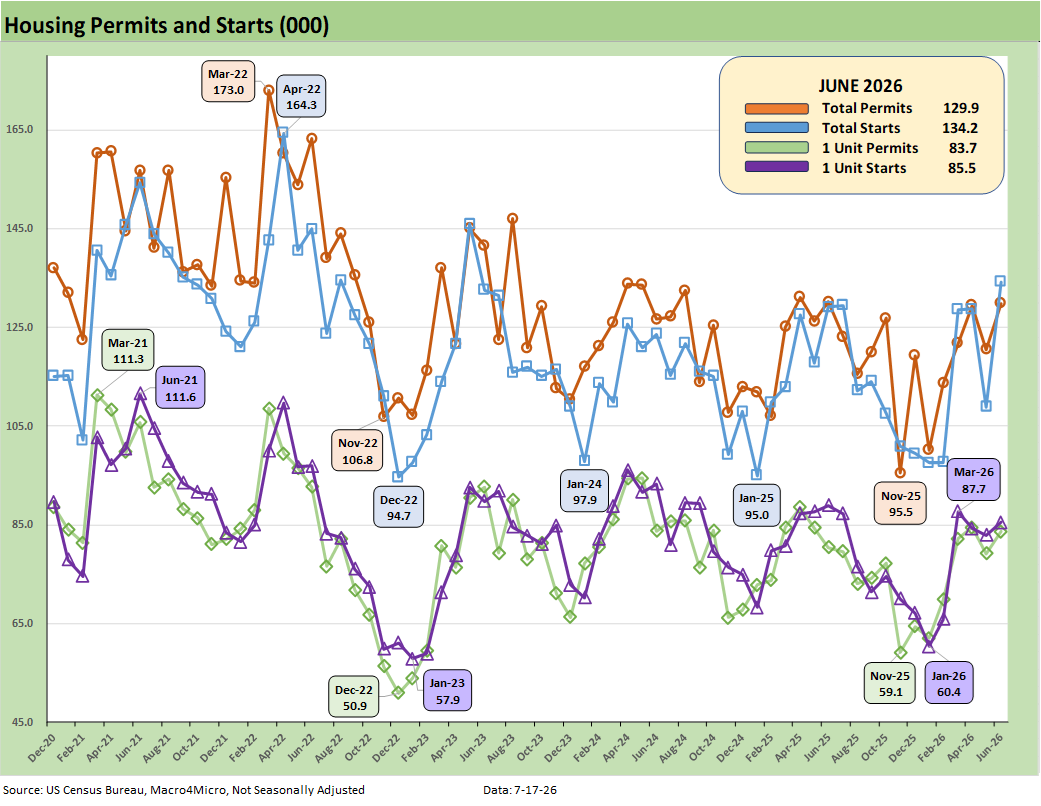
The above chart plots total permits and total starts and single family starts and permits on a Not Seasonally Adjusted (NSA) basis. NSA is viewed as closer to what is going on in the trenches without the SAAR model assumptions.
For June 2026, we see NSA total permits lower by -0.2% YoY. Single family permits were higher by +4.1% YoY. Total permits were +7.8% higher MoM with single family permits up by +5.7 MoM.
For total starts and single family starts on an NSA basis, we see total starts up by +4.0% YoY and +23.2% MoM. For single family NSA starts, the YoY deltas were lower by -3.8% while MoM was up by +3.1%.
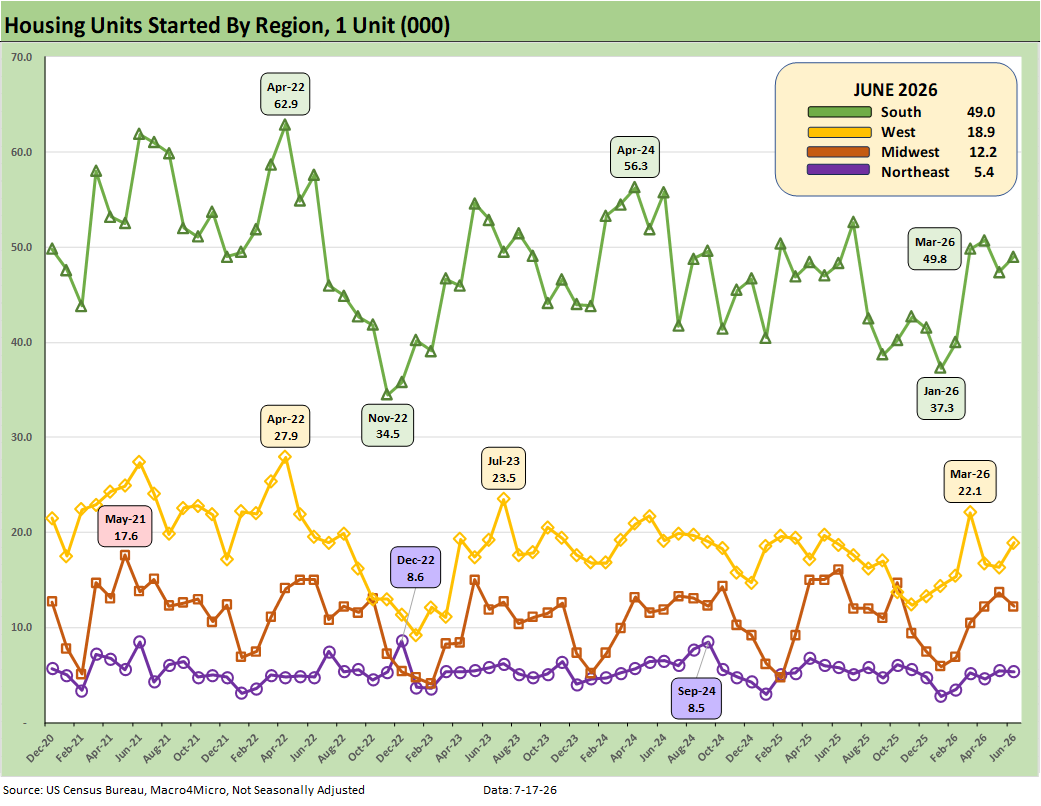
The above plots the single family starts by region (NSA). On a MoM basis, the critical South region (totals 51.9% of total NSA starts and over 58% of single family starts) was up in single family by +3.4% MoM and up by +1.5% YoY. The West as the #2 single family market (22% of total) was up 16% MoM. The Midwest region MoM in single family was -11.0% with the small Northeast market at -1.8% MoM. The YoY NSA starts were mixed with the South higher and West both higher among the big two regions. The Midwest was higher and Northeast lower.
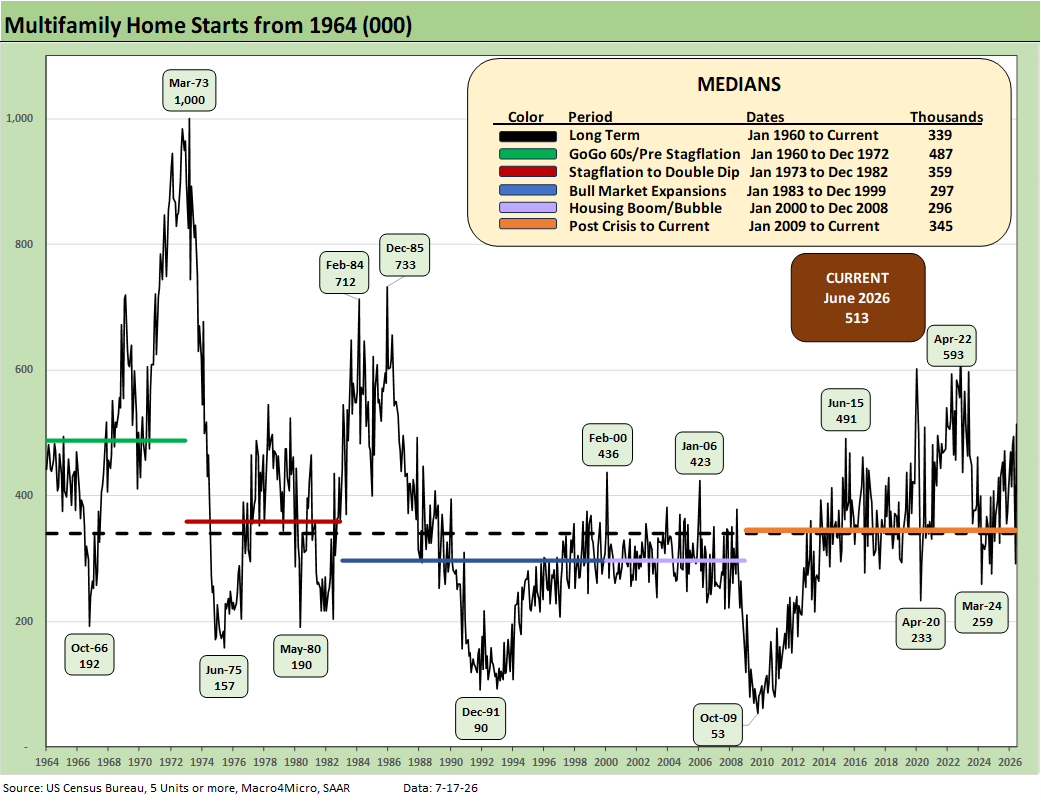
The above chart updates running multifamily starts. At +513K (SAAR), June 2026 increased by +76.3% MoM from May after May posted a massive decline from April. The 513K is only 3.8% above April and 6.6% above March. The decline in May was the anomaly.
The 513K is well above the long-term median of 339K and well above the highest timeline median from Jan 1960 to Dec 1972 of 487K. That 1960-1972 period was when the urbanization boom was ongoing. The 1960s was a period of explosive growth for multifamily with the back end of the baby boom, the postwar rise of urbanization, and the high racial migration from the South to the North all part of the multifamily tailwinds. Immigration also played an important role.
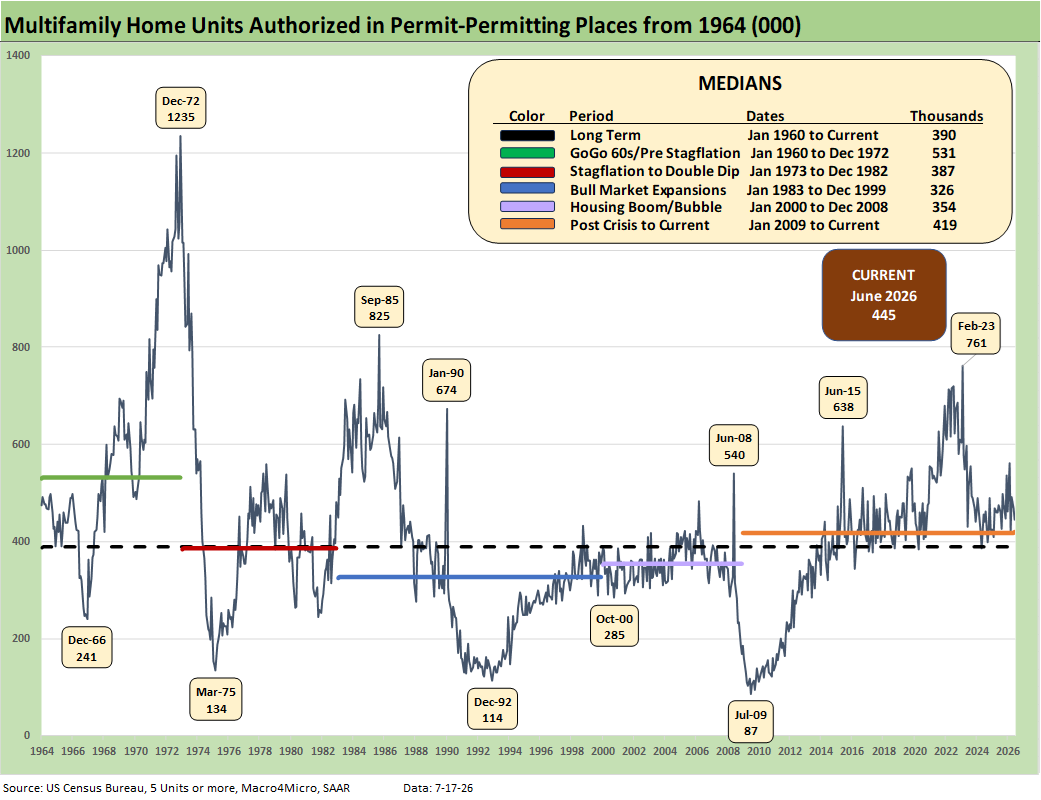
The above chart updates Multifamily permits (SAAR). The 445K in June 2026 multifamily permits declined by -4.9% MoM and was down by -6.3% YoY.
The bottom line on home starts as we move further into the peak selling season is that 2026 is shaping up as a mediocre year at best for homebuilders. This is consistent with the guidance we are getting from the major homebuilders.
See also:
Producer Price Index June: Still Hurts…Just Less 7-15-26
CPI June 2026: Eye of the Storm? 7-14-26
Market Commentary: Asset Returns 7-12-26
Existing Home Sales June 2026: The Stall is On 7-11-26
Happy 250th Birthday America 7-3-26
Employment Situation June 2026: Back to a Crawl 7-2-26
JOLTS May 2026: Openings Flat, Hires Down, Layoffs Up 7-1-26
Music to Ponder: Hope Rising or Blood Simmering? 6-30-26
The Election Gambit: Economic Risk and Policy Uncertainty 6-29-26
JD Vance and Nixon History: Clueless 6-27-26
Personal Income & Outlays May 2026: Bad Inflation, Balanced Spending 6-26-26
New Home Sales May 2026: Weak Volumes, Stable(ish) Prices 6-25-26
GDP 1Q26 Final: PCE Growth Plunge 6-25-26
Trade Deficits: The Moving Parts and Macro Goals Matter Most 6-24-26
The FOMC Dance: Will Warsh and Trump Find a Rhythm? 6-17-26
Housing Starts May 2026: Weaker for both Single Family and Multifamily 6-16-26
Geopolitical risk: Trump’s Nuclear Saber Rattling? 6-14-26
Remembering D-Day: June 6, 1944
The Fall of CBS 6-3-26