


I think I’ll pass…
The latest new single family home sales release from the Census shows a slight sequential MoM increase of +1.6% but down by -5.6% YoY. The 628K was lower than 2H25 and 3rd worst in the LTM period.
The critical South region (65% of sales) ticked +9.9% higher MoM but was down by -1.4% YoY. The #2 US region in the West (17% of total) was down by -22.4% MoM and -24.6% YoY. That geographic mix shift was enough to pressure the median prices lower to $398.3K in June from $412.0K in May.
The monthly mortgage payment strain for new or existing homes will not see relief with mortgages at 6.8% after the expectation of getting back down to 6.0%. Massive increases in US budget deficits, UST supply anxiety, and an escalating US-Iran conflict devoid of realistic exit strategies is not making life easier for the housing sector with tariff disputes doing damage to the supplier chain.
This week we get the FOMC meeting, the advance estimate for 2Q26 GDP, and the PCE inflation and income and outlays release. The expectation is that PCE growth for 2Q26 will rise off the abysmal +0.5% of 1Q26.
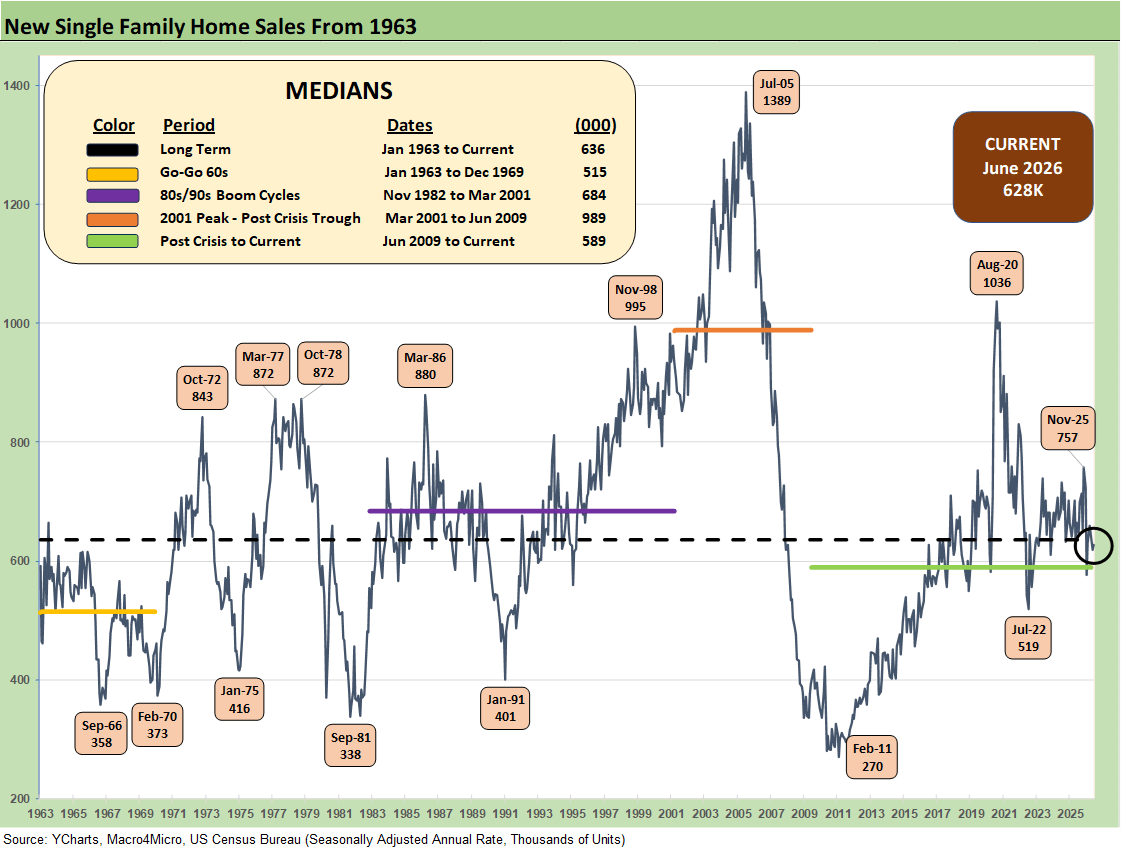
The above chart updates the new single family home sales series from 1963, and the current 628K (SAAR) is only slightly below the long-term median (636K) and modestly above the revised May 2026 tally of 618K (as revised).
The median of 989K in the housing boom/bust cycle from 2001-2009 is almost 60% higher. As we look back to the peak of the housing bubble, we see 1389K in July 2005 at over 2x the June 2026 volume. The COVID panic buying and relocation spree in Aug 2020 saw sales of 1036K in a wild period for new home sales and home starts in a ZIRP market with very low mortgage rates. The market today is facing much higher prices since COVID and 30Y mortgage rates that hit 6.85% this week before ending at 6.81% (Mortgage News Daily survey).
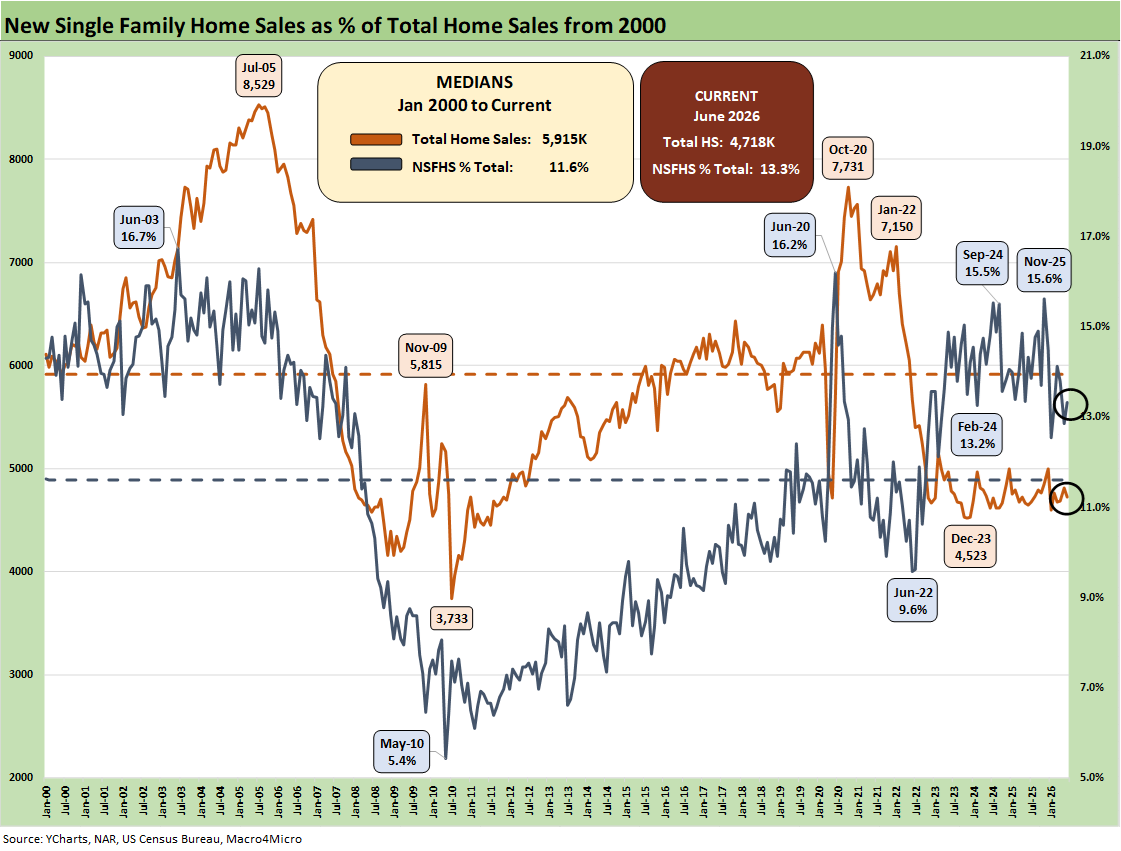
The above chart plots the share of total home sales (new + existing) that were captured by the “new home” builders. We see the share is now at 13.3% vs. the long-term median of 11.6%. When inventory is scarce, the right home at the right price wins. The challenge overall for new home sales has been mixed for builders by region.
Major homebuilders generally continue to report gross margin compression in 2026 and guide to similar expectations for the year. We are seeing lower prices from the builders even if that comes with the asterisk of product tier and geographic mix.
The market edge for closing a sale favors builders vs. existing home sales (note: existing is still the vast majority of sales volume). The homebuilders have the ability to use incentives and financing support (see Existing Home Sales June 2026: The Stall is On 7-11-26), and the homebuilder can tailor packages to close sales.
Given the mortgage rate headwinds undermining volume in the existing home sales market whether “golden handcuffs” or a challenging monthly payment bar to clear for many, the shortage of existing housing inventory at economic all-in costs (price and mortgage rates) has been a recurring drag on that side of the home sales tally.
In new home sales, the gap between the expectations of the seller and buyer is easier to bridge through the incentive programs or the ability to offer variations in home design and specs to make a transaction work.
D.R. Horton as the #1 US homebuilder offers a useful microcosm of the new home challenges (see D.R. Horton: Financial Powerhouse Despite Cyclical Softening 5-20-26). The 6% handle mortgage rates have been a struggle and have moved in the wrong direction with more than a few market watchers thinking 7% could still be crossed given the ugly direction of budget deficits, oil prices, and volatile inflation handicapping.
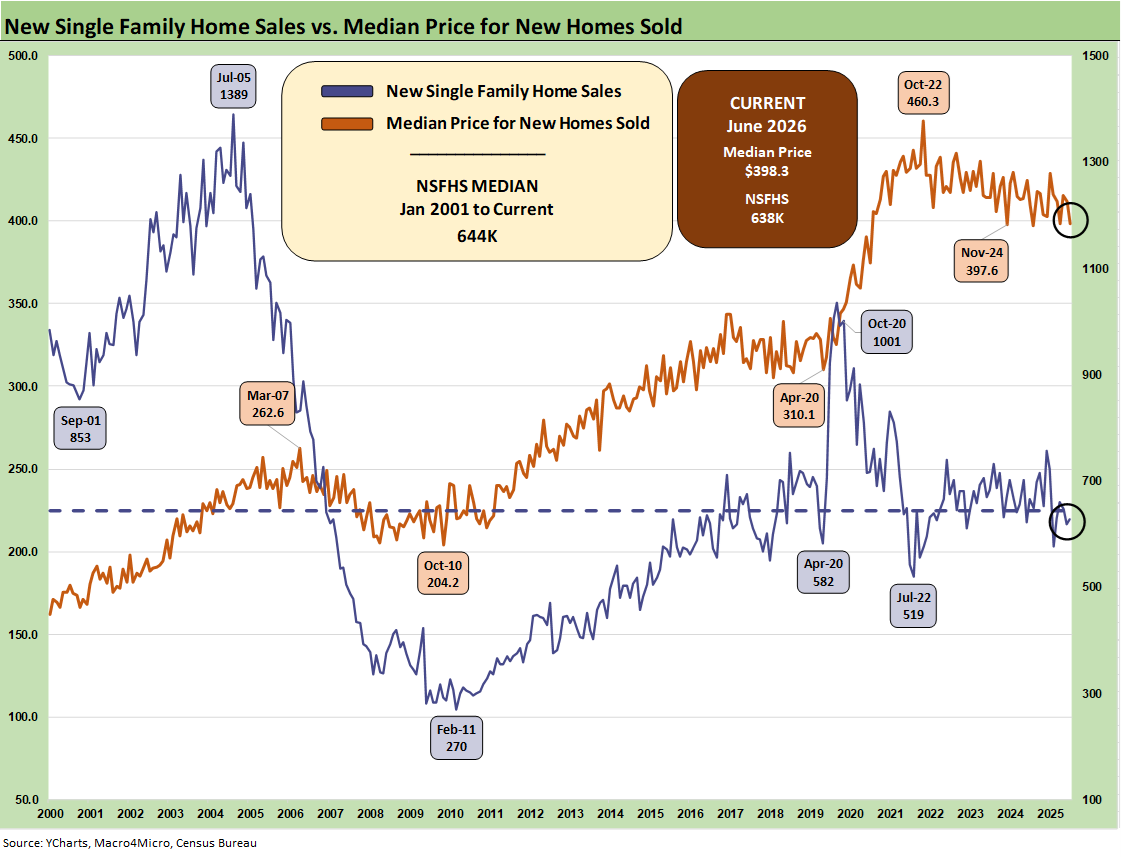
The new home sales volumes are softer with total new homes down by -5.6% YoY. Prices posted this month dipped back below the $400K line. D.R. Horton and Pulte both reported June quarter results this past week and both reported lower average selling prices YoY for the quarter. Average Selling Prices at the builder level come with the asterisk of product mix and region. The builders face the reality that incentives are still a material part of the builders’ selling strategies.
The 10Y UST is the key benchmark for the direction of 30Y mortgages and that has been moving in the wrong direction YTD. The oil wildcard could ease pressure on the longer end of the curve if “peace breaks out” but that is not looking good right now.
The “Vegas odds” at CME’s FedWatch shows the odds of no change by the Dec 2026 FOMC meeting at only 7.2% while 1 hike is at 31.5%, 2 hikes at 39.1%, and 3 hikes at 19.0%. That is not pretty. Warsh will need a very creative new data set to erase inflation fear and convince the voters.
The CPI, PCE and PPI inflation metrics have been grim despite the inflation easing in June after May sent headline numbers over 4% (Producer Price Index June: Still Hurts…Just Less 7-15-26, CPI June 2026: Eye of the Storm? 7-14-26). July is undergoing another round of oil market heat, and Iran War setbacks that will flow back into July inflation numbers.
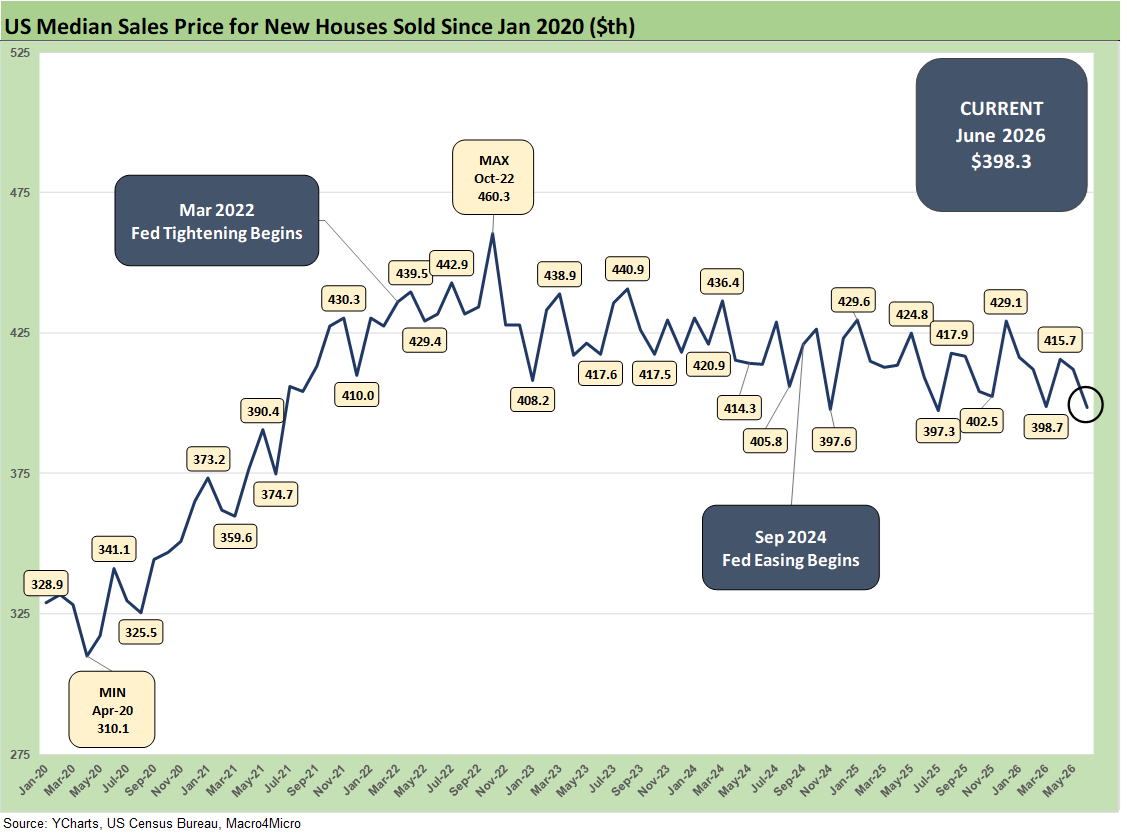
The median home price time series above tells a simple story that prices had been under modest pressure after a period of record highs and a long stretch over the $400K threshold with a few dips below the $400K line. We had another dip below that threshold in June at $398.3K.
The move lower to $398.3K from $412K (as revised) can have a lot of contributing factors from mix to region, but a decline is consistent with the major builders reporting. The South’s lower ASP mix can factor in as a lower ASP region, but the “South” by itself has a very wide range as well. The South posted a +9.9% sequential MoM increase in volumes (-1.4% YoY) while the West was down sharply by -22.4% MoM (-24.6% YoY).
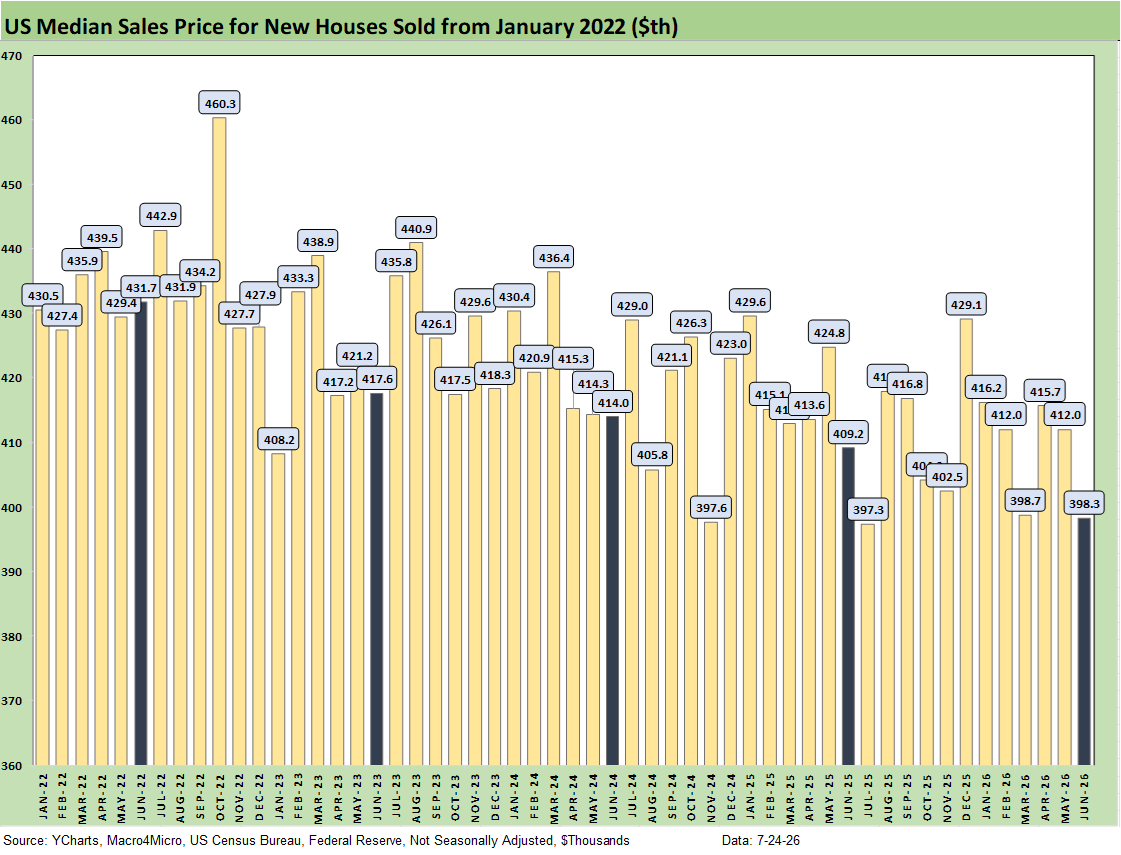
The above chart gives a different visual angle on the median new home sales prices from early 2022. That is a lot of $400K handles with some sub-$400K outliers. The June 398.3K posted is more in line with the $398.7K in March.
The price metrics can shift with regional mix as well as home price tiers and related supply issues. The affordability question is still more intertwined with the monthly payment pressures from mortgages. It is about more than price. Those monthly payments are very sensitive to mortgage rates more than home price moves.
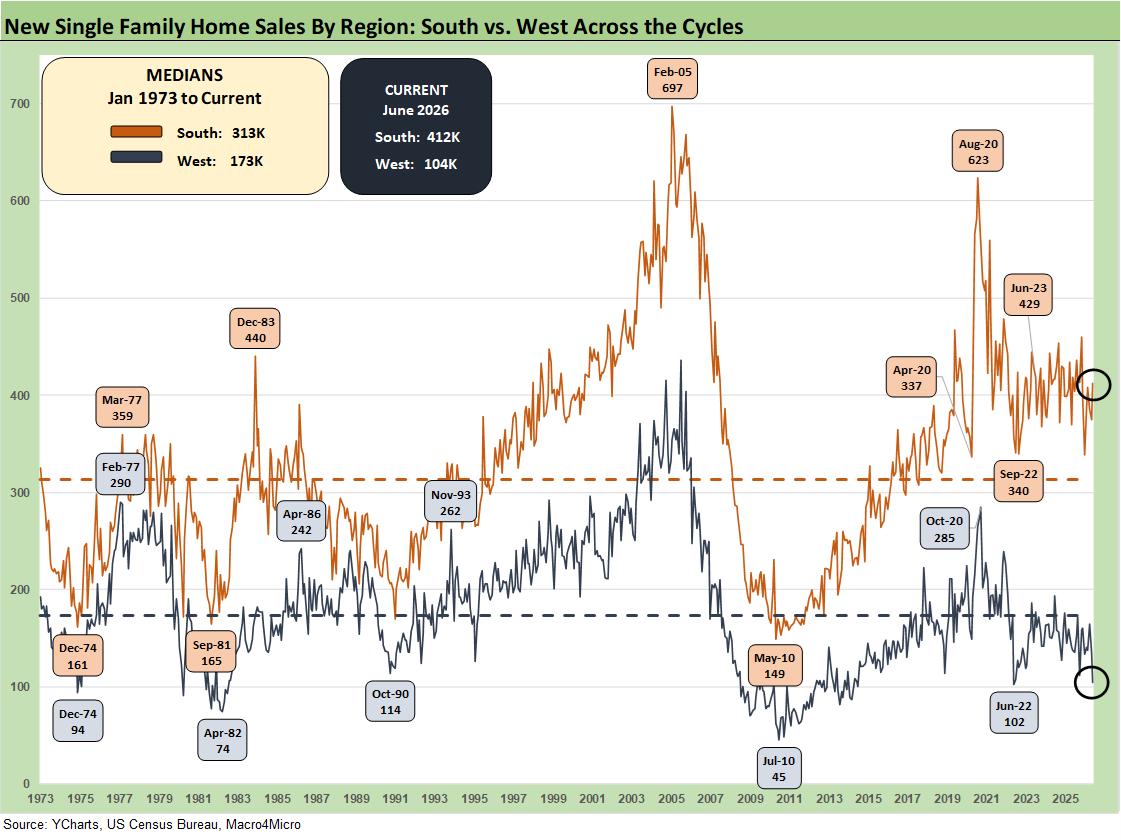
The time series above updates the new single family home sales across the cycles since 1973 for the #1 and #2 regions of the South and the West. The 412K for the South is around 65% of the total of all single-family new home sales (SAAR) and marks a sequential increase of +9.9% from April 2026 and is down by -1.4% YoY. The West at 104K is 17% of the total. For the month, the West was down by -22.4% sequentially and by -24.6% YoY. The South is running ahead of the long term median of 313K while the West is below the median.
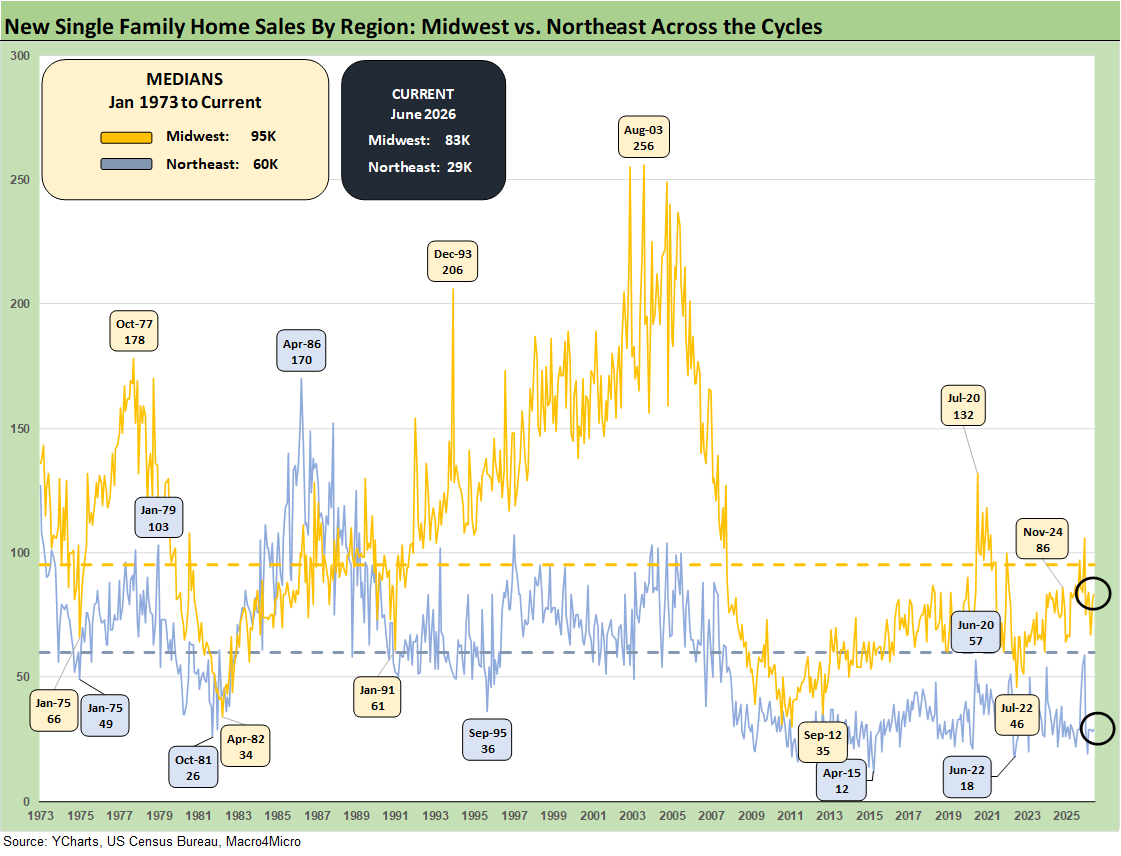
The timeline for new home sales for the smaller Midwest and much smaller Northeast market is detailed above. The Midwest (13% of total) was +16.2% sequentially and -3.7% YoY. The Northeast market (5% of total) was +3.0% sequentially and +17.2% YoY.