


What could possibly go wrong from here?
The decline in YoY CPI to 3.5% headline and 2.6% core hitched a ride on the -5.7% MoM in Energy for June that still left Energy YoY at +15.7% and Gasoline at 26.7%. On a positive Energy sector note, Electricity at -1.0% MoM flowed into Electricity YoY at +4.0%.
The special aggregate indexes (Table 3) offered some relief in June but with “All items less shelter” still at a stubborn 3.7%, “All items less food and shelter” at 3.8%, “Services” (63.3% of CPI) at 3.2%, and “Commodities” at 4.1% even after a -1.1% MoM.
Our favorite “useless” derived metric is health insurance CPI with its -7.4% deflation reading as many consumers face brutal premium headwinds that have driven some to skip health insurance entirely or shift into high-deductible plans. The methodology for health insurance is disconnected from the consumer “cash out the door” impact.
Close behind in the derby for least economically relevant CPI metrics for household cash flow reality is auto inflation (new vehicles +0.5% YoY, used vehicles at -1.8%) where affordability is also heavily about the monthly payment and financing costs, which are not part of the CPI equation.
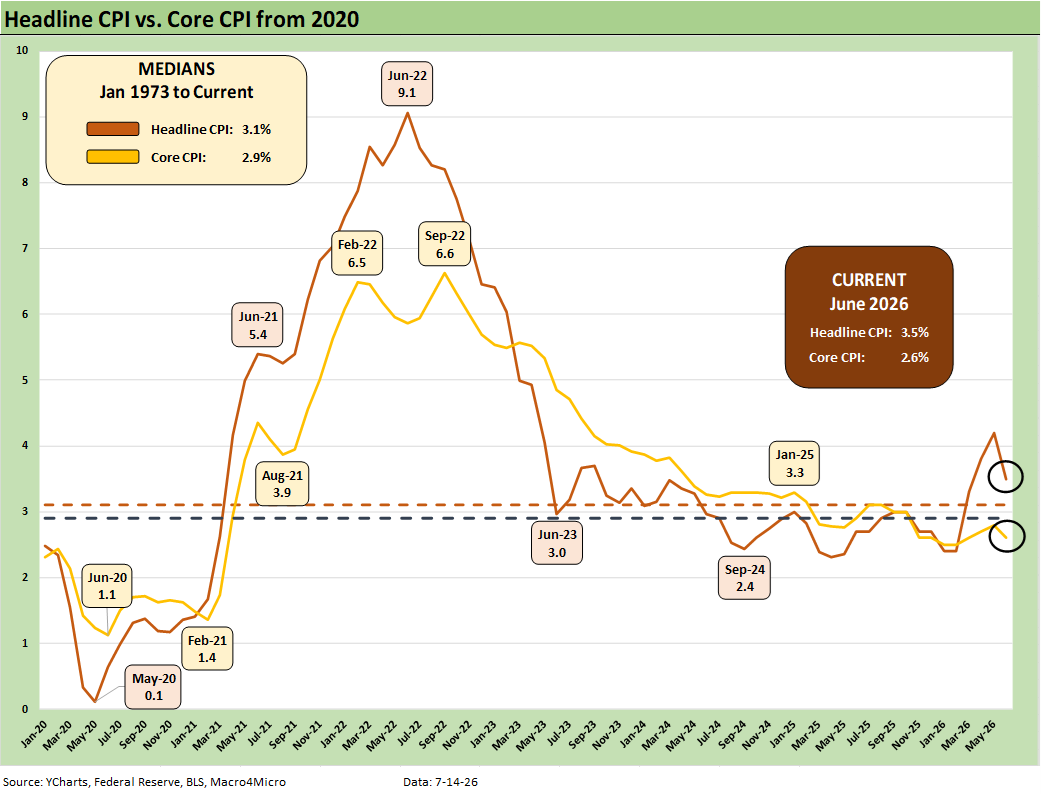
The above time series for headline CPI vs. Core CPI highlights the divergence of the two in this market backdrop with oil prices swinging around wildly with the Iran War (bombing began Feb 28) and related supply disruptions. Trump and his negotiating swat team have been unable to structure and close a deal consistent with his shifting reasons for the war and morphing goals for the bombing. The clash of the fanatical and hateful with the irrational and delusional makes for highly uncertain negotiating dynamics.
The chart shows some of the highs and lows of the post-COVID timeline with the 2.4% CPI Sept 2024 headline level reminding us that treating the Powell legacy with a little more respect might be justified. He and the FOMC were late to move, but 2022 had very strong employment while rolling into 2023-2024 saw solid growth rates in personal consumption – well above current levels (see Unemployment, Recessions, and the Potter Stewart Rule 10-7-22, 4Q23 GDP: Final Cut, Moving Parts 3-28-24).
The US as a “dead country” (to quote Trump) in 2024 also delivered some healthy PCE growth numbers in GDP with inflation moving sharply lower. There is a reason that Bessent, Hassett and the MAGA bobbleheads do not post charts and objective tables and frame them up against Trump’s 2025-2026 (or 2017-2020).
Along the way, we see a lot of strange statements out of Washington on economic performance and gross misstatements that are free of factual support. The trash-talking is worse now than ever in the modern, postwar era, but we always say look for the arguments that do not bring facts and stats. Those are likely parties spinning fake tales. We thought we should update a few factual histories as they relate to GDP, the consumer, and jobs to help sort out some of the falsehoods in the midst of so much political noise:
Trump’s “Greatest Economy in History”: Not Even Close 3-5-25
Gut Checking Trump GDP Record 3-5-25
Payroll % Additions: Carter vs. Trump vs. Biden…just for fun 1-8-25
Annual GDP Growth: Jimmy Carter v. Trump v. Biden…just for fun 1-6-25
The Politics of Objective GDP Numbers: “Flex Facts” on Growth 10-30-24
Presidential GDP Dance Off: Reagan vs. Trump 7-27-24
Presidential GDP Dance Off: Clinton vs. Trump 7-27-24
Employment Across the Presidents 8-15-23
We reproduce these in an inflation piece since, in the end, the inflation risk factor is about how it flows into the economy to impact jobs and consumer spending, undermine capital investments, or drive setbacks in the credit cycle whether at the consumer level in banking and finance, or in debt defaults.
In 2023-2024, the consumer proved resilient. In 2025-2026, the capex cycles have been extremely strong with consumers borrowing to spend more with savings rates dropping. It takes a lot to drive an economic contraction and that has not been close so far. The shakiest part of the macro story in the US for now is the consumer as evident in the weak 1Q26 PCE growth rates.
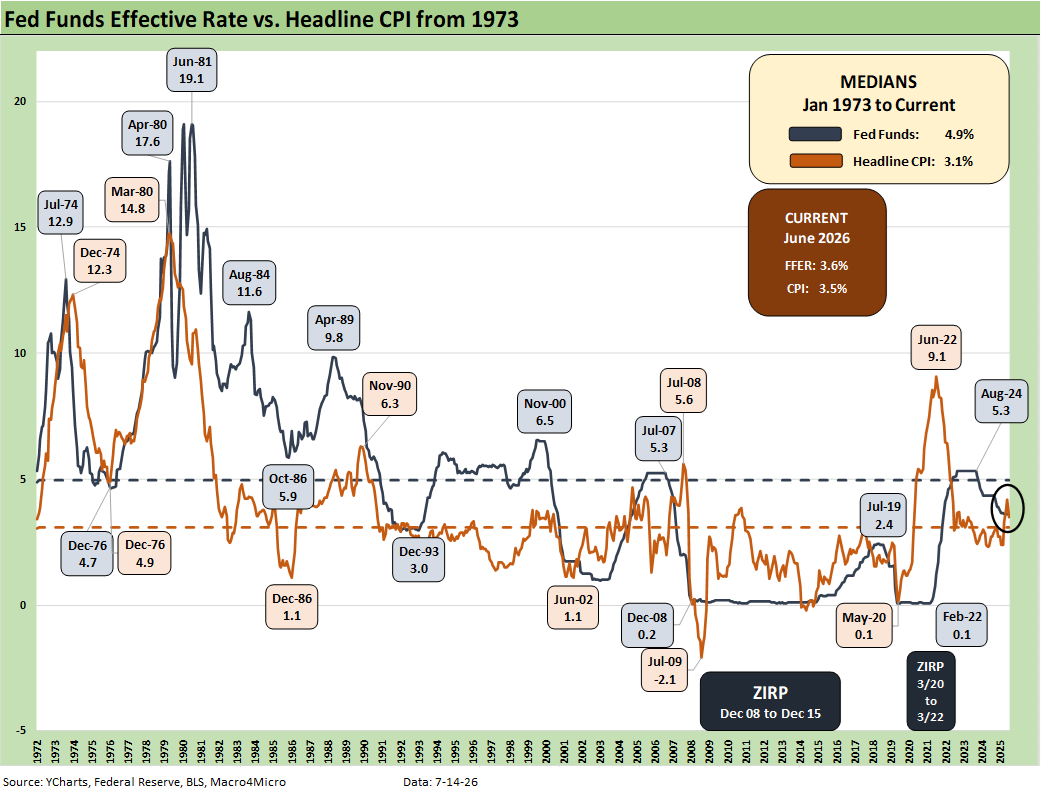
The above chart plots the historical time series for fed funds vs. headline CPI. The latest headline of 3.5% for June sent CPI back below the 4% threshold after ending 2024 (Biden’s last full month) below the 3% line at 2.9%. The chart includes the long-term medians, which underscore that the current compression of CPI and fed funds is “not normal.”
We reiterate that you can tell the consumer that “core is all that matters” for inflation but just don’t do it while he is filling up his gas tank on the way to the grocery store. The food and energy cost pressures are daily and weekly real cash flow economic events for household budgets. Telling a consumer health insurance CPI is in deflation mode (-7.4%), and that view is likely to be met with a laugh or with pointed profanity when that consumer cancelled his ACA coverage on a 50% premium increase.
Oil prices also will clearly matter to FOMC voters who cut their academic teeth studying the disasters of the 1970s (notably late 1973, 1974, and early 1975) and the 1980-1982 stagflation double dip (Iranian oil crisis in 1979). The common features of Mideast conflict and embargos and supply disruption cannot be ignored.
The most dramatic difference now vs. the stagflation years is that the US is now a record oil producer exporting record volumes at high prices. If oil exports were banned, prices would plunge in the US. That said, Trump knows where his meal ticket is (“big oil”), and the reverberating effects of such an action would be potentially catastrophic for trading partners.
Core CPI (or Core PCE) may be more significant to the debate around inflation (as defined by economists and monetary junkies), but the purchasing power and the relative affordability of the household basket is about real wages and what in that basket may have to change. The recent negative real wage growth or now the negligible real wage growth dovetails with the household cash flow topic.
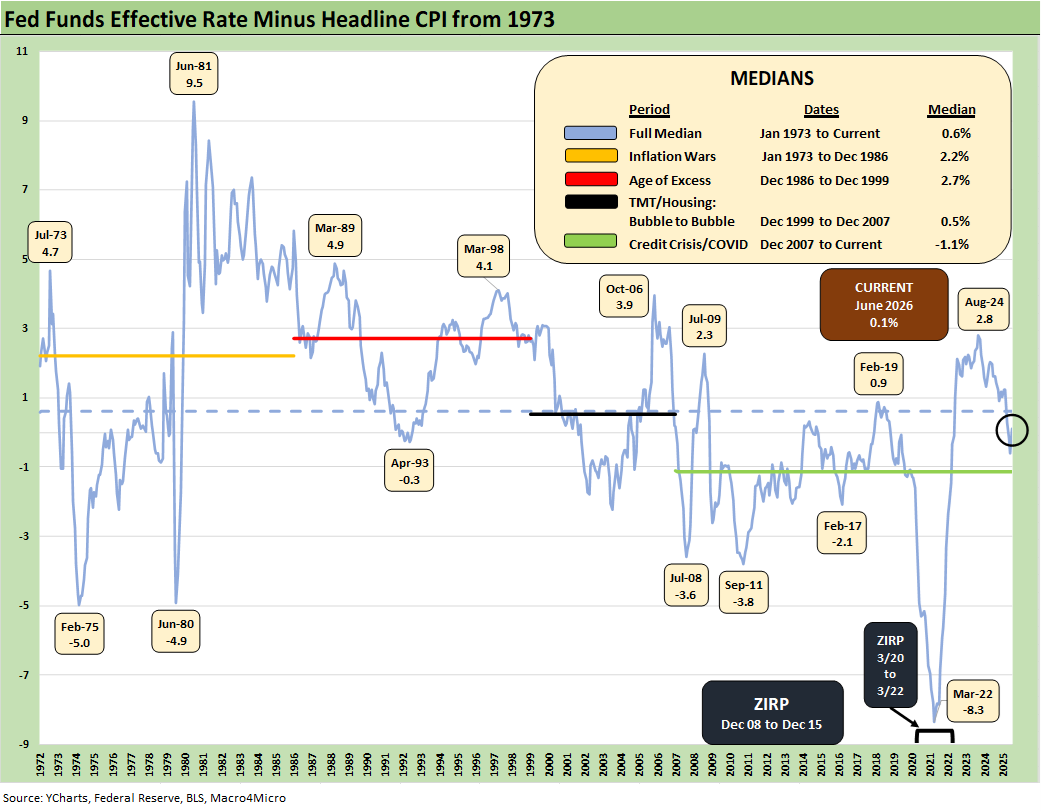
The above chart frames the fed funds vs. CPI differential. Fed funds minus CPI is now +0.1% after it had turned negative in May at -0.6. vs. the long-term median of +0.6%. In the world of very basic theory, that relationship is more like accommodation.
FOMC odds are dim from here. As we go to print, the Vegas odds (CME FedWatch) show the odds of 1 fed cut by the Dec 2026 FOMC meeting stand at 0% vs. the odds of 1 hike at 42.9%. The odds of “No changes” in fed funds is down to 20.9% while the odds of 2 hikes by Dec 2026 is 28.5%. The probability of 3 hikes is 7.1%.

As we covered in the bullets, the customized CPI benchmarks posted in Table 3 of the BLS release are troubling in historical context even though there was improvement in June 2026. These detailed above are our favorites, but there is a long list worth reviewing.
“All items less shelter” has been our top pick across time as we have cited in prior research since “Shelter CPI” comes with too many asterisks and derived numbers that do not fit the typical household reality (or even close).
The chart shows “Services” still stubborn. It also drives home the stark differential between the Durables CPI trend and the much larger Nondurables line. The ability (or desire) to pass through tariff costs has not hit Durables CPI yet.
The 3.7% for the “All items less shelter” metric in June is better than the 4.7% of May, but it still is a material contrast with the sub-2% levels of 2024 including 1.9% in Dec 2024 (Biden’s last month). In mid-2023, the level was +0.7%. The FOMC was doing its job the right way by then, and the payroll adds of those 2023 days crushed what was posted for June 2026 (see Employment Situation June 2026: Back to a Crawl 7-2-26).
One line that caught our attention in the special aggregates was “Utilities and public transportation” CPI at 4.9% (not shown above) with an 8.1% index weighting. That line was 6.0% in May but it is still running warm. Total transportation CPI in Table 3 was 6.5%.
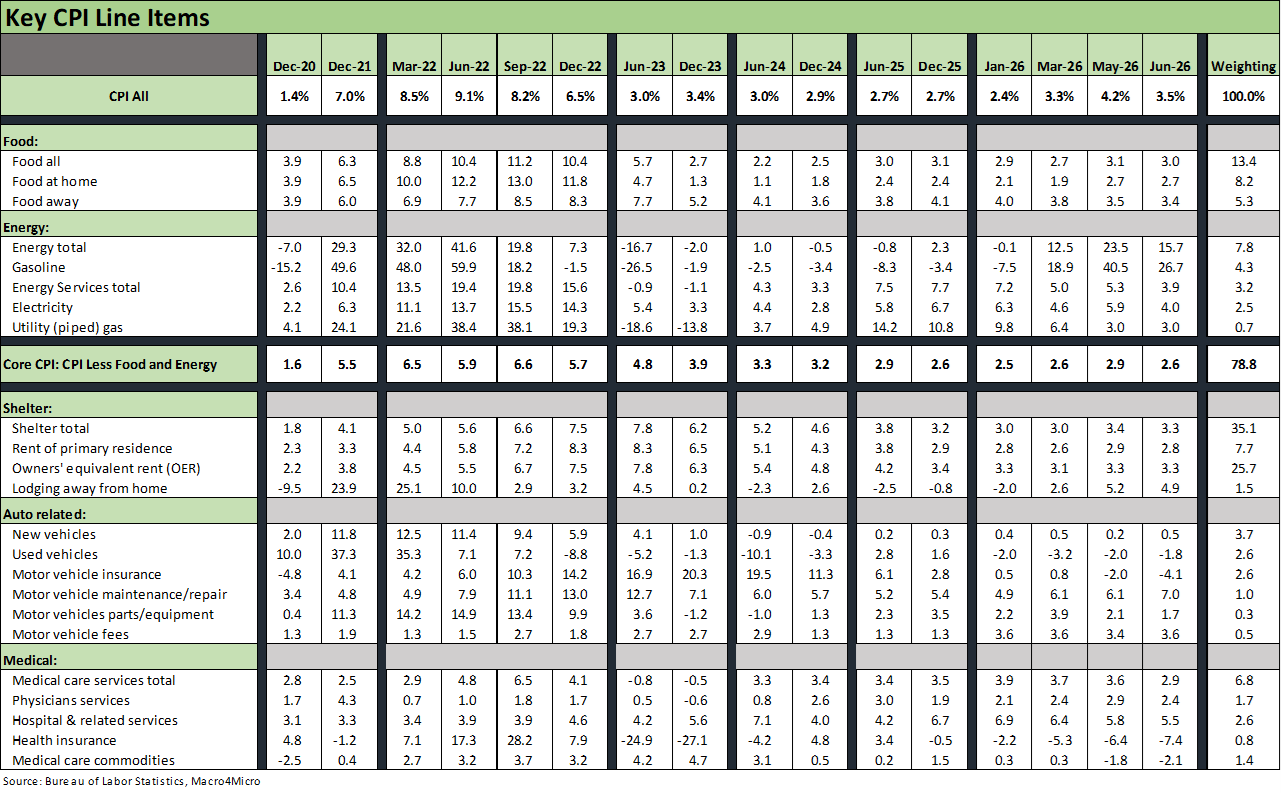
The above table details our Big 5 subsectors for CPI. These roll up to around 75% of the CPI index, so overall this mix of 5 broad categories is the main event even if there are plenty of line items outside this group that matter a lot to consumers.
We will not give much space to our long-held view on the low value of the lines that are derived and inconsistent with the household “checkbook experience” and household cash flow (notably shelter and the steep deflationary number of -7.4% for health insurance).
Some of those lines speak for themselves at a time when such items as ACA premiums have soared and the deductible offerings are shifting the mix in the wrong direction. Too many people have had to drop coverage or see deductibles spike to find “affordable” health care.
The total energy bucket MoM and the YoY metrics are down sharply from 23.5% to 15.7%. Within energy, the gasoline CPI of +26.7% is ugly but beats the 40.5% gasoline CPI of May. With the Strait of Hormuz “shut” again and the dubious “ceasefire” over, the war enters a stage of uncertainty on how long and how damaging.
The higher costs of housing are uglier when including financing and the monthly payment pain even if the CPI metrics do not capture that effect. Mortgages and the cost of financing do not get factored into the product line CPI. The UST curve and mortgages and auto financing are clearly going in the wrong direction in 2025-2026 and are likely to get worse.
With many households crushed by health care premiums (notably the ACA), the consumer is certainly not “feeling the deflation” in health insurance seen in the table. Those that struggle with coverage then get held hostage to the rising costs of services as broken out. The 5.5% for “hospital and related services” is high by any measure with 6.1% for the outpatient subset. In other words, if you lose coverage, that is waiting for you with prices high in absolute terms. Trump’s lack of effort in health care is one of the worst consumer headwinds and notably in the lower part of “the K.”

The above table updates some of the lines near and dear to households. Airline fares at +26.5% in June barely moved from the +26.7% in May and are heavily tied to jet fuel costs. These lines are a mixed picture with divergences across lines within these buckets.
The Apparel CPI eased to 3.9% after 4.8% in May. Trump looked to inflict pain on the low-cost Asian countries, and I am surprised it is not higher. Trump lost on IEEPA and that had heavily targeted Asia. Trump is now using the Section 301 “forced labor” strategy to raise tariffs on essentially all trade partners. Total apparel at 3.9% is down sequentially with the total Footwear line at 4.1%.
As we go to print, WTI is a fraction under $80 and Brent is near $86. WTI had a $68 handle in the first week of July. That was a short reprieve.
See also:
Market Commentary: Asset Returns 7-12-26
Existing Home Sales June 2026: The Stall is On 7-11-26
Market Commentary: Asset Returns 7-5-26
Happy 250th Birthday America 7-3-26
Employment Situation June 2026: Back to a Crawl 7-2-26
JOLTS May 2026: Openings Flat, Hires Down, Layoffs Up 7-1-26
Music to Ponder: Hope Rising or Blood Simmering? 6-30-26
The Election Gambit: Economic Risk and Policy Uncertainty 6-29-26
JD Vance and Nixon History: Clueless 6-27-26
Personal Income & Outlays May 2026: Bad Inflation, Balanced Spending 6-26-26
New Home Sales May 2026: Weak Volumes, Stable(ish) Prices 6-25-26
GDP 1Q26 Final: PCE Growth Plunge 6-25-26
Trade Deficits: The Moving Parts and Macro Goals Matter Most 6-24-26
The FOMC Dance: Will Warsh and Trump Find a Rhythm? 6-17-26
Housing Starts May 2026: Weaker for both Single Family and Multifamily 6-16-26
Industrial Production May 2026: Steady, Balanced Utilization Levels 6-15-26
Geopolitical risk: Trump’s Nuclear Saber Rattling? 6-14-26
Producer Price Index May 2026: Too Many “Since 2022” References 6-11-26
CPI May 2026: The 4% Rubicon 6-10-26
Remembering D-Day: June 6, 1944
Employment May 2026: Big Rebound, Low Multiplier Bias 6-5-26
The Fall of CBS 6-3-26
Retail Signal Read Part Deux 6-1-26