


With GM (7/21) and Ford (7/28) set to report earnings and offer updated guidance, we update the Ford and Ford Motor Credit chart collection and await the peak season news. Guidance from such consumer bellwethers will offer some visibility as to how the curve and Iran have influenced expectations on volumes and consumer preferences. The average new vehicle buyer is arguably above the “K” midsection with the average used car buyer below it.
Ford has been able to sustain stable credit quality across a wild period that included a pandemic, a very brief recession (2 months), an inflation spike, a rapid tightening cycle, then back into an easing cycle, and now a potential return to tightening. Ford also faced a whipsaw of regulatory aggression that first attacked traditional ICE propulsion under Biden before an equally aggressive attack on EVs under Trump. The Russia-Ukraine experience of 2022 seems forgotten as a major factor in the CPI spike (too busy blaming Biden for everything) and the latest Iran situation is at a crossroads that can mean a return to semi-normalcy or severe escalation (civilian infrastructure attacks, Houthis shuts down Red Sea, etc.).
Capex excess on EV expansion in the end generated waves of multibillion dollar write-offs as investments proved uneconomic with EV consumers much smaller in scale than expected, and the EV sector broadly undermined by policy actions. That made for tough headlines, but billions in impairments and related charges now fall into the “that was then, this is now” bucket.
Ford’s ability to adapt and adjust to most any cyclical backdrop and competitive conditions have been demonstrated with the ultimate (but largely forgotten) ability of Ford to be the sole member of the legacy Detroit 3 to avoid Chapter 11 back in 2009.
We vote more with the stock market’s assessment of Ford’s prospects than the muted and mixed credit rating agency view on Ford’s performance and risk profile. We see Ford financial metrics as stable and clearly investment grade caliber in contrast with the mixed “cusp” credit ratings. EBIT trends and free cash flow guidance are constructive even if targets could be slow to be met given the uncertain macro backdrop and Iran fallout.
Ford faces less daunting tariff threats than GM in terms of its geographic mix of production with Ford the #1 manufacturer of light vehicles in the US. In contrast, GM has a heavy exposure to Mexico that is slowly being addressed under the Trump tariff regime. Uncertainty around the pending USMCA review will generate discussions on supplier chain costs and domestic content aspects that come out of any final move by Team Trump on trade. GM shows a clear edge right now in its ICE product cycles with Ford closing the gap while Stellantis and some other major US operators (notably Nissan) have been struggling badly.
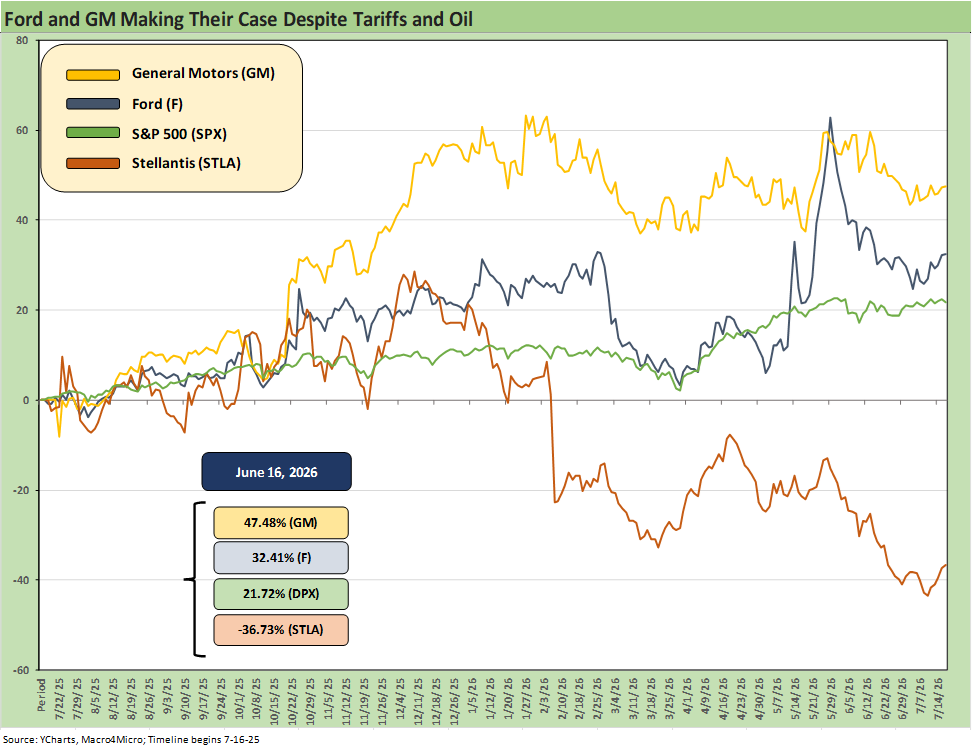
The above chart plots the total returns over the trailing 1 year for Ford, GM, and Stellantis (STLA) against the S&P 500. STLA is in its own zone of pain and is a story for another day. The running returns for STLA remain grim across a range of timelines. GM is in the best shape in its risk profile even with its outsized Mexico exposure. The company is very well set even in EVs but its core strengths were in ICE SUVs and trucks (see Credit Profile: General Motors and GM Financial 10-9-25). Ford spent the past year playing catchup with GM as it navigated the EV shock and radical shift in policy and how Ford and GM would both adjust to the higher tariffs that also fell hard on the import competition.
The headlines around Ford in 2025-2026 have been more about the scale of the setbacks from a failed EV push that was undermined by dramatic policy changes. That naturally generated “special items” and restructuring charges associated with the Electric Vehicle (“EV”) ambitions. Those EV related charges comprised the bulk of the $17.4 bn in FY 2025 and $15.5 bn 4Q25. EV cost pressures include some cost recovery for the suppliers that committed capex to tech and product lines.
Despite a difficult rear-view mirror wrapped around EV losses that will never be recouped, the post-1Q26 boost in guidance and projections for FY 2026 show sustained profitability in the two core, profitable segments (Blue and Pro) and cash flow that keeps Ford quite stable in credit quality even with higher capex. Free cash flow is a positive factor in the Ford story. There is cyclical room to maneuver.
Some big swings in OEM equities…
Ford’s equity performance was chasing a superior performance by GM, who has outperformed autos as well as the broader markets. On a YTD basis, Ford equity is now ahead of GM, but GM is well ahead for the trailing 1 year, 3 years, and 5 years. The good news is Ford and GM are outperforming the “Japan 3” (Toyota, Honda, Nissan) and Kia/Hyundai over 1Y and 3Y.
The headwinds from the EV whiplash across the Biden-to-Trump transition were brutal as one went from the “War on ICE” to the “War on EVs.” In addition, Trump tariffs slapped an incremental $2 bn in expenses on Ford above the $2 bn headwinds from the Novelis fire in Oct 2025 and related disruptions along the supplier chain.
Ford nonetheless has pushed through those setbacks and has been guiding to materially higher profits and higher margins in 2026 to go along with higher capex. The Adjusted EBIT range for 2025 was bumped up by $500 mn to a range of $8.5 bn to $10.5 bn. Adjusted free cash flow for FY 2026 of $5 bn to $6 bn stayed unchanged at 1Q26 from where it was during 4Q25 earnings.
The cyclical volume variable…
Industry volumes have held in well with a small industry decline in 1H26 car and light truck sales of -2.7%. Ford has lost some share in the process with 1H26 sales down by -9.6%. We cover the Ford sales deltas in charts further below. Ford SUVs were down -12.1% with trucks off by -9.0%. The F-150 was still the top selling model but with GM still the top seller of pickups when you combine the brands. For the overall industry, 1H25 was the best in 6 years, so the 1H26 comps are tough.
Volumes are not always the main story across quarters, and the goal is not maximizing share and volumes but instead prioritizing profits. Ford has faced some pressure on volumes such as the F-150 with constraints on aluminum supply. As the trade publications emphasize, the goal of maximum profitability can be achieved with less volume. It is about optimizing mix and option packages across the lineups. The quality of the Ford model and product segment mix is in a very good position at this point.
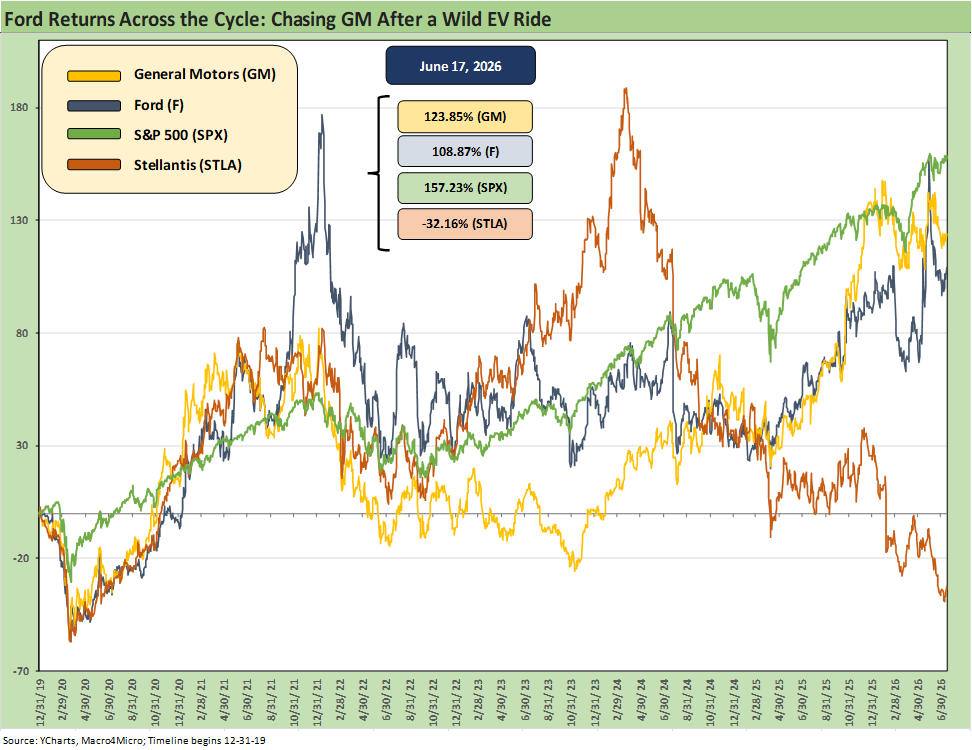
The above chart uses a timeline starting at the end of 2019. We see the S&P 500 winning on the tech boom but GM and Ford both turning in very solid performance over the period. Stellantis is once again in the tank.
The market volatility underscored some companies (including Ford) were viewed as the way to play the EV priorities being pushed by Team Biden and Congress (remember the days when legislation was used and the balance of powers were more than a distant memory?). That was also a period before tariffs started to nuke low-cost global supplier chains built over decades.
If we use a starting point on the legacy Detroit 3 “auto comps” from the pre-COVID period as in the chart above, we get a look at how Ford vs. GM framed up across an array of mini “cycles within cycles.” The 2020 to 2026 timeline included a pandemic, ZIRP, the Capitol being sacked, a de facto declaration of war on the internal combustion engine (ICE) by Biden, an inflation spike in 2022 to the highest since Carter/Reagan, a Fed tightening cycle from March 2022, then a brief easing cycle starting in late 2024, and then a declaration of war on electric vehicles by Trump in 2025-2026.
Along the way, the world faced two oil shocks with the late Feb 2022 invasion of Ukraine by Russia and the joint US-Israeli attacks in Iran in 2026. That last one is still unfolding in somewhat erratic fashion. The propulsion mix and relative risk and economics are still shifting with hybrids seeing rising demand.
The Mideast war was a memory lane moment, and I could not help but think back to Chrysler bonds at 50 cents on the dollar as Desert Storm approached in 1990 and Chrysler getting bailed out during the Carter years with the Iranian oil crisis (1979). Both brought recessions.
Tariffs, supplier chain, and structural change…
We now have the additional wildcard of tariffs and global supplier chain stress along with the potential termination of the NAFTA/USMCA agreement. The past quarter century was about the overhaul of the legacy Detroit global footprint, radical capacity downsizing both before and after the 2009 bankruptcies, and the explosive growth of the US transplants (Japan, Korea, Germany).
More recently, the multi-decade and multicycle evolution of low-cost global supplier chains is now being shredded by tariffs and protectionism. Mideast war with oil prices still facing a potentially wide trading range is an X factor in a period of high inflation in post-1990 context.
The main point is the post-restructured Ford and GM have clearly demonstrated an operational flexibility that allows them to react to setbacks that would have blown them up before 2009. The structural changes that unfolded in industry evolution since earlier cycles make for lower levels of business risk. GM and Ford are now essentially North American and US-centric auto OEMs after global ambitions were dialed back by reality that led to GM’s post-Chapter 11 and the Section 363 “new GM.”
The Chapter 11 history and acquisition of Chrysler by Fiat is another convoluted story on the way to the creation of Stellantis. The grim Stellantis performance in the equity markets is evident in the chart. The legacy Chrysler piece of that operation is a separate topic. STLA carries its own tragic history as the company struggles badly yet again.

The above table offers a top-down financial view of the timeline from the bull market ZIRP year of 2021 through FY 2025 and then the 1Q26 vs. 1Q25 period. The low financing costs were running alongside post-COVID pent-up demand that saw used vehicles cleared off the lots with used vehicle inflation spiking to north of 40% in early 2022 (see Automotive Inflation: More than Meets the Eye 10-17-22). Even away from a mass pandemic, that was a very unusual time in the auto sector.
As noted above, the transition from the “war on ICE” to the “war on EVs” has generated billions in costs even if the majority of the costs are noncash impairments. The $11.8 billion loss in 2025 includes $17.4 billion in special items with $15.9 billion tied directly to auto restructuring. That included $10.7 bn in Model e asset impairments and $3.2 bn associated with the disposition of the BOSK JV (battery venture with SK ON). Another $1.2 bn was tied to the cancellation of the 3-row SUV electrification. The EV vs. ICE policy whipsaw has been very costly.
No shortage of risk factors that are tough to quantify…
In today’s world, the biggest manufacturing cost threats are tariffs and materials cost pressure (notably petrochemicals, aluminum and copper). The latest wave of upward price pressure on semiconductors is a unit cost challenge as autos compete with AI and data center demand. Supply is tight, delivery schedules crowded, and chip prices soaring (DRAM) with the rapid advances in auto tech and software. The “labor arb” decisions to focus on Mexico suppliers could also see more pressure at the same time Canada is the low-cost aluminum producer of choice facing tariffs. The USMCA is a material risk factor as dictated by the White House. Congress does not play a role.
The consumer household cash flow pressures also weigh on fundamentals. Weak to negative real wages matter and influence the “new vs. used” decision. Household pain is tied to broad CPI increases and higher funding costs along with materially rising healthcare costs for services and health insurance - despite what the CPI lines say on the latter (see CPI June 2026: Eye of the Storm? 7-14-26).
The undermining of lean manufacturing…
There is no need to repeat the list of the wild times, but we would rate the protectionist tariffs and disruption of global supplier chains at the top of the challenge list from materials across the Tier 1, 2, and 3 component suppliers. The defining discipline of “lean manufacturing” sprung from many global OEMs trying to see what they could learn from the Toyota Production System (“TPS”) in the early 1990s since the #1 Japanese OEM was eating everyone’s lunch. An OEM-sponsored MIT study produced a very readable book “The Machine That Changed the World” that broke out “how it’s done.”
We can summarize the problem now as those systems and approaches – which can take decades to get right – are now getting slammed by Trump’s trade policies and erratic tariff strategies. If you read the auto trade publications, you get a sense of the disarray and panic in many pockets of the auto sector from suppliers to OEMs.
Management teams do not preach out loud about the common-sense damage from tariffs out of fear of retribution and the ongoing need to lobby to mitigate damage. The least resistance strategy is to “wait out” Trump and see if the “next guy” can admit that the buyer pays the tariffs – not the seller. Trump missed that fact early and often and will never reverse himself.
USMCA and EU trade tension…
The USMCA nonrenewal will be the biggest wildcard ahead in 2026 for the auto sector, and the good news for Ford is that they are the least exposed as the #1 producer in the US with much lower exposure to Mexico than GM. EU and Japanese transplants and import tariff impacts are another source of cost pressures that need to be eaten by OEMs or flowed through.
The tariff cost threats typically get quantified by GM and Ford on earnings calls, but the fallout along the supplier chain is a major worry as they seek cost recovery from their large customers.
Loan rates squeeze affordability…
The broader topic of inflation and higher rates hit the consumer in retail financing costs that do not show up in the auto CPI and average transaction payments CPI line. That is the same for home price inflation where monthly payment pressure rules.
The “average marketed price” for sales at dealership hit $51,794 at the end of June (per Automotive News). The average monthly payment on a new vehicle is now over $770. If we look at the median payment for all new auto loans from 2020 ($580), the nominal payment is now 34% higher. In many areas of the US, that new vehicle monthly payment is a rent check. The loan terms have been extending more frequently to 84 months with recent data for 1Q26 showing originated loans at over 1/3 of loans beyond 72 months in the interest of making monthly payments more affordable.
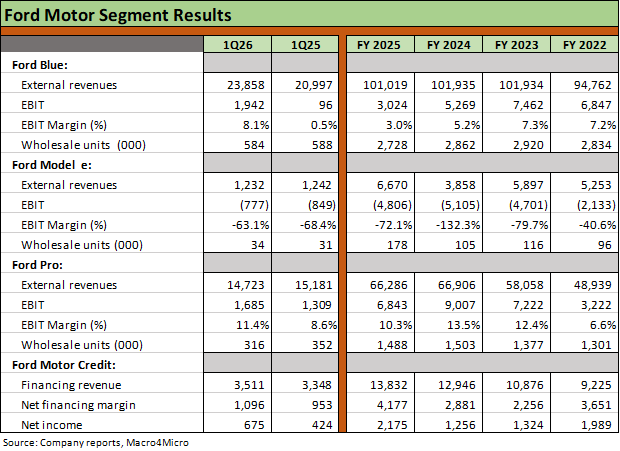
The 3 major business reporting segments were revamped back in 2023 with the main theme being the vehicle propulsion and/or the customer segment (notably retail vs. commercial and fleet). The commercial and fleet customers sales roll up under the Pro segment, so it is not solely the vehicle types. The emerging and growing Ford Energy business is in the Ford Pro segment given its commercial customer focus. Ford Energy is not in the Model e segment. The expectation on Energy is for favorable growth and higher multiples assigned to those assets. That will start to get more visibility in coming quarters.
The divergent profitability of the segments certainly made the segregation of the loss-generating EVs a good reporting discipline to isolate the Blue and Pro mix from those ugly numbers in EVs. The reporting allows investors to track and isolate how much progress Ford can make in narrowing the massive losses in the EV-related business after all the billions in special item charges and shifting strategy in electrification.
The Ford Blue segment includes the ICE and hybrid vehicles sold to retail customers and includes retail sales of F-150s even if the brief life of the F-150 Lightning sales rolled up in Model e.
For Ford Motor Credit (FMC), the earnings power and asset quality is reassuring that the unit will continue to be a major source of earnings power and a source of dividend cash flow for the parent company.
Guidance by segment…
Ford offers FY2026 segment EBIT guidance in its 1Q2610-Q:
Ford Pro EBIT of $6.5 bn to $7.5 bn.
Ford Blue EBIT of $4.5 bn to $5.0 bn.
Ford Model e EBIT with a loss of $4.0 bn to $4.5 bn.
Ford Credit EBT of around $2.5 bn.
This guidance is within a consolidated adjusted EBIT guidance of $8.5 bn to $10.5 bn. The EV and related business lines have been a major use of funds and capex, and the policy differences across two administrations inflamed the scale of the capex boom in the case of Biden and decimated the earnings potential of that capex under Trump. The old adage of “let the consumer decide” goes back decades to “big car vs. small car” and “gas guzzling SUVs vs. high mpg economy cars.” This latest policy whipsaw was likely the most costly in history. That responsibility is shared by excess under Biden matched up with excess under Trump.
The theory now is that the industry will go through a period of stability in such policies at least through 2028 and that some lessons have been learned on how a war on propulsion categories brings a great cost and a lot of political risk. The OEMs should at least have a period of calm and less of that battle as they get back to “what they can profitably sell” with hybrids seeing high demand but EVs still a part of longer-term planning. Ford is well positioned to prosper with that backdrop as is GM.
Model strategies are for other days, but the propulsion debates likely will take a back seat to more nuanced model plans that also take into account the tariff and supplier chain costs as well as consumer demand.
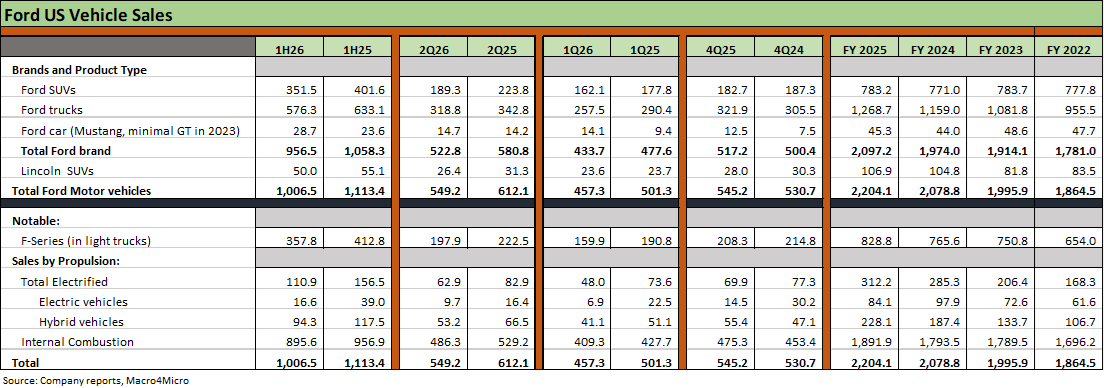
The above table breaks out the detail on Ford and Lincoln product segments across the timeline and also the mix shift by propulsion types. We also see the pattern of EV volumes since 2022. We picked 2022 to start the timeline since it was a tightening year that undermined affordability via financing costs. The financing costs do not get captured in vehicle CPI (new or used). The total sales volume rose each year into 2025 with 2026 now showing some declines for 1H26 vs. 1H25.
The 2022 period was a year when EVs were ramping up to a 2025 peak. The declines in EVs stand out in the 2Q26 and 1Q26 periods. As we cover elsewhere in the report, the massive EV capex and product line investment led to the charge-offs of 2025 after the EV policies were whipsawed by the policy reversals with the change of administrations.
We also see some fade in Ford’s hybrid totals, but the industry trade rags have made it clear that demand for hybrids has gained a lift from the Iran turmoil. The now-cancelled Ford Escape (2026 final year) has a high mix of hybrids so that was a major factor. Ford has placed a priority on more hybrid offerings across its product lines and a much more measured and tactical game plan for EVs.
Ford cited the phaseout of its legacy high volume Ford Escape and also cited a 69% decline in daily rental sales volumes.
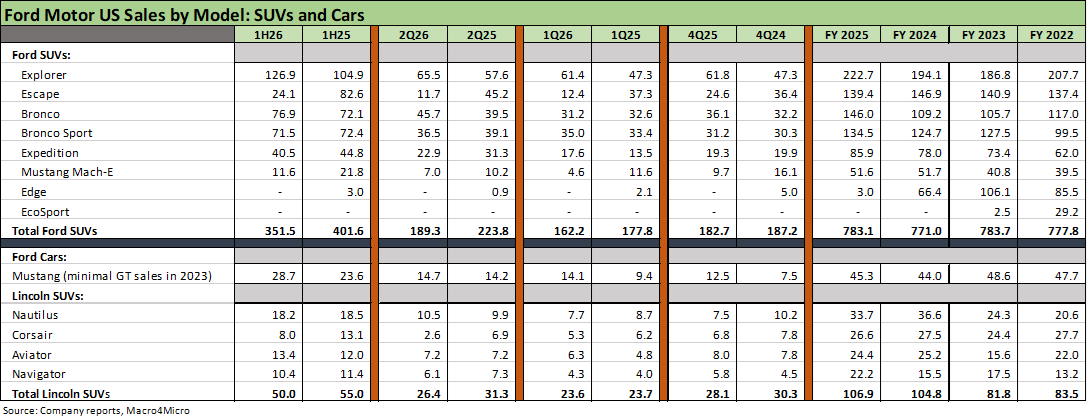
A world where few vehicles are called “cars” has been a trend over the decades with Ford a dramatic case in point with the low volume Mustang. GM uses different labels. The SUV/CUV mix runs the gamut, but the trend overall has seen declines in volume. Total SUVs were down -15.5% in 2Q26 and by -12.1% in 1H26. The larger truck-like Bronco is higher while the smaller (more car like) Bronco Sport is down slightly.
The iconic Explorer posted a +13.8% 2Q26 YoY and +21.0% for 1H26. The large Expedition has struggled, down -27% in 2Q26 and by -9.8% in 1H26.

Ford’s truck franchise is led by the F-150 full size pickup, which is regularly flagged as the #1 selling pickup (in fairness to GM, the Chevy Sierra and GMC Silverado are the #1 pickup offerings in total but across 2 brands). There is the reality of the sales declines and market share erosion in 2026 for the F-150 with 2Q26 at -11.0% and 1H26 at -13.3%. Bronco set 1H26 and 2Q26 records.
The Ford Maverick compact pickup has been a success with its shared platform with the Bronco Sport and has bragging rights as the #1 best-selling hybrid pickup. Maverick posted modest volume declines in 1H26 at -5.0% and 2Q26 at -0.4%. As a unibody platform, it is more carlike (CUV like) than the midsize Ranger pickup. The Transit van has been a very solid and steady performer also as evident in the time series.

The cash flow history of Ford since COVID is reassuring when you consider what unfolded during that time. With capex teed up for an increase to $9.5 to $10.5 billion in 2026, Ford will not be defensive in pursuing its longer term targets including a low cost, profitable EV geared to the right scale to meet customer demand.
The table also offers a reminder of how Ford Motor Credit is a highly profitable stand-alone profit center that supports its independent dealer network. At the same time, FMC has been a major source of dividend cash flow to the parent company. The material increase in dividends in 2021 capture the reality of cash flow generation when volume trends lower and receivables get liquidated, in turn generating balance sheet downsizing to upstream to the parent. The 2020-2021 period saw $10.8 bn in total dividends to the parent including $7.5 bn in 2021.
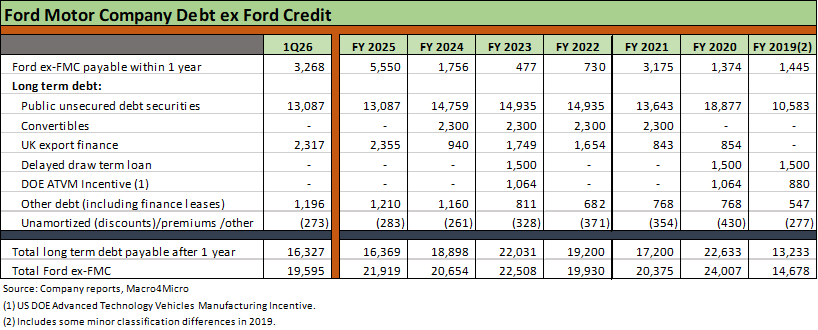
The above table updates the balance sheet for Ford (ex-FMC) in the period from 2019 through 1Q26. We see the peak borrowings during COVID in 2020 over $24 bn ahead of the reduction in debt to under $20 bn in 2022 and under $20 bn at 1Q26. Long term debt is at the lowest since 2019. Cash and marketable securities at 1Q26 for Ford ex-FMC totaled just under $22 bn, so the balance sheet is strong and liquidity heavy and all set against a Ford equity market cap of over $56 bn.
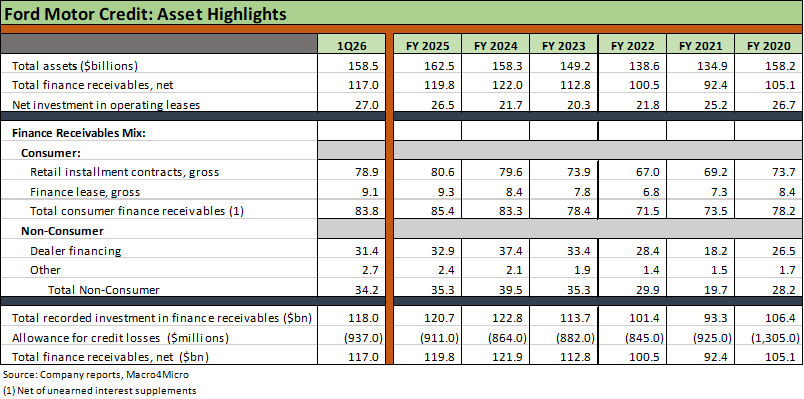
The Ford Motor Credit asset base is detailed in the above table. The asset totals and mix highlight where the earning asset base had trended in size and mix. For FMC, revenue is dictated by the average earning asset base, interest income generated by those assets and how that frames up vs. the interest expense cost to fund the balance sheet. The level and shape of the yield curve help set the net interest margin. Swings in asset quality and prudent provisioning on the expense line determine where the income will be reinvested or upstreamed as dividends.
We see total finance receivables down from the FY 2024 peak with retail contracts barely lower and dealer financing receivables modestly lower. Allowance for credit losses ticked higher sequentially in 1Q26 from year end on higher provisioning as covered in a separate table herein.
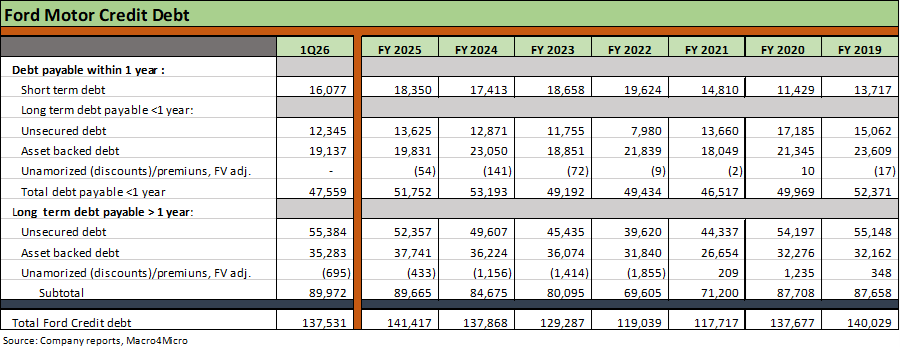
The above table plots the debt layers of the FMC capital structure across the unsecured debt and asset backed layers. The balance sheet strategy includes a diversified funding base and a target financial leverage ratio of 9:1 to 10:1. The liquidity and quality of the asset base make such leverage metrics easily manageable. The ratio at 1Q26 was 9.5:1, which was flat YoY.
The captive finance units of Ford and GM are a core part of a highly integrated chain that includes the independent dealer network. That ability to adjust the balance sheet to the needs of the end market has been demonstrated across the cycles. FMC is a low risk credit exposure with the ratings tied to the parent auto operations. The exceptional financial flexibility of FMC is rooted in the liquidity of its receivables, the ability to fund in the ABS markets, and the quality of the asset base.
The Ford dealer network can fund their customer sales with other banks or with Ford Motor Credit (FMC). The riskier loans to fund weaker borrowers and higher risk used vehicles are often handled elsewhere with nonprime and subprime consumer lenders who focus on the riskier customer or older used cars.
There is plenty of disclosure on asset quality and counterparty risk that details the risks across the credit tiers and plenty of metrics to monitor.

The above table details the asset quality trends on a worldwide level. We see the charge-off numbers, the credit loss reserve cushion, and loss-to-receivables (“LTR”) trends. We see the LTR eroding while the reserve ratio has been steady since 2023 but below 2021 and 2020. The LTR will be one to watch if charge-offs tick higher, which we expect they will.

The loss reserve has risen as higher charge-offs generated a higher provisioning need with higher interest rates increasing the burden on consumers in the current market. The 1Q26 provision of $172 million is materially higher than the $140 million in 1Q25 just as FY 2025’s provision of $528 million is much higher than $417 million in FY 2024 and only $278 million in 2023.
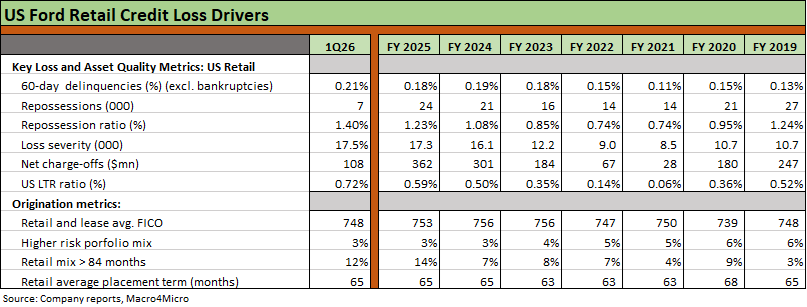
The table above details the US retail credit metrics. We see the LTR metrics weakening at 0.72% and delinquencies higher from year end at 0.21%. The repossession rate is also rising to 1.40% along with the loss severity to 17.5%. FICO scores remain high and higher risk portfolio exposure minimal at 3%. A FICO of 748 is prime but the lowest since 2022.
The exposure to longer maturity retail loans of >84 months has been rising steadily through 2025 to 14% as we have seen across the industry but ticked down to 12% in 1Q26. That trend has allowed monthly payments to move lower to “get the vehicle sale printed” but also creates intermediate term risks of higher losses on repossession and increases exposure to negative equity risk as residual values decline.
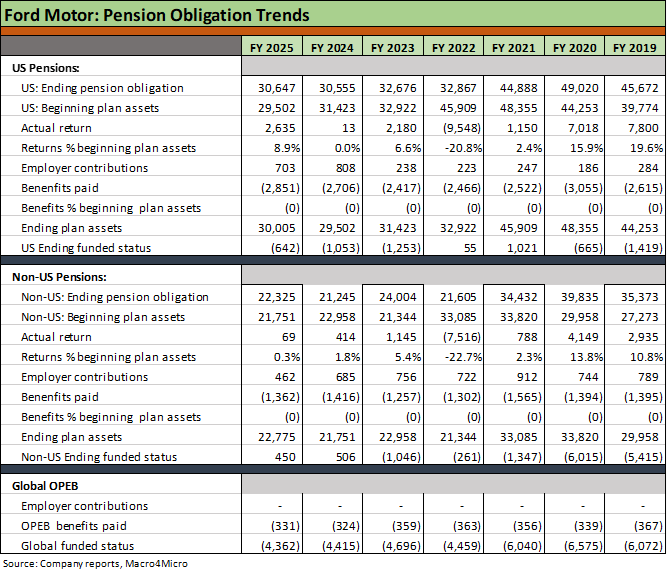
The above table does a similar exercise to what we did with General Motors (see Credit Profile: General Motors and GM Financial10-9-25). We look at Pension and OPEB (health care) retirement obligations and the trend line across a very volatile period for the underlying FASB assumptions (notably discount rates) and how they flow into the financial risk profiles of Ford. The GAAP accounting vs. ERISA accounting is always a big caveat, but you work with the data they give you that comes out once a year with some occasional interim adjustments.
We have written a lot on the pension topic over the years in following the auto sector, and the short form version goes something like this:
Debt like vs. contract risk: Pension liabilities have statutory clout and funding requirements, so the pension line is more “debt like” while OPEB is more about “contract risk” than debt. One can argue the point on how these obligations are treated for accounting purposes, and the economic substance of FASB requirements is an old topic. For credit risk assessment, the more important lines to watch are funding requirements as detailed in the financials and footnotes and unfunded defined benefits as a proxy for debt-like exposure. OPEB is typically a “pay as you go” expense to watch.
Funding plans consider “minimum” vs. discretionary”: The funding activities of the Ford plan are routinely disclosed and vary materially from the periodic GAAP expense recognized. The above chart details the net funded or unfunded exposure across a very active period of assumption variation from 2019 and then across COVID, ZIRP and a tightening cycle. For pensions, Ford contributed $720 million in 2025 to funded plans and expected to make $550 mn in 2026. Global OPEB benefit payments were $331 mn in 2025 and $324 mn in 2024.
GAAP treatment vs. ERISA measurement: There is an important distinction between GAAP and ERISA accounting rules in funding requirements and statutory risk exposure. Legislative relief on discount rates had been routinely provided and updated after the credit crisis to mitigate the damage of materially lower discount rates that come with the UST curve impacts that would have stressed corporate sector liquidity.
Discount rates as a major driver of book liabilities: The underlying assumptions can really whip around the projected benefit obligation as we see in this very unusual stretch of yield curve migration from 2019, across the pandemic and ZIRP period, and then on into the tightening cycle as ZIRP ended in March 2022 with rapid tightening before the start of the easing cycle again in Sept 2024. The derisking strategy of Ford’s pension asset allocation includes a dominant share of fixed income to mitigate the effects of moves in interest rates. At 12-31-25, Ford’s US pension held almost $25 billion in fixed income (excludes equities and NAV assets) out of $30 bn in assets supporting the US plans.
Pension-adjusted balance sheets: The use of pension adjusted leverage metrics get some limited focus in the case of mature industries with massive defined benefit pension plans (automotive, legacy airlines, utilities, defense and aerospace). Pension-adjusted leverage or adjusted Enterprise Value metrics (Pension Adjusted EV/EBITDAP multiples or the seldom used pension and OPEB adjusted EV/EBITDAPO, etc.) get some lip service, but few hang their hats on such valuation. They can use it for comps with suppliers. Even then, you can get a debate on whether to use tax-adjusted unfunded liabilities (you need to pay your pension whether you are a taxpayer or not).
Statuary funding requirements vs. discretionary is the main event: Funding pensions is an expense and a use of cash even if the funding event for ERISA can differ materially from the GAAP pension expense. It is worth monitoring in the case of DB-pension-heavy issuers since the use of cash is an important variable in considering debt levels, share buybacks and dividend paying power. As the years go by, DB pension plans get closed or frozen, and the actuarial tables take their course (Grim Reaper, etc.), when the pension risks diminish. OPEB becomes more a recurring cost of business with many companies taking the approach of “when you hit 65, Medicare is your destination” (Get off my lawn!) That is especially the case with salaried employees vs. hourly, unionized workers.
“Closed” or “frozen” matters: With collective bargaining agreements, the terms of the pension and OPEB plans overlap with health care benefit terms for current employees. That makes it a sensitive subject for current retirees and current employees alike. Those UAW contract topics across history are not for this commentary. That battle between employers and union employees on legacy defined benefit plans (“DB” plans) vs. defined contribution (“DC” plans) have been playing out across the cycles. “Closed plans” do not take new members (“DC plans only” for new employees. UAW plans such as those at Ford are closed to new entrants with new hires in defined contribution.