

The network of partners is the cornerstone of the Synchrony strategy.
We drilled into Synchrony Financial (SYF) in detail in an earlier commentary and we see SYF as a useful indicator of the broader consumer credit quality picture (see Synchrony: Credit Card Bellwether 10-30-25). SYF’s quarterly earnings reports include exceptional granularity in its disclosure, making it an attractive lender to monitor. While SYF is much smaller than a major bank such as Cap One as an entity, SYF’s 68 million customer accounts, $50 bn in purchase volume, and over $100 bn in loan receivables cut across a very wide array of retail channels and touches a products/services mix in its partners network that has impressive consumer breadth.
After 1Q26 GDP posted abysmal growth in personal consumption expenditure (PCE) of 0.5%, the trend line has appeared to firm in the income and outlays releases (see Personal Income & Outlays May 2026: Bad Inflation, Balanced Spending 6-26-26, GDP 1Q26 Final: PCE Growth Plunge 6-25-26). The consumer sector will now face another test with oil spiking again and household anxiety at a possible inflection point if we see more challenges in household income, the job market, or inflation expectations.
Anything that hits household cash flow can compromise asset quality, and the main events there are inflation broadly, higher health care premiums, and the consumer cash flow pressures from the oil spike. The downstream damage from oil is gasoline costs, a diesel spike that flows into surcharges and inflation (freight and logistics, ag sector, food costs, and later in year home heating bills for many). The soaring airline fares also factor into the story line into the peak summer travel season.
The oil price and gasoline spike carries the ironic advantage of driving purchasing volumes higher at the pump. That still puts debt service pressure on customers and in some cases serves as a zero sum effect on customers in other categories. Of course, there is the more obvious risk of accounts simply engaging in more borrowing and saving less. The market has seen savings rates decline in the monthly PCE releases (income and outlays) data.
The headlines around political turmoil and distrust – not to mention election threats –can also disturb consumer habits and cause government shutdowns. The “communist vs. fascist” thing and “savior of Christianity vs. corrupt pedophile” banter is not going to help many moods. Then again, the upper part of the “K” recovery will either keep spending or embrace retail therapy in a world that is going to hell. The problems are in the lower part of the K, so we will keep watching aggregate credit quality metrics from bellwethers such as SYF and volumes and quality coming out of auto finance.
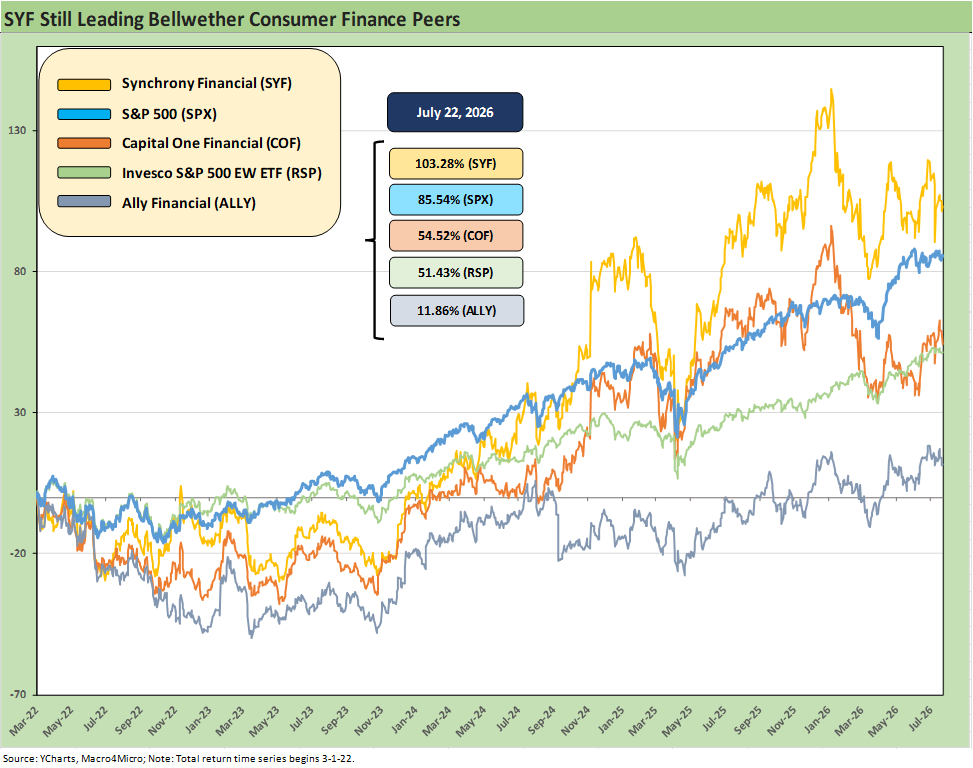
The above chart updates the return performance of Synchrony (SYF) equity against Capital One, Ally, and the S&P 500. We also include the Equal Weight S&P 500 (RSP) to isolate the outsized tech weighting in the S&P 500. The obvious story is SYF wins. If we started the timeline at the end of 2019 ahead of COVID, SYF still wins. We thought the performance starting point from just ahead of the tightening cycle in March 2022 made for a useful frame of reference.
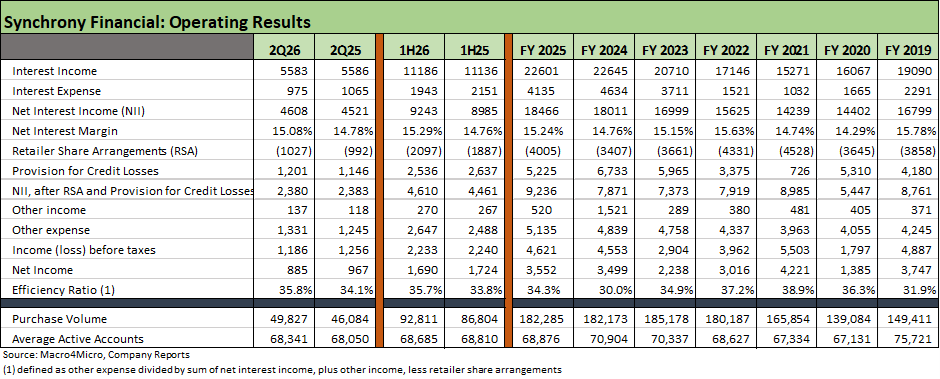
The above chart updates the major operating results line items. The +8% in purchase volume in 2Q26 came with +23% from co-branded cards. Loan receivables only grew by +2% to just over $102 bn while co-branded cards rose by +25%. Average active accounts were essentially flat at just over 68 million.
The strain of borrowing by households is not a new topic, and we cover the provisioning and net interest margins in the broader detailed commentary on SYF. We see an increase in the net interest margin to 15.08% in 2Q26 from 14.78% in 2Q25. The reality for the consumer and an important stabilizing factor for SYF is that a 21.6% yield on loan receivables buys a lot of cushion for market surprises with a provisioning policy that has been shown to be prudent.
The history of SYF goes back a long way from when it was GE’s private card business, and their history cuts across a lot of cycles. The recent years of COVID, an inflation spike, a tightening cycle, and two major oil spikes (post-Russia in 2022, post-Iran in 2026) put SYF to the test. They passed with honors.

The above chart updates the standard asset quality disclosure and moving parts of the allowance coverage and provisioning. The 90-day delinquencies are slightly improved into the low 2% range while charge-offs rate have also ticked lower to 5.43% in 2Q26 from 5.70% in 2Q25. FY 2025 posted 5.65% with 6.31% in 2024.
The allowance coverage ratio of 10.09% continues the low 10% handle balance seen since 2022. Prior to the 2022 decline, SYF saw 12.5% during the volatility of the pandemic period as they braced for impact. As it ended up, the year 2020 only saw 4.58% in charge-offs.
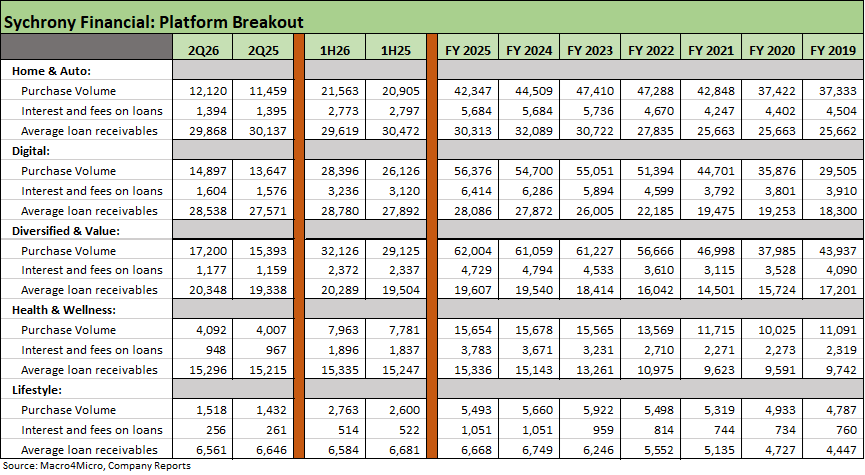
The above table updates the account spending volumes by platform category along with the related interest and fees on loans and the average loan receivables. All 5 platforms showed YoY growth in 2Q26 and in 1H26. Each quarter brings new partners and underscores SYF’s strategy has been working well for both customers and those goods and services companies in the partner ranks.
When you look at the high-level macro releases such as Personal Income and Outlays, we see savings rates declining to multi-year lows. That is consistent with spending firming up in spring 2026. With real wage growth recently hovering around negative or slightly positive, it is safe to say there is some incremental borrowing going on. We see it in the higher purchase volume detailed by platform above and in the total volume numbers seen above in the Operating Results chart.
The “purchase volume” part of the story reassures on consumer appetite to spend, so that is consistent with the old saying of “never bet against the US consumer.” Then again, asset quality trends across the full spectrum comprise a more complex set of issues in the “check-to-check” tier especially. The good news for Synchrony is its asset quality underwriting standards and risk management have held up well across some very unusual periods.