
Employment Situation June 2026: Back to a Crawl
The Iran resolution challenge still looms, but jobs and other macro risks look manageable given the mix of cyclical indicators.


Please just take care of the main risk first…
A weak job adds total of 57K for June showed a major sequential decline from stronger May and April numbers. Both May and April posted material negative revisions totaling -74K with April -31K (+179K to +148K) and May at -43K (+172K to +129K). The unemployment rate ticked lower to 4.2% on the Household Survey numbers that showed a decline in the number of bodies employed and unemployed alongside a decline in the labor force.
The Goods payroll only rose by +10K while Services rose by 39K and Government by 8K. The focal point of Manufacturing was only +3K with Durables +6K and Nondurables -3K. Among headline industry groups under the Goods heading, Construction was +11K on the back of +14.1K in “Nonresidential specialty trade contractors” more than offsetting -5.7K declines in “Residential specialty trade contractors.” In a reminder that capital intensity is different than labor intensity, the needle barely moved on “Computer and electronic product manufacturing” of +1.5K. “Motor vehicles and parts” declined by -3.9K, “Machinery” was +0.4K. There is a tendency to forget secular declines in some sectors and product groups and the process of reallocation of payrolls to other areas of manufacturing. The numbers do not support the tariff promises on jobs to this point.
Services payrolls ruled the delta payroll numbers and notably the “Big 2” of “Health care and social assistance” (+46.6K) and “Leisure and hospitality” (-61K) with -54.6K in “Accommodation and Food Services.” That “leisure” number is hard to explain to start the summer. Retail trade was -7.5K, and that one is easier to explain with many retailers getting hammered by tariffs and weaker consumers with PCE plunging in 1Q26 (see GDP 1Q26 Final: PCE Growth Plunge).
For the unemployment rate math, it is always worth a look at the numerator and denominator in the Household Survey. We see a decline of -213K unemployed for a total of 7,094K and a 4.2% unemployment rate (7.094 unemployed/169.36mn labor force). The number of total employed declined by -507K to 162.26 million. The labor force declined by -720K. In other words, everything was shrinking.
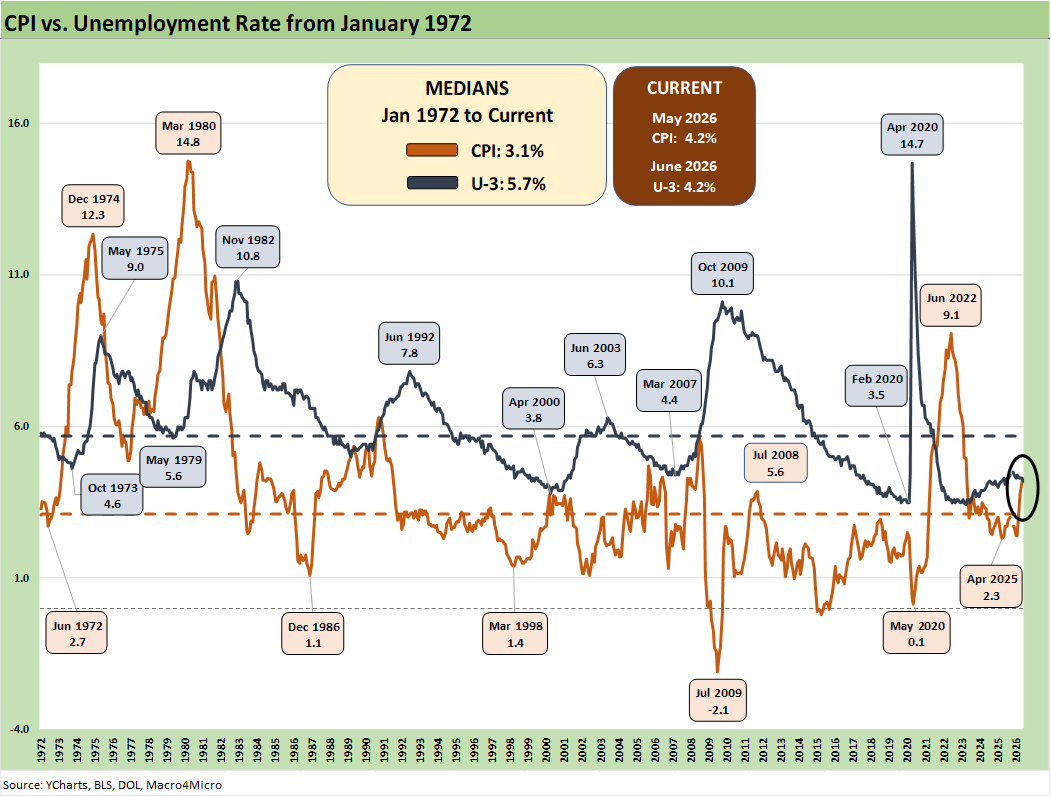
The average hourly earnings increase of 3.5% is not stacking up well vs. the 4% headline inflation numbers for both CPI and PCE in May (see Personal Income & Outlays May 2026: Bad Inflation, Balanced Spending 6-26-26, CPI May 2026: The 4% Rubicon 6-10-26). The 1Q26 GDP release posted a headline PCE price index for 1Q26 at +4.6% while the core PCE price index for 1Q26 was +4.4% (see GDP 1Q26 Final: PCE Growth Plunge 6-25-26). The story remains ugly for real earnings.
The JOLTS openings as detailed earlier this week show plenty of openings waiting to get filled as we move into the summer (see JOLTS May 2026: Openings Flat, Hires Down, Layoffs Up 7-1-26). That said, the good news only becomes a reality when the “paycheck count” rises. Hires have not been as robust. In looking at “job openings” the variable of when the opening might get filled looms. There is always the question of what major variables will speed up staffing (tariffs and USMCA risk? Iran fallout and getting the MOU in effect? Fed policy, clarity? etc.).
One can make qualitative assessments on the mix of occupations reporting increases in payrolls, but the reported number at least still meets the “MO jobs, MO money” rule to support consumer spending volumes. Now the question is “How much money is left for discretionary spending after the effects of inflation and lower real wages?”
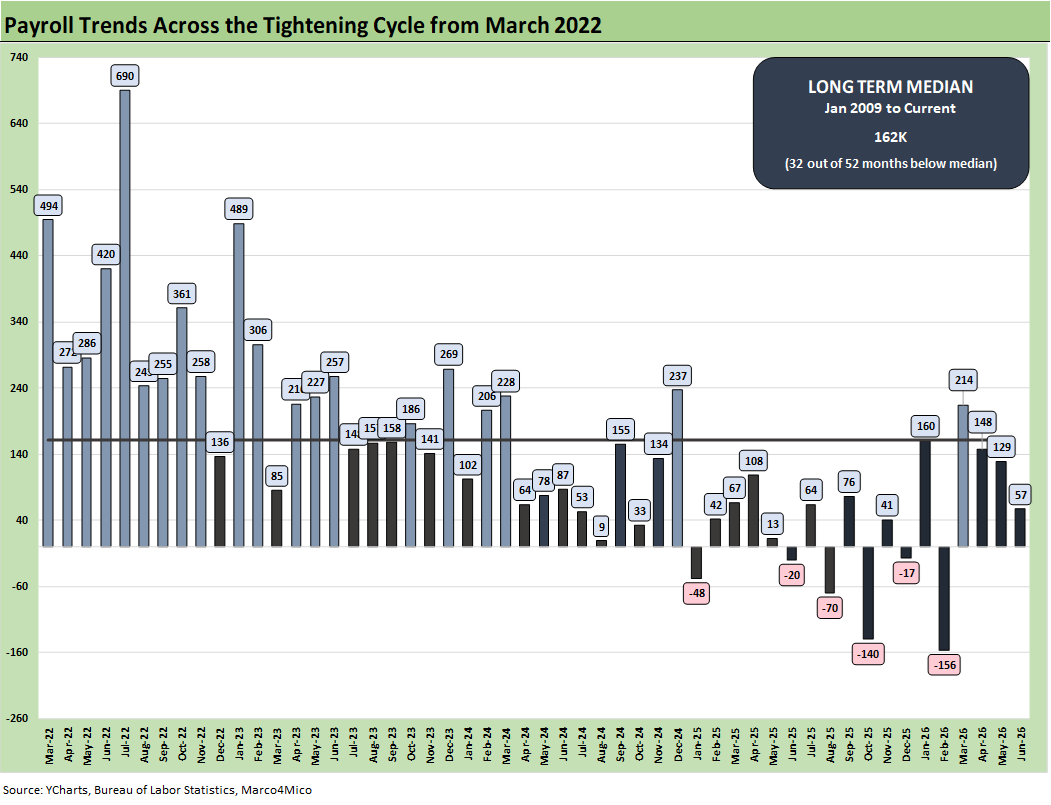
The monthly payroll adds/declines chart above starts in March 2022 with the end of ZIRP and the start of the tightening cycle. The bar chart tells an objective data story. The 2025-2026 period is not impressive. The same for 2024.
The payroll addition numbers in 2025 and 2026 include the only negative deltas on the chart since March 2022 with 6 months in the red during Trump 2.0. That long-term median of +162K includes a slice of the longest recession since the Great Depression, so it is not a high bar to clear. Since the Jan 2025 inauguration, Trump has exceeded the post-Jan 2009 median in a single month after the April and May 2026 revisions.
A glance back at the 2022 numbers offers a reminder of what a high rate of job adds looks like. Of course, the labor backdrop and immigration issues change the overriding variables.
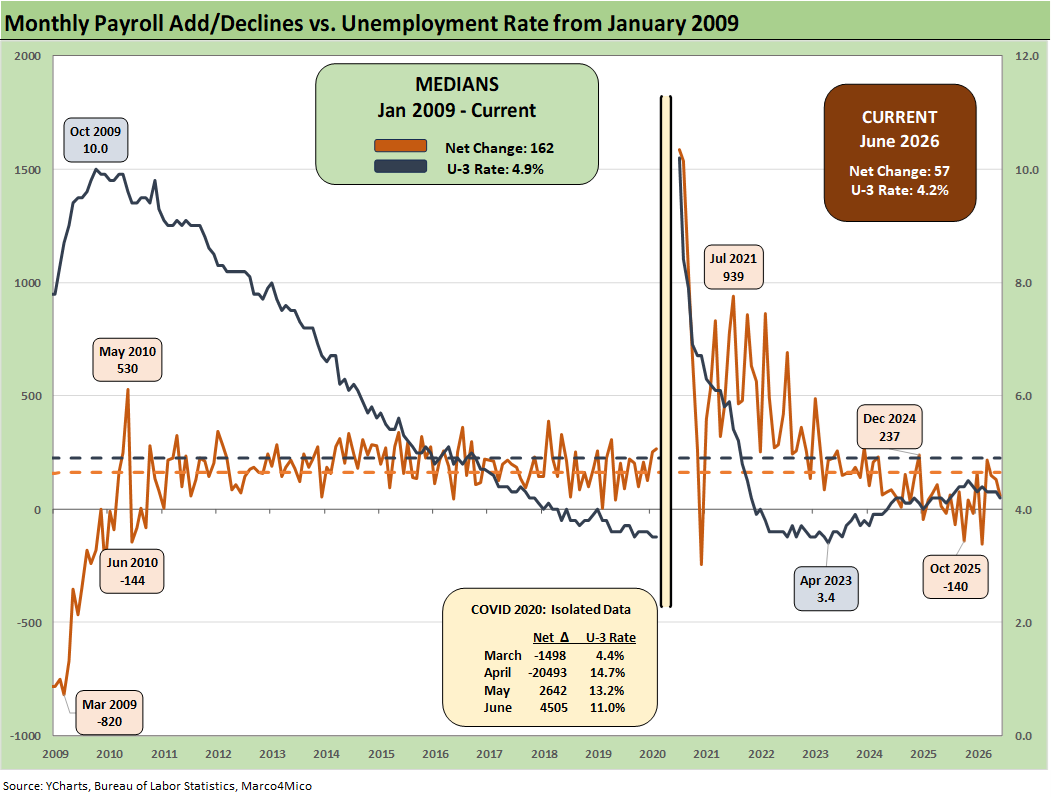
The above chart plots the running job adds/declines since Jan 2009 against the unemployment rate, which at 4.2% would be considered full employment in past cycles. In the chart, we isolate the worst months of the COVID dislocations in the box for better visuals to capture the other periods.
The 4.2% U-3 is below the long-term median from Jan 2009 of 4.9%. Payroll has been struggling somewhat in relative terms, but history is very kind to 4.2%. If the 2025-2026 frame of reference for payroll additions is 2024 (not a good jobs year) then the 2025-2026 numbers are solid (not great). If we compare 2025-2026 monthly adds to the 2022-2023 period, the current job add run rates are weak.
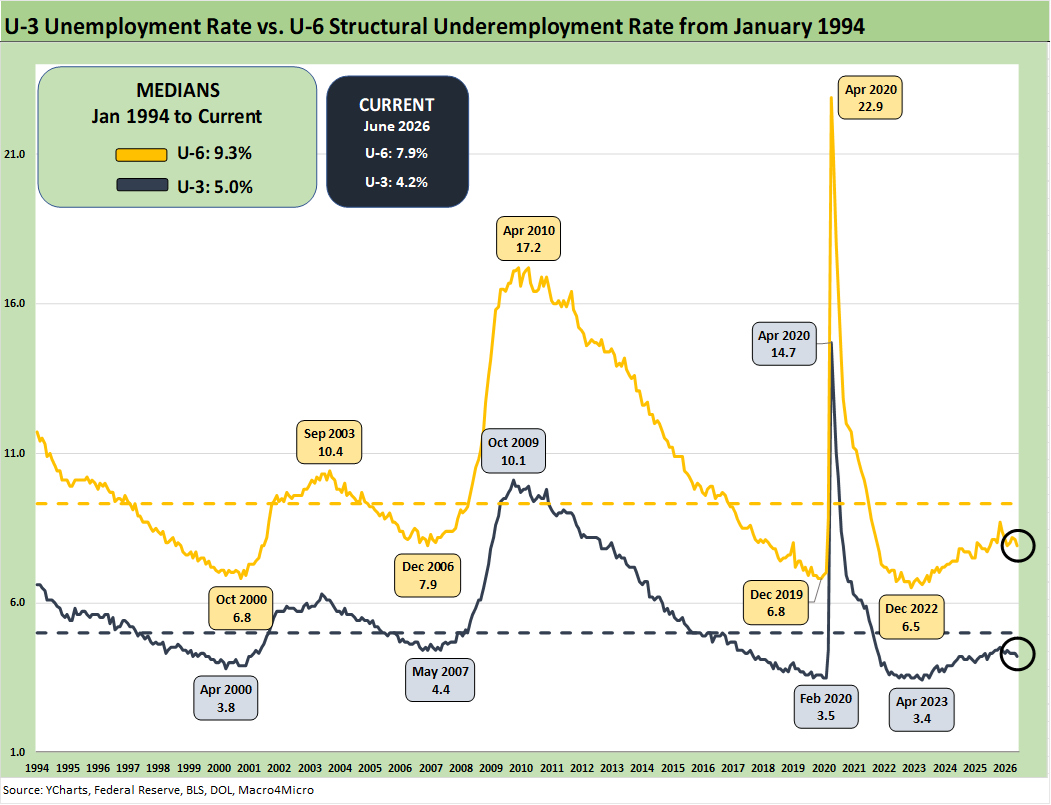
The above chart updates the time series for the U-3 unemployment rate and U-6 structural underemployment rate across the years from 1994.
As a reminder, the U-6 metric is defined with the numerator as “total unemployed + persons marginally attached to the labor force + total employed part time for economic reasons.” The denominator is “civilian labor force + workers marginally attached to the labor force.”
The U-6 is the structural underemployment metric that is always useful to watch. To start 2025, the U-6 rose sharply in Feb 2025 to 8.0% from 7.5% in Jan 2025. The U-6 jumped to 8.7% in Nov 2025 from 8.1% in Sept 2025.
The current 7.9% marks a decline from 8.1% in May and 8.2% in April. That is good news. The U-6 is well above the 6% handles seen in spring of 2023. The U-6 is still below the median from 1994 of +9.3%, which notably includes the post-crisis shock and the longest recession since the Great Depression.
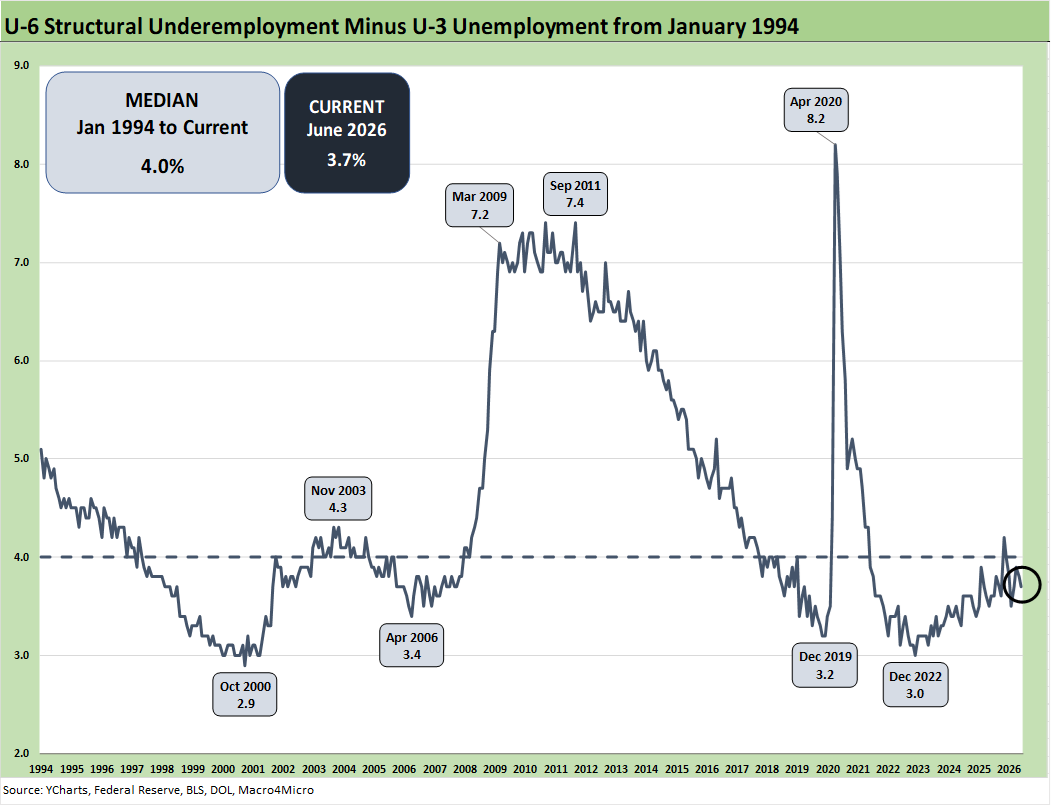
The time series above updates the U-6 minus U-3 differential as a measure of relative employment quality and to flag risks of major dislocations in large swaths of the economy (think oil patch collapse in the late 1980s, tech bubble imploding into a weak 2001-2003, and financial services and automotive meltdown in 2009).
The current 3.7% differential is below the long-term median of 4.0%. The job ranks are still vulnerable now with the Iran war effects easing but still flowing into hiring decisions and anxiety around where energy costs and raw materials go from here as working capital cost inputs get absorbed. The feedstock costs have been ugly until the recent adjustments in more than just oil. Iran is looking good to get settled, but “it ain’t over ‘til it’s over.”
Industry fundamentals (notably on the demand side) and FOMC policy planning remain a complicated handicapping exercise. The recent rising rate of job adds was clearly favorable but do feature some of the occupations in services where major swings come easily and multiplier effects are limited. The AI wildcard will remain a critical X-factor for where payrolls head in Services especially.
Just because there is record capex and fixed investment does not mean it will necessarily translate into higher payrolls. That is a flawed assumption and varies by industry. Even in tech, software and SaaS-based services companies have taken a beating for a reason even if the sell-off is excessive and exaggerated.
There is also the issue of tariff burdens and what “tariff mitigation measures” get taken in headcounts from tech to natural resources and how that flows into industrials and manufacturing. The trade-off of capital and labor is still alive and well with negative real wage growth not helping.
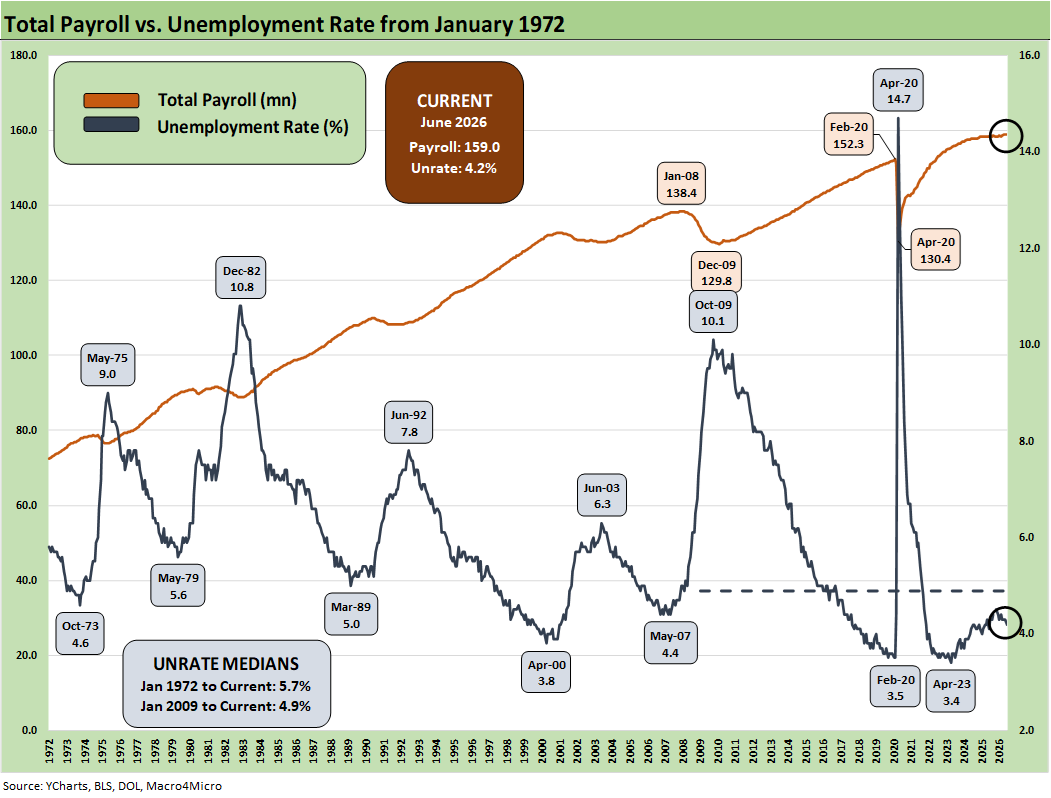
The above chart updates total payroll vs. the unemployment rate. The trend needle has not moved much in 2026 and has been in a narrow range. More bodies with more paychecks are always a good thing. Meanwhile, the Household data pushes back on the Establishment Survey in terms of the direction of total employed heads.
The trick from here is how the consumer deploys their paychecks and whether the zero-sum realities of household budgets undercut spending. The PCE line in the GDP accounts is a critical driver of growth and negative real wage growth. In reality, this is a soft leading indicator for spending or wage demand pressure.
That PCE growth represents 68% of GDP and has been a worrisome trend in 2026 (see GDP 1Q26 Final: PCE Growth Plunge 6-25-26). You never hear the talking heads in the White House (notably Hassett) discuss the weak PCE growth that is well below what we saw in 2024 when it was near 4.0% for the last few quarters (back when the country was “dead” per Trump). Numbers are objective, but the adjective-heavy crowd avoids them.
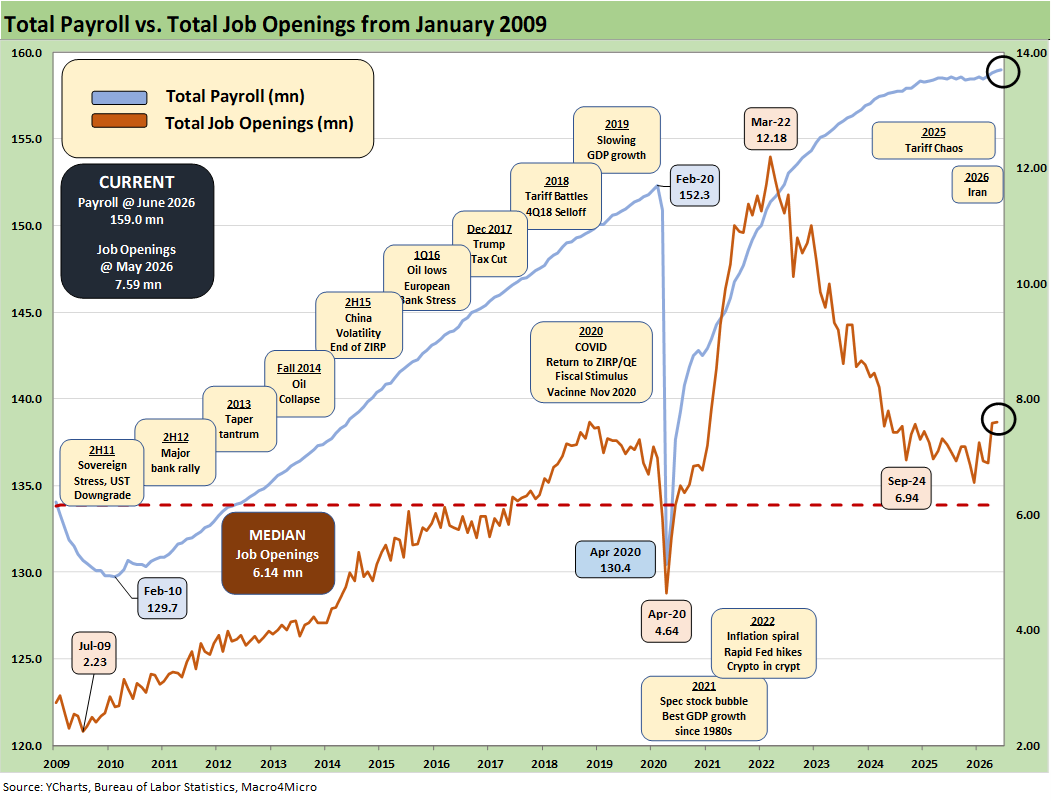
The above chart updates the total payroll numbers vs. job openings. JOLTS data had been recovering with job openings solid (see JOLTS May 2026: Openings Flat, Hires Down, Layoffs Up 7-1-26). Management teams have a lot of moving parts to factor into planning whether quantitative or qualitative before they fill the openings.
The final IEEPA decision from SCOTUS came in against Trump, but he was prepared to start slapping on tariffs under Section 122, 232, and 301. That continues given Trump’s priority of maximizing tariff revenue no matter how contrived and specious the grounds. My personal favorite remains the Section 232 national security tariffs for upholstered furniture. The needs for a good cushion are critical to US defense (!?).
The next leg of the tariff process is well underway on Section 301 tariffs with more tariffs being set on the basis of inadequate measures by trade partners to protect against “forced labor.” Trump’s deep concerns for the oppressed workers of the world is a new focal point. Those tariff actions will create more trade partner strife with the EU and Asia. The “labor” grounds were used to be in compliance with legislation that allows the White House to set the tariffs.
The USMCA is up for review as of this week, and that is already starting out ugly with Trump recently bringing out his “51st state” trash talking even as MAGA stokes the fires for Alberta secession. Trump has already stated it will be renegotiated or terminated. His view on the US “needing nothing from Canada” is belied by facts, the private sector purchasing histories, and in some cases the resource demand requirements. Not to get biblical, but fertilizer without potash is tricky (like “bricks without straw”?).
Meanwhile, the EU diplomatic setbacks and trade relations have been downright ugly and got worse after Iran. NATO appears to be in the crosshairs. Trump has threatened 100% tariffs in recent days to retaliate against any taxes on digital services. Trump lost his one remaining friend in Italy’s Meloni recently. The “other dictator wannabe” (Orban) was given his walking papers.
The trade flows have been looked at in many past commentaries (see Trade Deficits: The Moving Parts and Macro Goals Matter Most 6-24-26, Meanwhile…Back in Economics and Tariffs 3-2-26, US Trade with the World: Import-Export Mix 2-25-26). The US has a goods trade surplus with Canada ex-oil. Canada is also the leading export market for almost 3 dozen US states. Those states, including every central and norther swing state, might have something to say about that…perhaps in midterm elections.
The big worry back in March was fear of stagflation – something not seen since the 1980-1982 double dip under Volcker. That has subsided in recent weeks despite the ugly inflation numbers. It would take a massive setback in US-Iran escalation risks to change that.
The headlines around multiple supplier chains have been covered in other research, but fertilizer was one that aims directly at food while oil aims at just about everything from the gas pump to delivery costs, raw materials, and leisure and travel (airfare).
The Strait of Hormuz disruption headlines highlighted the threat to semiconductor production while some customers could see IT budgets slammed. The tech valuations will remain subject to second-guessing, but it would take a lot to go wrong to derail impressive tech investment trends. Taiwan is arguably more important than Iran on that front. For Taiwan, the priority is don’t piss off China and their one China policy (see Taiwan: Stakes are High, US Awareness is Low 5-17-26, US-Taiwan Trade: Risks Behind the Curtain 2-1-26, Taiwan: Tariffs and “What is an ally?” 7-20-25).
With so many bad headlines in private credit, the idea of financial stress and the need to be cautious on spending/capex will be an issue to be played out. That means the consumer sector is likely to be facing more risk ahead even with these balanced payroll numbers. Inflation and the lowest savings rate since the inflation peak of 2022 is a metric that needs to be watched over the summer and into the fall.
The overall economic impact of tariffs has been far less than feared given the reality that most trade partners backed down in 2025. That still could change in 2026 with the latest wave of Section 301 attacks on supplier chains and trading partners. There is always the chance that Trump might push Canada and Mexico too far and the same for the EU.
See also:
JOLTS May 2026: Openings Flat, Hires Down, Layoffs Up 7-1-26
Music to Ponder: Hope Rising or Blood Simmering? 6-30-26
The Election Gambit: Economic Risk and Policy Uncertainty 6-29-26
Market Commentary: Asset Returns 6-28-26
JD Vance and Nixon History: Clueless 6-27-26
Personal Income & Outlays May 2026: Bad Inflation, Balanced Spending 6-26-26
New Home Sales May 2026: Weak Volumes, Stable(ish) Prices 6-25-26
GDP 1Q26 Final: PCE Growth Plunge 6-25-26
Trade Deficits: The Moving Parts and Macro Goals Matter Most 6-24-26
Market Commentary: Asset Returns 6-21-26
The FOMC Dance: Will Warsh and Trump Find a Rhythm? 6-17-26
Housing Starts May 2026: Weaker for both Single Family and Multifamily 6-16-26
Industrial Production May 2026: Steady, Balanced Utilization Levels 6-15-26
Geopolitical risk: Trump’s Nuclear Saber Rattling? 6-14-26
Producer Price Index May 2026: Too Many “Since 2022” References 6-11-26
CPI May 2026: The 4% Rubicon 6-10-26
Remembering D-Day: June 6, 1944
Employment May 2026: Big Rebound, Low Multiplier Bias 6-5-26
The Fall of CBS 6-3-26
Retail Signal Read Part Deux 6-1-26