

Inflation 1st. Employers 2nd. Who’s in 3rd? Wage earners.
The latest employment cost index (ECI) shows 3.4% in compensation cost growth YoY, which is lower than headline PCE and headline CPI. Wage cost growth only stands at +3.2%, and that is essentially negative real wages per the ECI numbers (June 2026 PCE: Inflation, Income, and Outlays 7-30-26, see CPI June 2026: Eye of the Storm? 7-14-26).
Within the broader bucket of the ECI, we see the private sector category posting wages/salaries growth are at +3.1% (before other benefits such as health care). The takeaway is simple: wage earners are screwed. Enjoy the Golden Age.
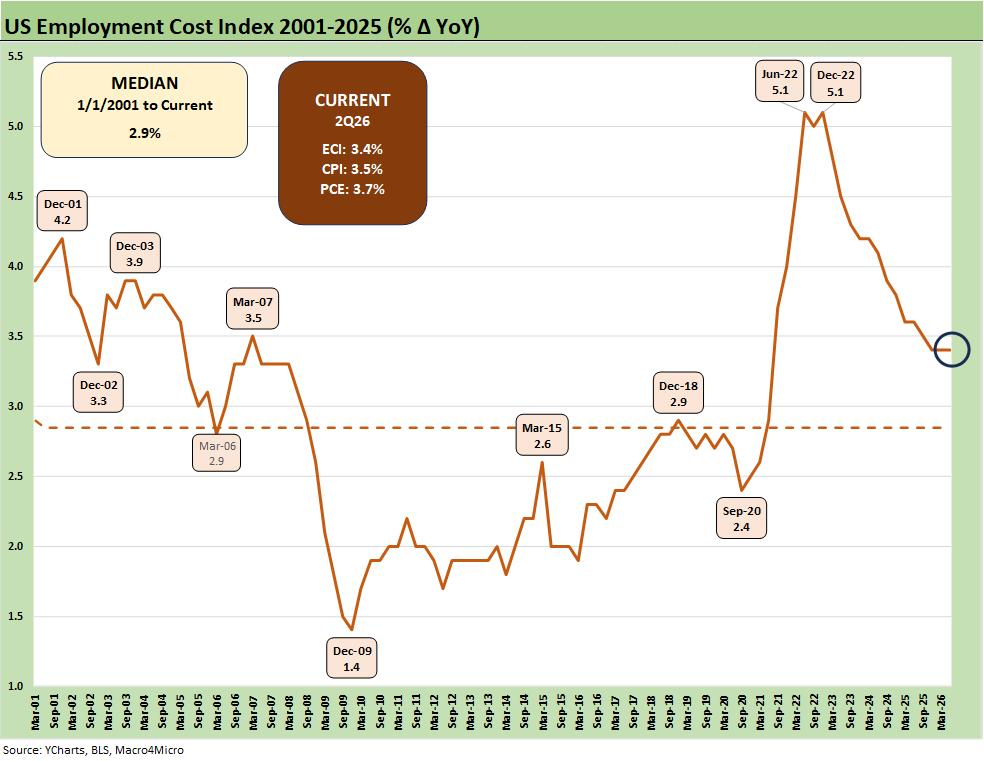
The above chart plots the quarterly Employment Cost Index (ECI) across the period from 2001 to June 2026. We also detail in the box the most recent headline PCE inflation and headline CPI. We are making the connection to the wage and benefit costs, so the “core” inflation metrics (ex- food and energy) are not the main event here. The frame of reference is headline inflation.
The story is obvious enough. Current inflation is trumping compensation cost growth for employers (and the earnings of workers) of +3.4%. The total employment cost index of 3.4% at 2Q26 is flat to 3.4% in 1Q26 but down YoY from 3.6% in 2Q25.
The wages and salaries component declined to 3.2% in 2Q26 from 3.4% in 1Q26 and 3.6% YoY in June 2025. For private sector wages and salaries only, wages and salaries are at +3.1%, which is down from 3.4% in 1Q26 and from 3.5% YoY vs. the June 2025 period. The State and Local Government numbers push the total ECI number higher given +3.6% compensation and +3.4% wage and salary growth in that public sector grouping.
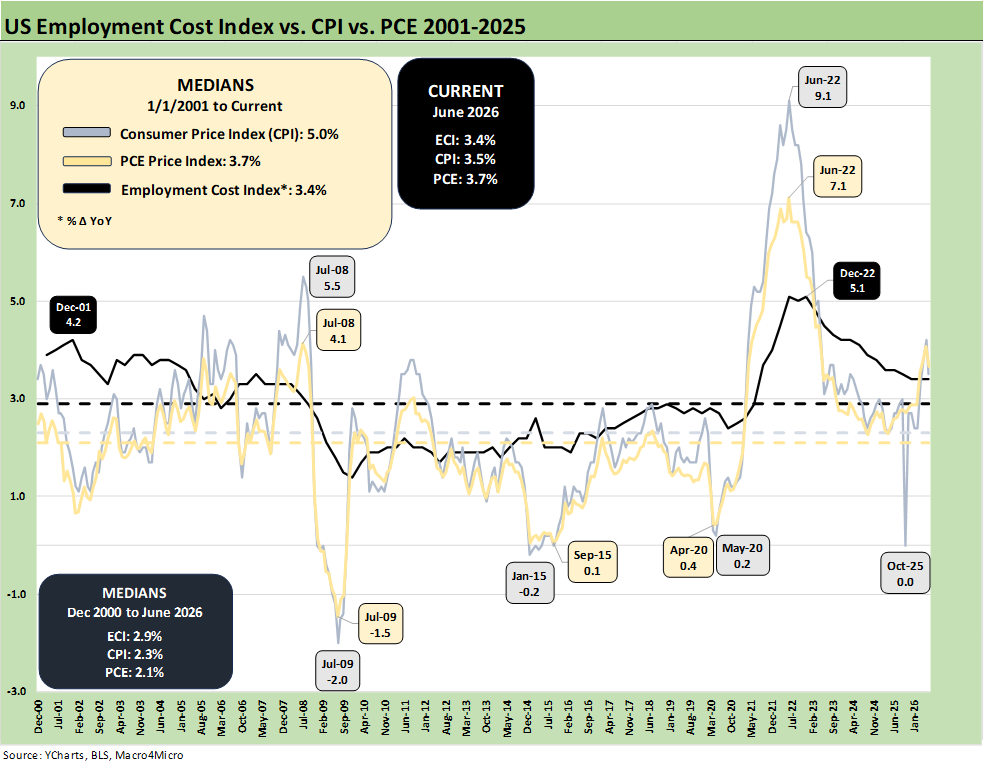
The above chart frames the ECI vs. the inflation rate, and we should also consider the many line items that are growing much faster in what for many households are priority line items (health care, food, electric, gasoline, insurance, utility bills, rising monthly payments on new borrowing of any type, etc.). Health care premium increases are soaring and have little in common with the “deflation” reported for CPI health insurance by the BLS.
It is easy enough just to consider the cost of gasoline at the pump (and home heating oil as the colder season approaches) in the “affordability” topic but there is a long list of items to trace. This is the “cash in, cash out” challenge that has seen savings rates plunge and household balances sheet weaken.
“Affordability” is not a “made up” topic as Trump claims. It is just math. “How much do I make?” vs. “How much do I need?” is not rocket science (Hassett can keep working on it). As the chart shows, it was worse in 2022, but it remains bad. The political claims do not change the basic fact. Inflation has gone higher from Dec 2024 and is now above wage growth. It is still a problem.
The gap between wages/compensation and inflation is not to be ignored. The best period for the wage earner in this comparison was the period after the financial crisis, but there were plenty of other problems to offset any real wage advantage (notably employment risks and home price collapses).
This in theory is the point where markets consider how wages will need to trend, and political interests can restart debates on the minimum wage level (which always lose in Washington). “Wage-price spiral” is a worrisome term that has not been in the picture yet as the data above demonstrates in wage trends. The question will be how that might change or what the political toll will be if it doesn’t get better.
See also:
June 2026 PCE: Inflation, Income, and Outlays 7-30-26
Producer Price Index June: Still Hurts…Just Less 7-15-26
CPI June 2026: Eye of the Storm? 7-14-26