


Stronger than appearances
The 1.5% headline GDP moved down from 2.1% in 1Q26 and rose from +0.5% in 4Q25, but 2Q26 includes a healthy bounce in PCE growth from +0.5% in 1Q26 to +3.2% in 2Q26.
Fixed investment growth is still dazzling, running at a robust +7.0% (up from +6.5% in 1Q26 and +1.5% in 4Q25).
We always look to the consumer (PCE) and investment lines for the “real” story. The usual distortion lines in GDP contribution such as net exports (-1.01% in 2Q26 vs. -0.37% in 1Q26) and changes in private inventory (-0.67% in 2Q26 vs. +0.23% in 1Q26) shave a total of almost +1.7% off the headline GDP.
The Government consumption and investment line also shaved off -0.8% in 2Q26 with underlying moves at the Federal level of -4.1% (+2.4% National Defense, -12.9% Nondefense) combined with the much larger (78% bigger) State and Local line at +1.1%.
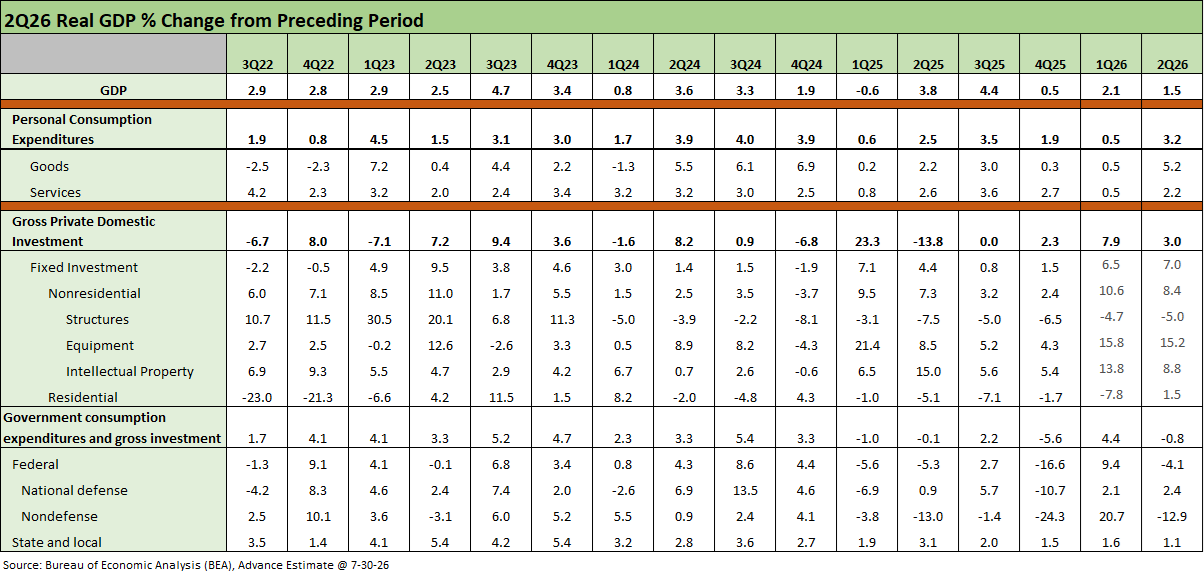
The GDP growth below the headline level tells the story with the PCE line being the most important swing in the advance 2Q26 numbers. PCE is a line that is typically 68% of GDP, so that always tops the list. PCE at +3.2% includes an impressive pop of +5.2% in Goods with Durable Goods at +6.8% and Nondurables at +4.4%. Meanwhile, Services was only +2.2% but shows a favorable variance vs. the +0.5% of 1Q26.
The fixed investment line stayed hot at +7.0%, which is impressively above historical levels and up from +6.5% in 1Q26 and +1.5% in 4Q25. Within fixed investment, the Equipment line posted +15.2%, down slightly from +15.8% in 1Q26. Intellectual Property Products growth stayed strong at +8.8% even if down from +13.8% in 1Q26. We even saw Residential Investment get out of the red zone with sustained weakness in housing at least stabilizing.
The usual “distortion lines” were at work again as we have discussed in past GDP commentaries. The “softer” GDP lines include net exports and inventory changes. These can generate minimal to major swings each quarter. The timing of inventory pre-buying and trade flows materially distorted some of the 2025 quarterly moves in dramatic fashion (see links at bottom). For 2Q26, the distortion was just under 1.7 points (-1.0 for trade, -0.67 for inventory). That effect was much smaller than some 2025 impacts but still material.
The classic growth drivers of the Personal Consumption Expenditure growth and Fixed Investment performed well, and it is always a useful drill to check out how much contributions from trade deficits and inventory swings move the needle at the headline level.
See also:
GDP 1Q26 Final: PCE Growth Plunge 6-25-26
GDP 1Q26 Second Estimate: Shrunk in the Dryer 5-28-26
1Q26 GDP Advance Estimate: Consumer Fade, Investment Boom 4-30-26
4Q25 GDP: More Adverse Revisions in the Golden Year 4-9-26
Some “distortion” stories of past GDP reports:
3Q25 GDP: Morning After Variables to Ponder 12-27-25
2Q25 GDP: Second Estimate, Updated Distortion Lines 8-28-25
2Q25 GDP: First Cut of Another Distorted Quarter 7-30-25
1Q25 GDP Advance Estimate: Roll Your Own Distortions 4-30-25