


It gets easier. In theory.
The June Headline PPI number at 5.5% (down from 6.5% in May) for total final demand is still running well ahead of history, but the energy chaos could creep back into the picture in the summer home stretch.
We break out some of the important line items from a release that certainly contains no shortage of granular line items over too many pages. Notable PPI lines below headline levels include +7.9% for “final demand goods” and 4.6% for “final demand services.” Total intermediate demand for processed goods posted 11.1% with final demand energy down sequentially at -6.4% for May to June still leaving the YoY Energy PPI at +23%.
There is no hiding from the hydrocarbon chain from gasoline and power to raw materials and basic freight and logistics costs and from goods to services. At some point, the negligible real wages and pressure on costs could flow into wage expectations and adjustments on the payroll side of the ledger (i.e. layoffs).
Meanwhile, the “Vegas line” over at FedWatch has essentially wiped out the odds of a cut in 2026. The chance of the FOMC acting on 1 cut by the Dec 2026 FOMC meeting (as we go to print) is 0% while the odds of 3 hikes stand at 3.9%. The leaderboard shows 1 hike posting the highest odds at 44.5% followed by “no change” at 29.8% and 2 hikes at 21.6%.
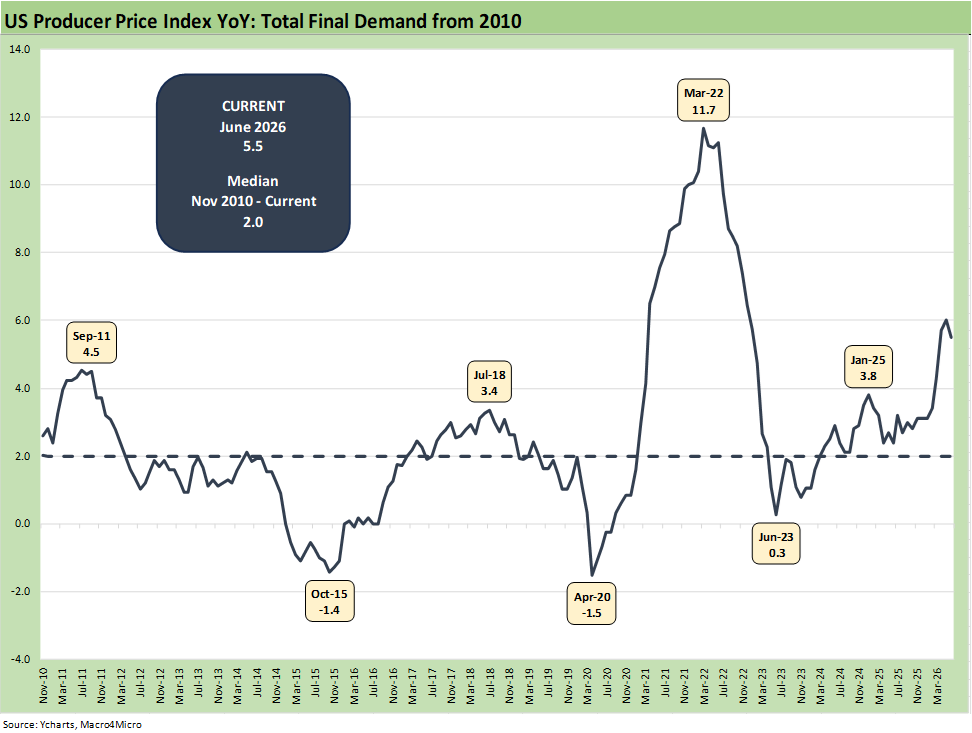
The above time series updates the running PPI line for “Total Final Demand.” The current total of 5.5% is down from 6.5% in May when it was triple the median since 2010. There is no hiding from the reality of Iran as energy costs have so many effects on prices and costs directly or indirectly via secondary and tertiary effects. That will include raw materials across the supplier chains and the pricing pressure at the end of those chains. That includes freight and logistics costs to inventory costs.
To what extent tariffs might flow into goods pricing and services will be influenced by trade partner reactions that must still play out at a lag. Trade partners will need to respond to the latest barrage of tariffs and likely attacks by Trump on US and Mexico. Trump’s threat to cancel the USMCA is among myriad possible decision points that tie more into geopolitical than rational economic decision making. There is a scenario where Trump is at war with Iran and also ends in trade battles with Canada, Mexico and even the EU.
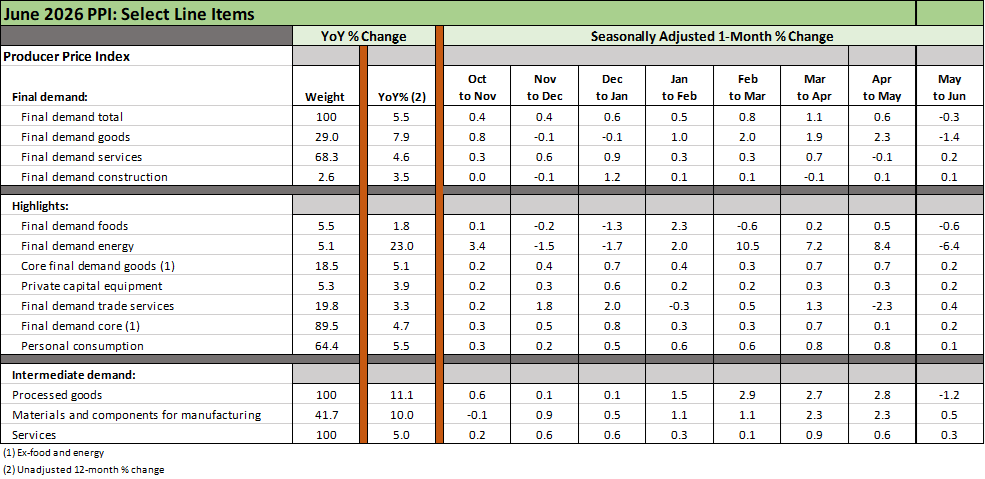
The above table breaks out some of the important PPI metrics that we monitor plus a few smaller line items we like to watch (Construction, Private Capital Equipment). The PPI release provides an extensive and lengthy range of metrics across over 20 pages in the release tables.
Even with improvement, PPI is not pretty…
The YoY column (2nd column) tells a story of deteriorating inflation trends in 2026. June included some relief when the Trump-Iran deal looked like it had a chance of working (even if badly). The June numbers are progress, but the trend since Iran got underway at the end of Feb 2026 underscores the distinctly negative direction of underlying cost pressures along the chain from PPI to PCE/CPI.
We now have a backdrop where the flow-through of the cost pressures will still lead to higher prices and/or costs at various lag times. In addition, we are now on the cusp of a USMCA tariff meltdown as well. Whether Canada or Mexico will push back is highly uncertain given the tendency of both former NAFTA partners to retreat. High PPI plus more tariffs means either higher prices or narrowing margins.
Market reactions muted…
Protecting margins from PPI pressures or tariffs can bring cost reduction strategies (layoffs, store/plant closings, capex cuts, etc.). That is where the stories need to be researched at the industry and company level based on the cumulative impacts of the energy and materials fallout from fresh rounds of tariffs ahead.
The equity and bond market reaction have been relatively muted in asset returns around these inflation threats as we cover in other commentaries (see Market Commentary: Asset Returns 7-12-26). Duration has been hit, but equities have looked past the Middle East turmoil. Credit spreads in the corporate and HY bond markets have been resilient. The UST even rallied on “PPI day” after last week’s adverse UST moves.
The curve deltas are all higher since Iran and remain higher across the curve YTD as we detail in the asset return recaps. Iran and Trump escalating will not help UST prospects. The 30Y UST hit 5.1% before coming down a bit on the day. That is not a vote of confidence even if the signals are saying “nonevent” in the June inflation numbers. 30Y mortgages had climbed to 6.75% in the Mortgage News Daily survey to start the week but are now back at 6.64%.
See also:
CPI June 2026: Eye of the Storm? 7-14-26
Market Commentary: Asset Returns 7-12-26
Existing Home Sales June 2026: The Stall is On 7-11-26
Happy 250th Birthday America 7-3-26
Employment Situation June 2026: Back to a Crawl 7-2-26
JOLTS May 2026: Openings Flat, Hires Down, Layoffs Up 7-1-26
Music to Ponder: Hope Rising or Blood Simmering? 6-30-26
The Election Gambit: Economic Risk and Policy Uncertainty 6-29-26
JD Vance and Nixon History: Clueless 6-27-26
Personal Income & Outlays May 2026: Bad Inflation, Balanced Spending 6-26-26
New Home Sales May 2026: Weak Volumes, Stable(ish) Prices 6-25-26
GDP 1Q26 Final: PCE Growth Plunge 6-25-26
Trade Deficits: The Moving Parts and Macro Goals Matter Most 6-24-26
The FOMC Dance: Will Warsh and Trump Find a Rhythm? 6-17-26
Housing Starts May 2026: Weaker for both Single Family and Multifamily 6-16-26
Industrial Production May 2026: Steady, Balanced Utilization Levels 6-15-26
Geopolitical risk: Trump’s Nuclear Saber Rattling? 6-14-26
Remembering D-Day: June 6, 1944
The Fall of CBS 6-3-26