
JOLTS May 2026: Openings Flat, Hires Down, Layoffs Up
The May JOLTS Report and the June ADP do not offer Warsh much room to maneuver.


Ok, but when can I start?!
The JOLTS numbers come at a 1-month lag, and the small moves overall do not signal much to rattle the steady-as she-goes mediocre payroll trend that dovetails with a +98K set of ADP numbers released today. The overall trend in the 2026 numbers shows resilience even if unimpressive in post-COVID cyclical context. The numbers beat the weak 2025 performance. Tomorrow brings the full June payroll report.
The JOLTS lines for May show job openings barely budged at +9K MoM to 7.59 million, which is +3.9% vs. May 2025. Hires were down -45K to 5.17 million, which was down by -3.0% YoY. Layoffs were up by 41K in May MoM to 1.71 million which is +2.2% YoY. Quits were up by 22K with the Quits rate flat at 1.9%.
A good exercise in JOLTS is watching the occupation lines and notably for signs of openings and job expansion in the Manufacturing disciplines. Those numbers test the theory on tariffs being a policy that would bolster payroll and investment in durables and nondurables. So far, we see some signals in JOLTS with Manufacturing openings up by 6.6% in May vs. April 2026 but up even more by 32% YoY.
The real answer on jobs (vs. unfilled openings) comes in the monthly payroll counts that measure actual headcount net of all other moving parts. We get that tomorrow. The ADP numbers released today with +98K in private sector adds were only +2K for Goods while posting +96K for services.
From a FOMC policy standpoint, the jobs numbers this week are forecasted to be reasonable (FactSet cites a 100K median estimate ahead of the number) after a bad month for inflation metrics and constant back and forth on oil. On Iran, it is easy enough to find aggressive calls for sharply lower oil or in contrast renewed escalation against Iran by the US. The oil market as we go to print shows WTI just above $68. The CME FedWatch odds as of midday still see 0% chance of 1 cut by the Dec 2026 FOMC meeting set against 39.1% odds of 1 hike, 33.2% of 2 hikes, and 10.9% for 3 hikes. The odds of “no change” are now only 16.4%. That is not pretty.
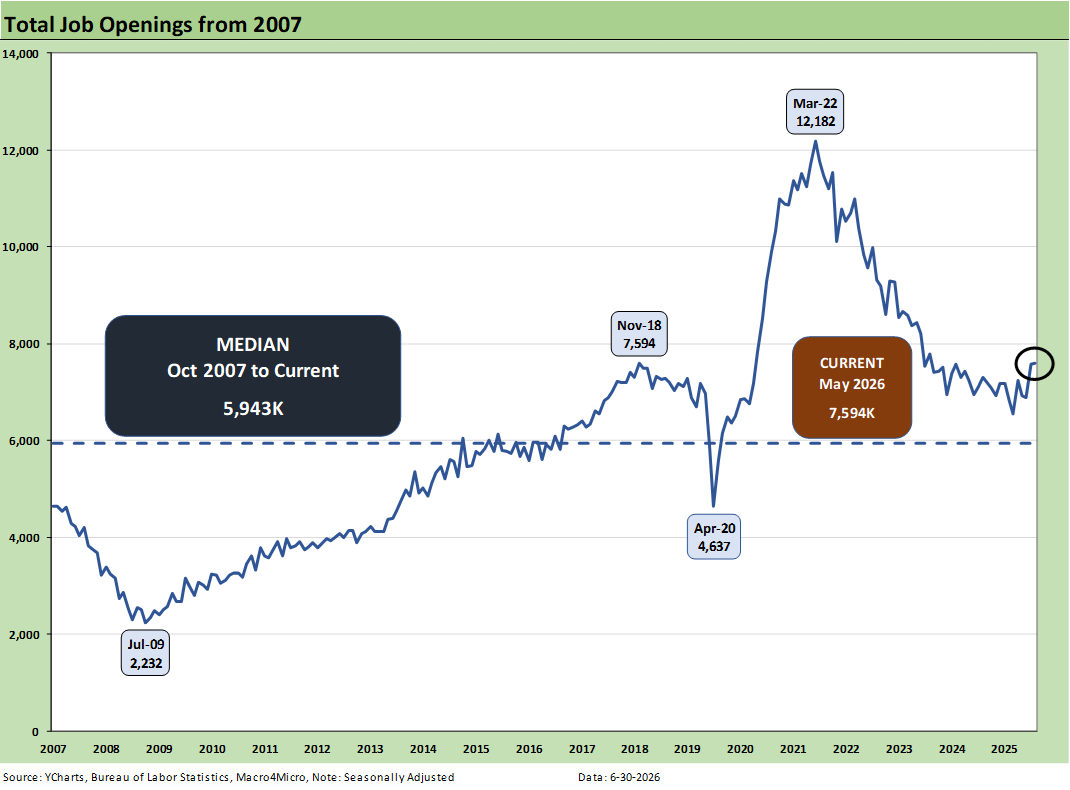
The above time series plots job openings across the timeline from 2007 to current. May 2026 was a mild month after a busier April. The high of 12.2 million off the lows of 4.6 million at the peak of the COVID panic are dramatic. Recent periods had been soft before the April 2026 bounce of +731K back to 7.6 million. Openings are running well above the long-term median (5.94 million).
The total increase in job openings in May of +9K was underwhelming and included a -115K decline in “Health care and social assistance.” In contrast, “Leisure and hospitality” posted a +95K increase. Each month we can see major moves in these lines, which have been dominant drivers of monthly payroll trends. It is a safe statement that these lines are not major macro multiplier effect lines (even if a job and paycheck are always a good thing for the economy).
The Manufacturing openings, which are important signals on the long-desired goal of rebuilding and reshoring, posted some constructive openings numbers of +33K for Manufacturing with +20K for Durables and +13K for Nondurables. Durables are +6.0% MoM and +29.7% YoY. Nondurables were +8.0% from April and +36.7% YoY. That manufacturing job openings trend was a good sign, but the net filling of jobs will require those numbers to flow into the payroll lines. Hires in May for Manufacturing were -1K. Durables were +5K and Nondurables were -6K.
Employers will need to “pull the trigger” and the fate of the Iran MOU and the USMCA could play into those decisions.
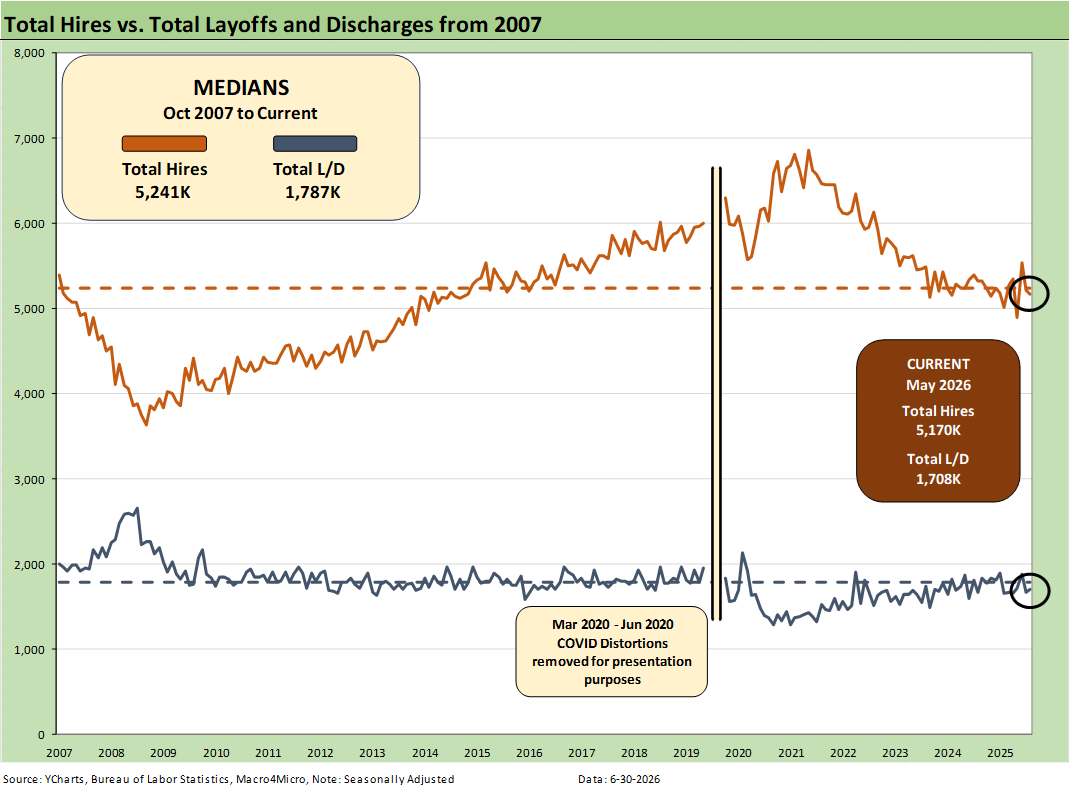
The above chart plots Hires vs. Layoff/Discharges on a SAAR basis. Note: we remove the COVID numbers from several charts to support the visual value for “normal” periods. We comment on COVID history at the end of the note.
Hires declined by -45K, which is much lower than the decline posted in April of -320K. Layoffs/discharges rose by +41K in May after April saw a MoM layoff decline of -217K from March. The hires YoY declined by -158K or by -3.0%. Layoffs YoY rose by 37K or by 2.2%.
While we are in an expanding economy, the annual GDP growth of 2.1% in 2025 had lagged 2024’s 2.8%. The 1Q26 GDP growth rate was boosted in the final numbers to 2.1% GDP growth, but PCE growth remains in the tank for both Goods and Services (see GDP 1Q26 Final: PCE Growth Plunge 6-25-26).
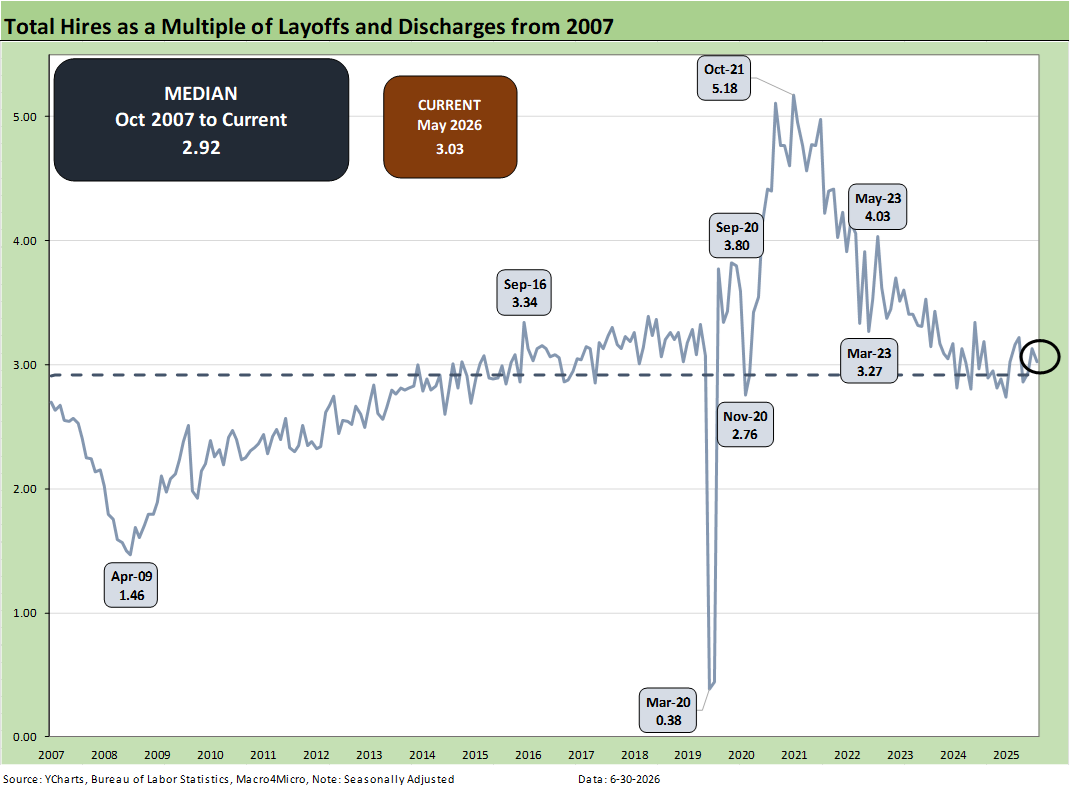
The above chart updates the ratio of Hires to Layoffs/Discharges. The relationship stands at 3.03x, above the long-term median of 2.92x from 2007. The post-2007 period includes the effects of the longest recession since the Great Depression (Dec 2007 – June 2009) followed by the longest expansion in history from June 2009 to COVID (Feb 2020), which brought a very brief 2-month recession wrapped around a wild swing in pandemic employment.
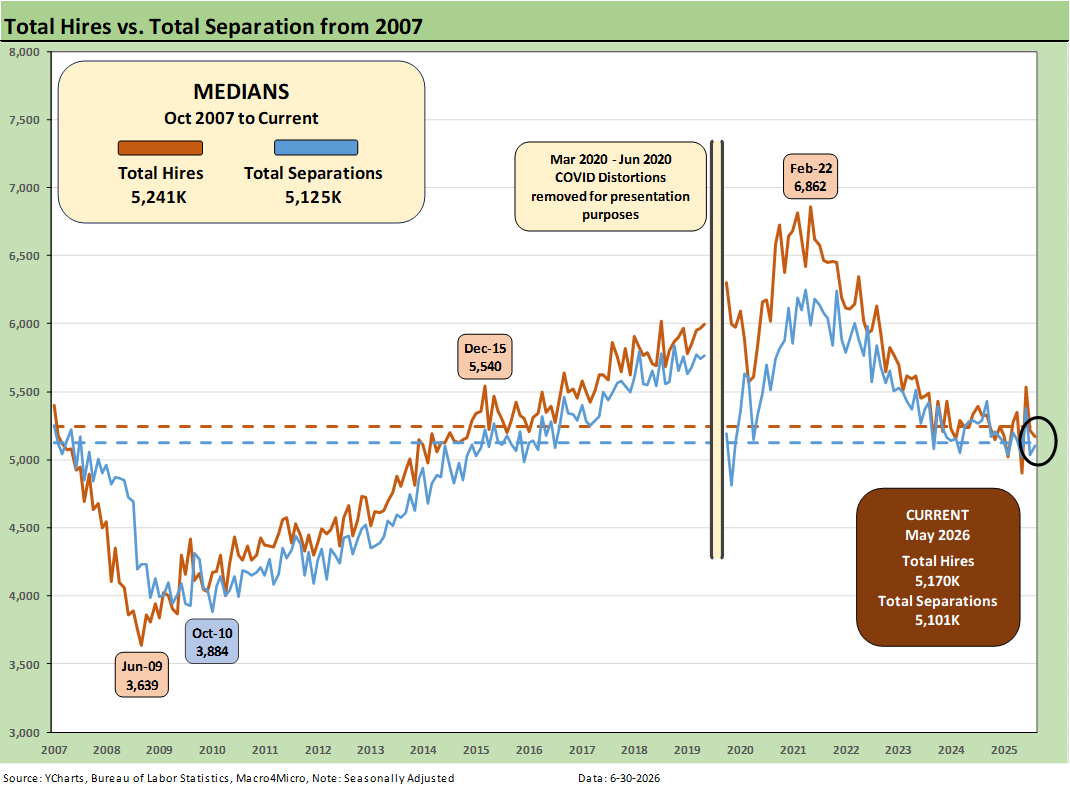
The above chart plots Hires vs. Total Separations on a SAAR basis. Separations include Quits, Layoffs/Discharges, and “Other Separations.” Total Separations rose by +63K vs. April 2026 and were lower by -187K YoY. We typically do not find “Total Separations” particularly interesting as a multi-line net number.
The small rise in Separations MoM includes a small increase in layoffs of +41K combined with a small increase in “Quits” of 22K. One theory is that quits signal relative confidence in finding a job on the other side of quitting. Quits are down by -222K YoY. The confidence factor is not looking good.
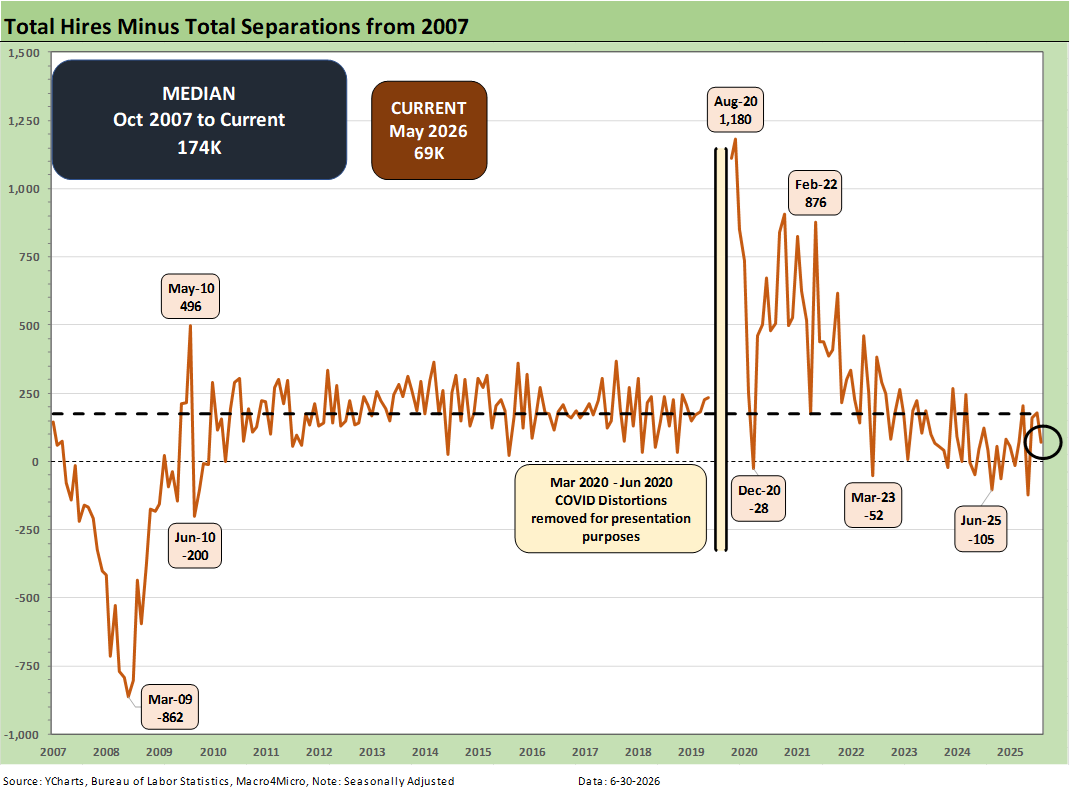
The Hires minus Total Separations differential is plotted above. The small decline in Hires in May of -45K came after a bigger decline in hires of -320K in April vs. March.
The net number above has moved notably lower in recent months and dipped into the negative range in Feb 2026 before bouncing back into positive range in March and April. The differential of 69K is below the long-term median of +174K.
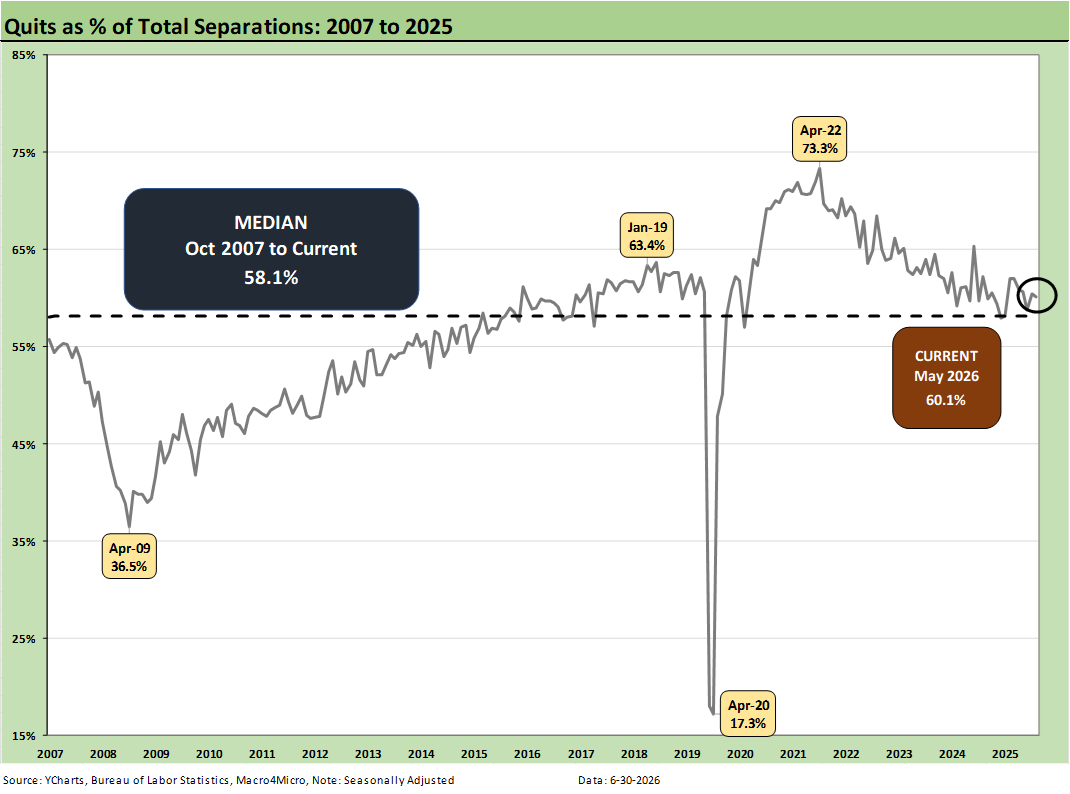
The time series for Total Quits as a % of Separations (SAAR basis) was 60.1%, slightly above the long-term median of 58.1%. The classic “Quits Rate” is measured by Total Quits as a % Total Employment, and that metric was unchanged on the month at +1.9%, flat to April 2026. The Quits rate is also down YoY from 2.1%.
The bottom line…
The JOLTS numbers for May cannot be used by UST bulls to make a case for easing, which is pretty much impossible now anyway unless you are Hassett and threw out your fact and concept book.
The long-suffering bull flattener advocates who were worried about oil are less worried for now, but the Iran deal is by no means printed. There are rumblings this week of fresh escalation, and that is hard to ignore just as it is hard to embrace. In addition, the effects of the massive oil and refined products inventory drawdown are not clear yet this summer with the China X factor on when it might start restocking more aggressively.
NOTE ON COVID DISTORTIONS
The Hires vs. Separations time series make for interesting numbers but tough charts to plot visually given how much the spike in Separations/Hiring during COVID distorted the numbers from March 2020 to June 2020. The swings literally were off the charts. For presentation purposes, we adjust the charts above to exclude the raw data for those months to get a better vantage point on somewhat more normal times. Compared to COVID, the credit crisis seems “normal” in terms of the job count moves.
For disclosure purposes, Separations across March 2020 (16.3 million), April 2020 (11.6 million), May (4.7 million), and June (5.2 million) were running against Hires in March (5.2 million), April (4.0 million), May (8.1 million), and June (7.4 million). We remove those from the charts to get better scale visuals on the periods that precede and follow as the market saw 50-year lows in unemployment in 2022. Wild swings were experienced by all as industries saw shutdowns and layoffs in the COVID recession. The long-term medians from 2007 to 2022 for Hires and Separations were very close.
Almost 28 million Separations combined in March-April 2020 as a brutal reminder of that period.
See also:
Music to Ponder: Hope Rising or Blood Simmering? 6-30-26
The Election Gambit: Economic Risk and Policy Uncertainty 6-29-26
Market Commentary: Asset Returns 6-28-26
JD Vance and Nixon History: Clueless 6-27-26
Personal Income & Outlays May 2026: Bad Inflation, Balanced Spending 6-26-26
New Home Sales May 2026: Weak Volumes, Stable(ish) Prices 6-25-26
GDP 1Q26 Final: PCE Growth Plunge 6-25-26
Trade Deficits: The Moving Parts and Macro Goals Matter Most 6-24-26
Market Commentary: Asset Returns 6-21-26
The FOMC Dance: Will Warsh and Trump Find a Rhythm? 6-17-26
Housing Starts May 2026: Weaker for both Single Family and Multifamily 6-16-26
Industrial Production May 2026: Steady, Balanced Utilization Levels 6-15-26
Geopolitical risk: Trump’s Nuclear Saber Rattling? 6-14-26
Producer Price Index May 2026: Too Many “Since 2022” References 6-11-26
CPI May 2026: The 4% Rubicon 6-10-26
Remembering D-Day: June 6, 1944
Employment May 2026: Big Rebound, Low Multiplier Bias 6-5-26
The Fall of CBS 6-3-26
JOLTS April 2026: A Modestly Positive Turn 6-2-26
Retail Signal Read Part Deux 6-1-26