


What happens in the Fed Chair’s thoughts … stays in the Fed Chair’s thoughts.
A big week lies ahead with the FOMC and Warsh getting another test in “communication” (or absence of). The market gets the first estimate of 2Q26 GDP, a fresh read on PCE inflation (with income and outlays), and the countdown begins on trade partner responses to the deluge of new tariffs under dubious (but legal) standards.
The UST curve had another bad week and is moving closer to the Oct 2023 highs than to the end of 2024. Mortgages are creeping closer to 7% with over 6.8% to end the week in the broader Mortgage News Daily survey.
The Vegas odds (FedWatch) on FOMC actions as we go to print shows a 62.1% chance of unchanged fed funds for this week’s meeting and odds of 37.9% for 1 hike this week. Looking further ahead to the Dec 2026 FOMC meeting, the odds of no change are down to 6.9% with 1 hike at 32.3%, 2 hikes at 39.7%, and 3 hikes at 18.3%.
The oil wildcard is a major challenge to manage in the best of times. Past stagflation experiences (4Q73-1Q75 recession, 1980-1982 double dip) are hard to ignore even if many conditions today are starkly different. Oil matters from household cash flow to power costs to raw materials and always with an eye on how to recover higher costs (pricing power, etc.). The choice away from price increases would be lower profits or use cost offsets (payroll? capex?) at a time when tariff costs are also rising.
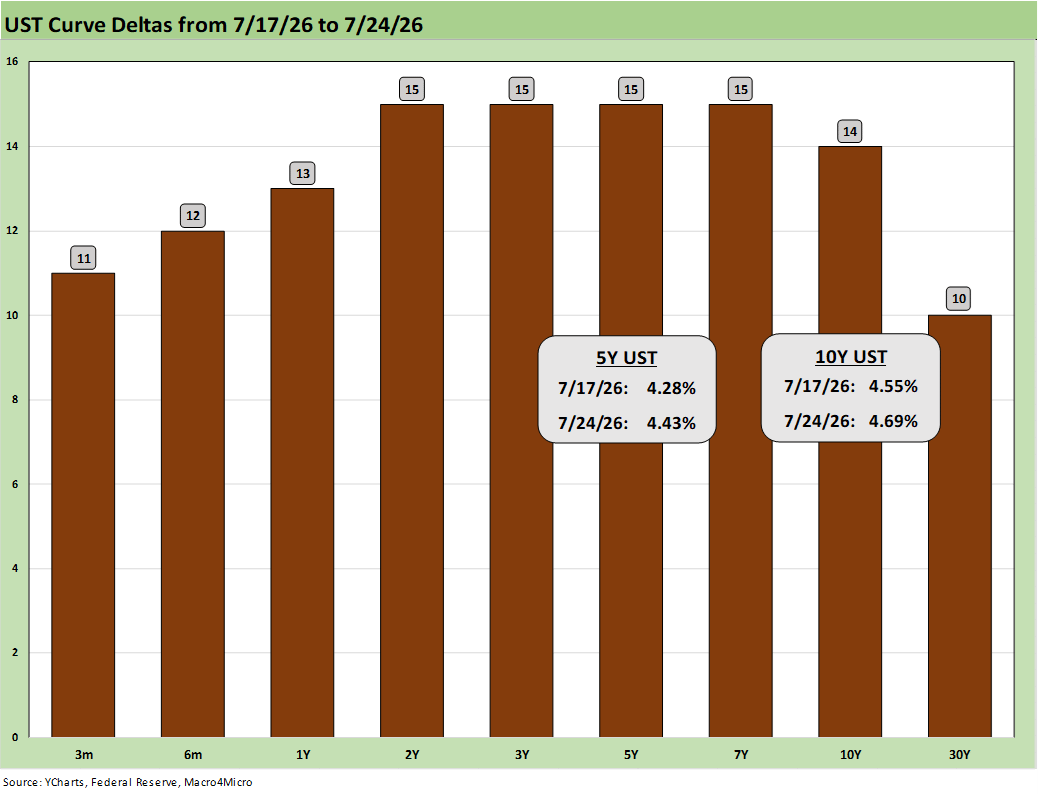
The above chart details the weekly UST deltas. All 7 bond ETFs we track on our weekly asset return commentaries turned up negative on the week given this adverse shift.
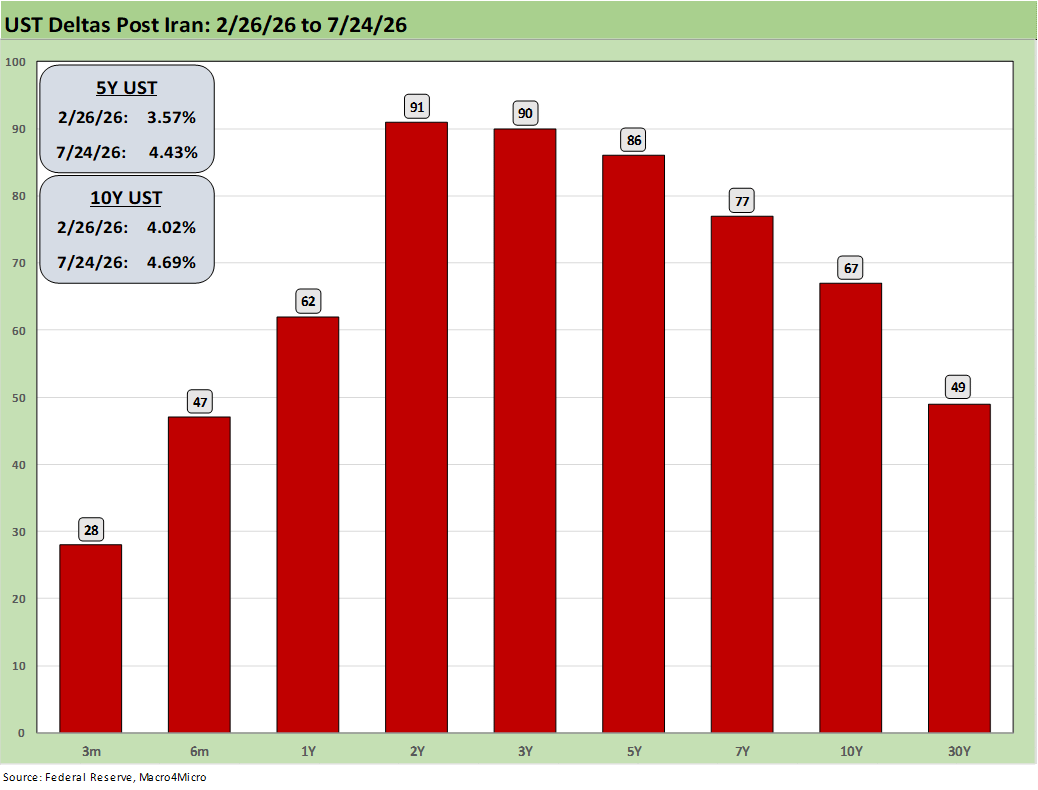
The post-Iran UST deltas are updated above (the bombing started on 2-28-26), and there is little mystery around what unfolded with an ugly bear flattener from 2Y to 30Y. That bearish shapeshifting hits consumer financing costs while punishing long duration assets. Mortgages have moved further away from the 6% line and closer to 7% with the 10Y UST being the driver of 30Y mortgages.
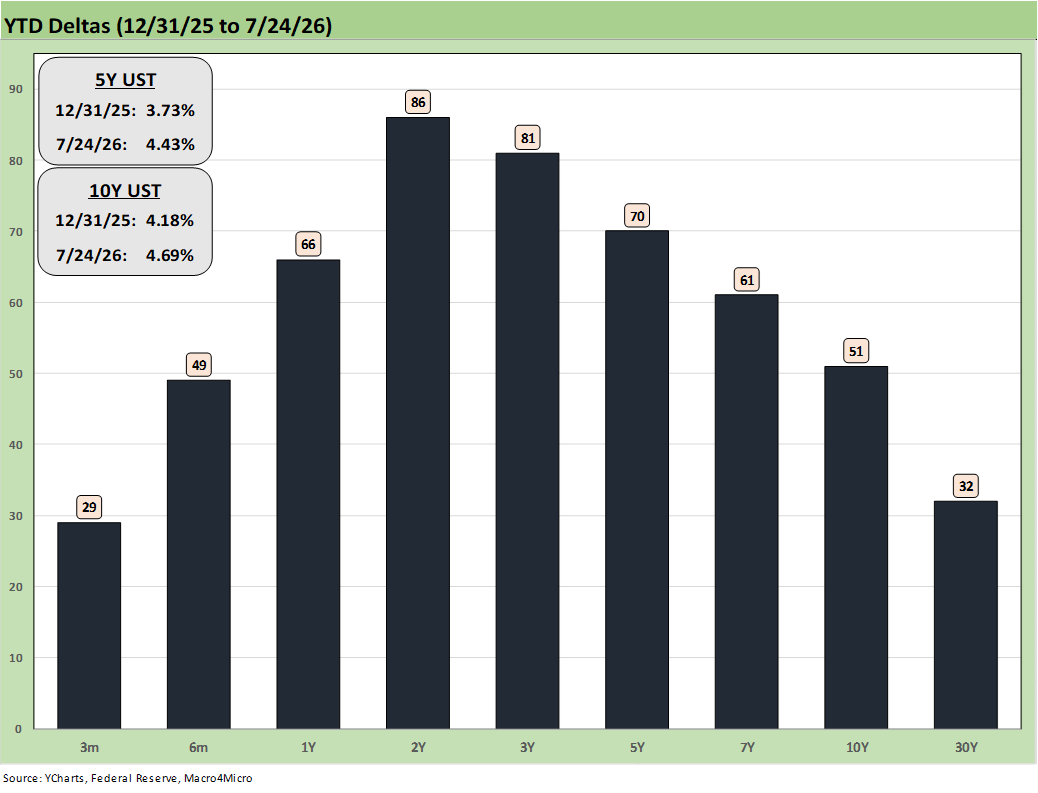
The above chart updates the YTD UST deltas with the worst of the damage coming after Iran and as inflation moved higher and saw 4% headline CPI and PCE handles breached in May. That came ahead of what is now looking like temporary relief in June (see CPI June 2026: Eye of the Storm? 7-14-26, Producer Price Index June: Still Hurts…Just Less 7-15-26). The oil pressures of July will show up in the next inflation releases in August. This week gets the PCE inflation release for June
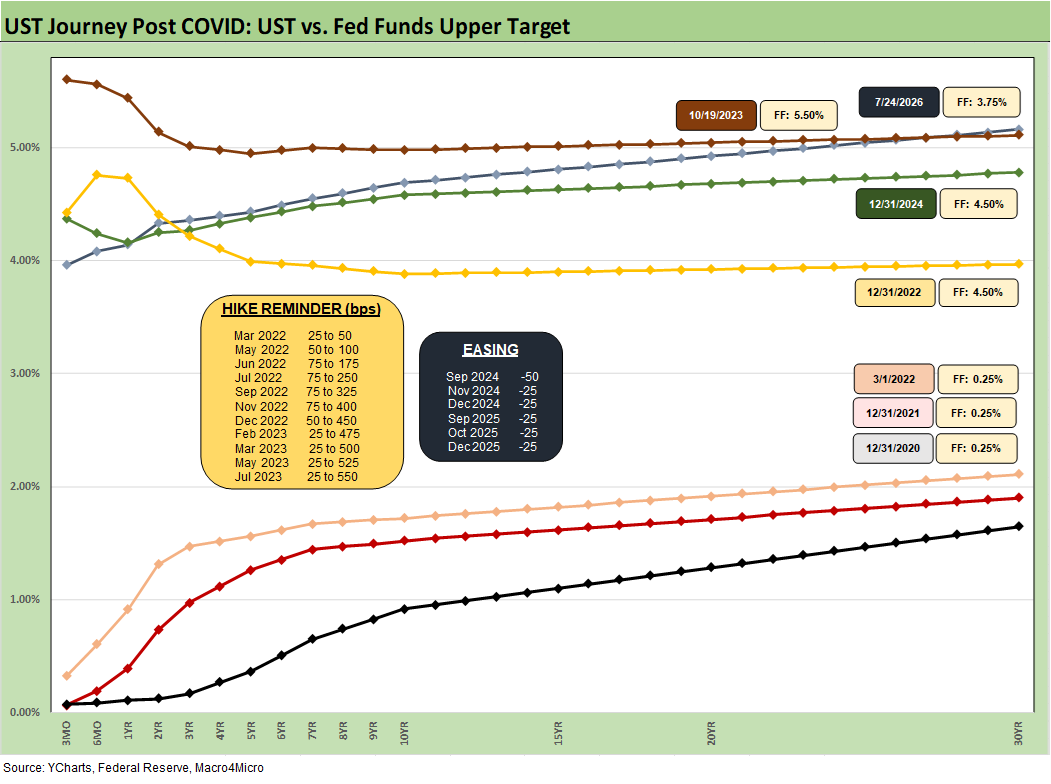
The chart highlights how the UST curve has migrated since COVID to current times across some hiking, easing and now possibly back to hiking. The latest UST yield curve numbers are very close to the Oct 2023 peak when the 10Y UST and 30Y mortgages hit cyclical highs. That peak 10Y UST in Oct 2023 just missed 5.0% but hit that level intraday on 10-23-23.
The UST curve currently is higher than in Dec 2024 from 2Y to 30Y with more pronounced steepening out the curve to the 30Y. The short end is lower now than in late 2024 based on the 2025 easing actions. We detail the hikes, easing actions, and dates in the boxes.
Market participants can debate what is driving the curve higher since Dec 2024 (Biden’s last full month) across inflation, tax breaks, tariffs, oil, soaring UST supply vs. global demand, and record interest expense even with more deficits ahead to fund.
The main point is not who wins that inflation debate (nobody has won that since the 1970s, so good luck), but the market votes on how the factors all roll up into market clearing levels. That is not what drives bond and portfolio performance – not politically motivated double talk. As we saw this past week again, the trend has been bad for bonds. The YTD numbers on 4 of the 7 bond ETFs we track show high quality bond ETFs in the red YTD (TLT, LQD, GOVT, AGG). Rising longer rates can also flow into growth stock valuations, hurt mortgages/housing, and impact consumer credit costs at a time of strained affordability and borderline negative real wage growth with declining savings rates.
A very brief summary of the timeline in reverse chronological order:
July 28-29, 2026: We have an FOMC meeting this coming week with FedWatch showing an overwhelming odds bias favoring hikes through the Dec 2026 FOMC meeting. Chaos in the Gulf and the Iran War is not helping.
Dec 2024 to July 2026: Spin the partisan to-and-fro any way you want, but rates are higher now than Dec 2024 beyond 2Y UST. The direction of the 10Y and 30Y is bad news. Depending on Fed action, the lower rates from 3M to 1Y could be narrowed vs. Dec 2024 if the odds-on favorite hikes unfold. Dec 2024’s upper bound was 4.5% vs. the current 3.75%.
3-1-22 to 12-31-22: ZIRP was scrapped in mid-March 2022, and the year was a grim one for risky assets even if the much-expected recession never arrived. Personal Consumption stayed positive in 2022 and unemployment stayed low. PCE growth ramped up in 2024.
12-31-20 to 12-31-21: ZIRP was in place, the vaccine wave was on (thank God RFK Jr. was not in power), consumers were pent up, risky assets were soaring, refinancing and extension of liabilities brought joy in the form of low coupons, housing took off, refinancing of mortgages brought household cash flow benefits, and “perceived” growth stocks soared (Peleton?!). The yield curve steepened as bondholders saw the Fed was late to the inflation party as easy money and supply-demand imbalances took a toll.
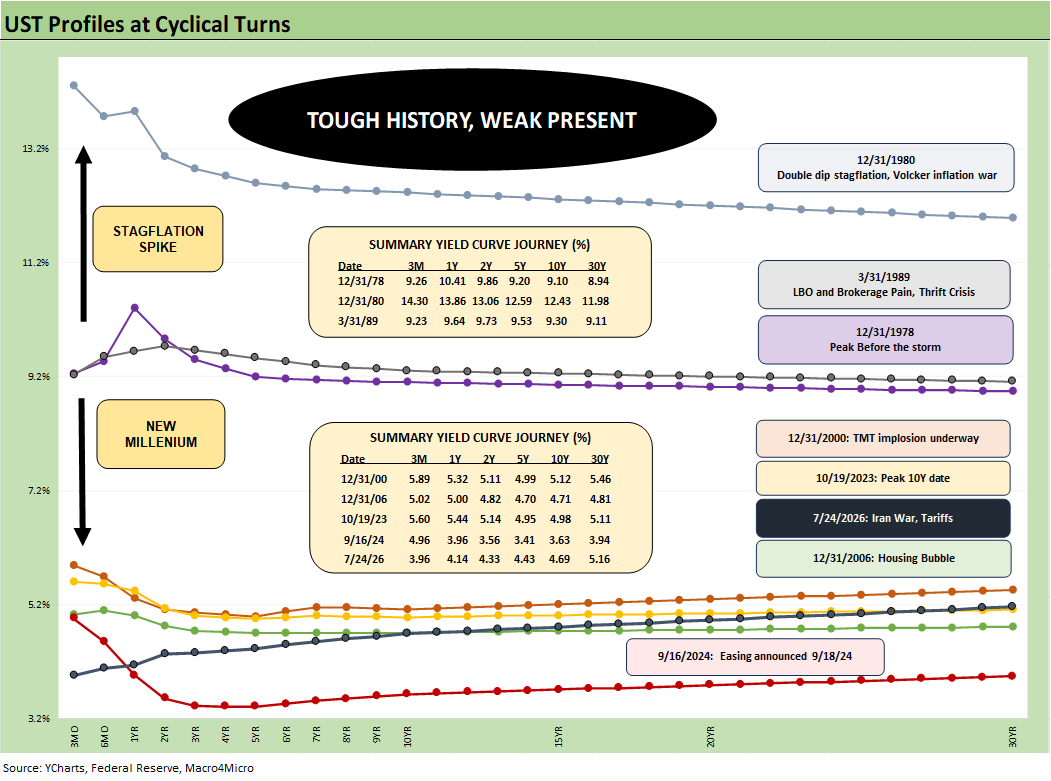
The above chart is another busy one, but it does offer a lot of historical reference points for what UST curves looked like at cyclical peaks or as they approached the doorstep of bad times (in some cases brutal recessionary times). The rule of thumb is that a flat curve later in cycles sets the stage for potential struggles and it is wise to step carefully.
We highlight the 9/16/24 yield curve above that came just before the September easing. Many market watchers had a bullish view on the curve going into 2025, including the long end. That certainly did not play out as we have covered in earlier commentaries. As we moved into 2025 and 2026, we saw rates move higher along with the steepening. It is safe to say that the market will be highly sensitive to tightening moves and raising the front end.
Of course, when worries really pick up we can see a UST curve flattening start to invert as more portfolios buy UST, reduce risk, and get more defensive. Watching for signs of fundamental weakness becomes very important. The good news is that the US economy is so large and diverse and services oriented that it takes waves of problems to drive macro contraction risk.
These periods in the chart cover a lot of cyclical timelines that saw structural changes, regulatory evolution (banks vs. brokers, etc.), periodic bouts of asset excess, diverse credit cycles (including reckless underwriting), and a slew of sector themes (commercial real estate, autos, banks, TMT, RMBS, structured credit, etc.) from Carter to Trump. We look at a range of them in yield curve context in the links below.
The action in the chart starts in the late 1970s, cuts across the double-dip stagflation bout of 1980-1982 and then into the Reagan bull markets. The wide array of mishaps from 1989 to 1992 (hung bridge loans, Drexel collapse, commercial real estate excess, bank turmoil, etc.) moved into the Clinton boom years and then eventually into a tech bubble.
Then came new millennium adventures when derivative counterparty risk and structured credit took bank/broker interconnectedness and leveraged risks and systemic threats to new heights. The bank system crisis is a long story that the typical coconut in Congress has a few party line talking points to use (“Wall Street greed” or “Let the markets work, no bailouts” or “Wall Street vs. Main Street,” etc.). There is always a lot more to the stories and events of the time.
The following links cover the background of a range of UST curve shifts and some of the historical UST slope shapeshifting from Volcker to Greenspan and the later parade of Fed Chairs.
The Fed gets so much coverage it is hard to escape, but knowing what came before can help sort out some of the revisionist “modifications” of history.
Greenspan’s Last Hurrah: His Wild Finish Before the Crisis 10-30-22
Wild Transition Year: The Chaos of 2007 11-01-22
Bear Flattener: Today vs. 1994 and Aftermath 10-18-22
UST Moves: The 1990-1991 Risk Factor Pig Pile 10-24-23
UST Moves: 1988-1989 Credit Cycle Swoon 10-20-23
Greenspan’s First Cyclical Ride: 1987-1992 10-24-22
UST Slope Update: Some New Inversion Highs 12-8-22
UST Curves: Slope Matters 10-25-22
Yield Curve Lookbacks: UST Shifts at Cyclical Turns 10-16-23
Fed Funds, CPI, and the Stairway to Where? 10-20-22
UST Moves 1978-1982: The Inflation and Stagflation Years 10-18-23