
The FOMC Dance: Will Warsh and Trump Find a Rhythm?
The FOMC meeting and output rattled the UST curve and roiled equities.


Who leads?
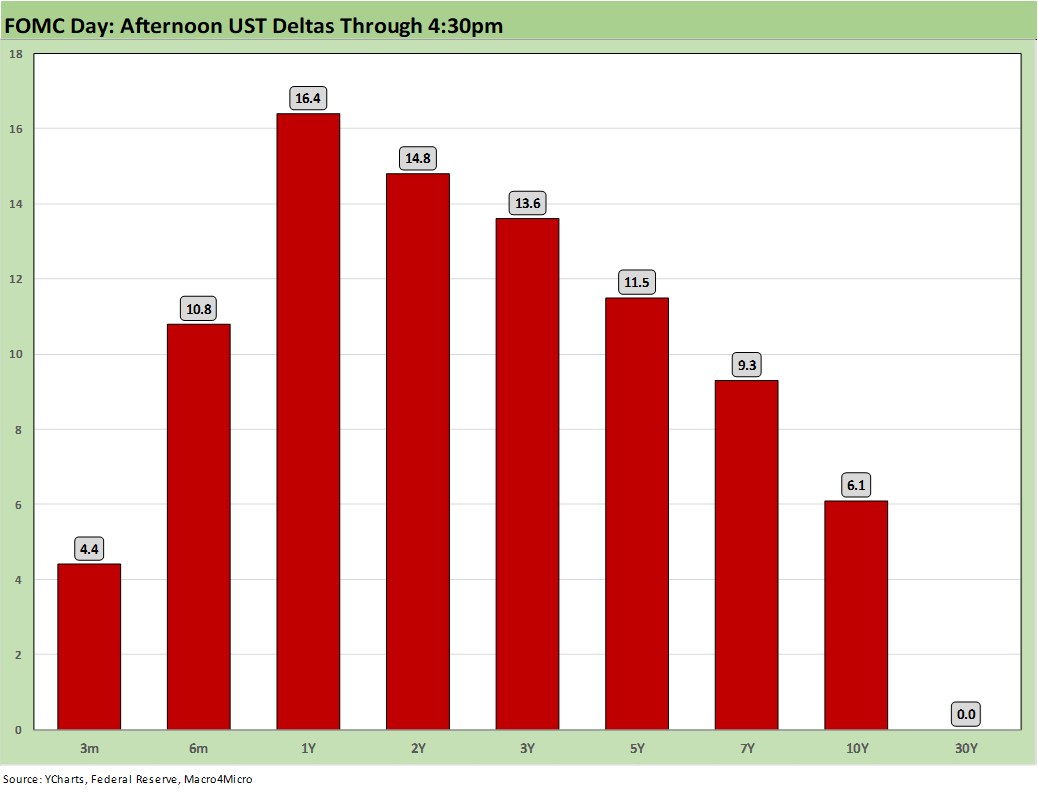
The hawkish FOMC meeting, SEP report, and Q&A color sent the markets into a mini frenzy with a rapid bear flattener generating a move by late afternoon on the 2Y UST of +14.8 bps, 10Y at +6.1 bps and the 30Y essentially flat (note: those were the deltas by 4:30 pm). The market reaction was immediate with selloffs in equities and bonds. The main event remains the follow-through on the Iran deal now that it is signed and getting to the other side of the misinformation and spin as more details dribble out.
The FOMC statement took a big dose of GLP-1 on the new Warsh diet (FOMC statement microdosing), but there was no hiding from the hawkish bias toward more hikes by year end. Warsh sat out the dot plot leaving only 18, but the fed funds targets were clear enough. We saw 9 of 18 calling for hikes by year end with 3 seeing 1 hike, 5 seeing 2 hikes, and 1 seeing 3 hikes). That is a bearish set of votes – and that is the group Warsh needs to move (not Trump).
As we go to print, the “Vegas line” (CME FedWatch) is posting the probability of 1 cut by the Dec 2026 FOMC meeting at 1.4% while the odds of unchanged has declined sharply to only 15.5%. We now see 1 hike odds at 43.1%, 2 hikes at 32.7%, and 3 hikes at 7.3%. The odds of 2 hikes has tripled in a single month. May CPI and PPI did not help the mood (see CPI May 2026: The 4% Rubicon 6-10-26, Producer Price Index May 2026: Too Many “Since 2022” References 6-11-26).
The market saw solid retail sales today with next week bringing a raft of data points including PCE inflation (Income and Outlays) and the final 1Q26 GDP after a weak 1.6% second estimate with 1.4% PCE growth (see GDP 1Q26 Second Estimate: Shrunk in the Dryer 5-28-26). The consumer sector appears to be firming on consumption in 2Q26, but savings rates are materially lower and credit card debt is rattling some asset quality nerves (see PCE Inflation: Income and Outlays April 2026 5-28-26).
The bear flattener pattern as highlighted in the chart will weigh more heavily on retail financing costs (e.g. autos and ABS) and could start to pressure net interest margins if some of the target fed funds rates play out as 9 of the 18 FOMC voters expect. Rising short rates are also a threat to leveraged private credit borrowers.
UST delta reactions to FOMC…
The chart below breaks out the UST delta reaction on the day from the release and press conference through 4:30 pm:
A lot of discussion on the financial cable channels in the aftermath speculated on how the long end could react to the potential actions ahead. One theme was that Warsh had cited mortgage rates, but the threat of a bear steepener from premature dovish actions would have the opposite effect and send the 10Y higher and mortgage rates along with it.
Another theory is that Warsh is buying time until the follow-through on Iran can give him some room to maneuver. He did not want to shoot his credibility in the foot so early sounding too dovish. He can get more input back from his working groups to review the range of topics in the fall. Who will be on those committees and what disclosure they will provide is unclear (on a not too serious note, maybe they can put Bill Pulte in there since he is a “mortgage expert” and he will do less harm when Warsh ignores him).
The summary of economic projections…
Below we summarize some of the color from the various projections as the committee handicapped key economic metrics. We summarize the SEP details across the fed funds target range, PCE inflation (headline and core), GDP growth, and unemployment rates.
GDP growth: the median for 2026 was notched down to 2.2% from the 2.4% in March. The capex boom has been running high alongside weak PCE growth (1.4% in 1Q26) (see GDP 1Q26 Second Estimate: Shrunk in the Dryer 5-28-26). The forecasts show low 2% range in 2027 and 2028. Those are not “golden age” numbers.
Unemployment rate: the median forecast was 4.3%, down from 4.4% in the March forecast. While Warsh reiterated with forceful emphasis that price stability was the overriding focus in the dual mandate, that is easier when the jobs numbers signal what would be full employment across most cycles – even if that comes with some “quality of mix” asterisks (see Employment May 2026: Big Rebound, Low Multiplier Bias 6-5-26).
Headline PCE inflation: The 2026 headline PCE inflation expectation is for 3.6% vs. 2.7% in the March forecast. The Iran fallout has really rattled the inflation meter with the downstream effects and real wage pressures raising numerous, obvious issues. If Warsh used the word “tariff” in his press conference, I did not hear it. He is working on his dance steps with Trump.
Core PCE inflation: The median of 3.3% is up from 2.7% in March. The tricky item in an oil spike backdrop is that the classic definition of “inflation” by economists (i.e. recurring price increases) departs from the consumer worries around immediate “affordability” now and the purchasing power erosion for any given household basket. The convenient escape hatch of “one time” increases (e.g. tariffs) does not change the fact that the consumer is underwater and needs to adjust their “basket” or simply cannot afford it. Those are moments that affect behavior as they need to adjust habits or demand a raise (or leave a job for a raise that can in turn set off wage multiplier effects). When household cash flow is hit at the gas pump, in the power/electricity bill, or in the aisles as higher freight charges also run into food/beverage prices, “core” is not the main event for them. It is purchasing power and the need to start drawing on credit cards.
Fed funds target: The median was 3.8% vs. 3.4% in March. That implies a single hike. That is where the highest odds are now in FedWatch, but the 2 hike odds are not far behind. The 2027 and 2028 medians of 3.1% will require those 2% handle PCE inflation estimates in 2027-2028 or there is a risk of near zero or negative real fed funds.
See also:
Housing Starts May 2026: Weaker for both Single Family and Multifamily 6-16-26
Industrial Production May 2026: Steady, Balanced Utilization Levels 6-15-26
Market Commentary: Asset Returns 6-14-26
Geopolitical risk: Trump’s Nuclear Saber Rattling? 6-14-26
Producer Price Index May 2026: Too Many “Since 2022” References 6-11-26
CPI May 2026: The 4% Rubicon 6-10-26
Remembering D-Day: June 6, 1944
Employment May 2026: Big Rebound, Low Multiplier Bias 6-5-26
The Fall of CBS 6-3-26
JOLTS April 2026: A Modestly Positive Turn 6-2-26
Retail Signal Read Part Deux 6-1-26
New Home Sales April 2026: Slow Start to Spring 5-28-26
PCE Inflation: Income and Outlays April 2026 5-28-26
GDP 1Q26 Second Estimate: Shrunk in the Dryer 5-28-26
Retail Equity Comps: Looking for Signals 5-26-26
D.R. Horton: Financial Powerhouse Despite Cyclical Softening 5-20-26