
GDP 1Q26 Final: PCE Growth Plunge
The downward revision of imports boosts headline GDP to +2.1% from +1.6% but the PCE growth was revised to +0.5% from +1.4%.


Starting to wring out the consumer?
Despite the upward revision of headline GDP related to imports, the main story line is still concentrated in the consumer sector (PCE) and corporate capex (fixed investment) with capex winning and households losing.
The decline in the critical personal consumer expenditure (PCE) line (68% of GDP) reflects a mediocre economic backdrop, worries around inflation and job security, and the household cash flow pressure tied to energy costs, higher health care premiums (and costs for those who can no longer afford the premiums), and higher rates on increased household borrowing.
The low savings rates, higher household debt, and developing signs of consumer credit quality erosion remain on the front burner for economic growth uncertainty. The 6.5% mortgage rates don’t help. Neither does negative real wage growth.
The usual “distortion lines” (notably net exports, see 3Q25 GDP: Morning After Variables to Ponder 12-27-25) were at work again in the final revision as lower imports boosted headline GDP from the “net exports of goods and services” line.
Fixed investment remained extremely strong in the final 1Q26 numbers, but Residential investment was revised even lower to -7.8%. Gross private domestic investment of +7.9% reflects the capex boom in tech more than the hope for a reshoring wave in manufacturing.
On a somber note for inflation, the PCE price index for the quarter ticked slightly higher to +4.6% with the Core PCE price index for the quarter at +4.4%.
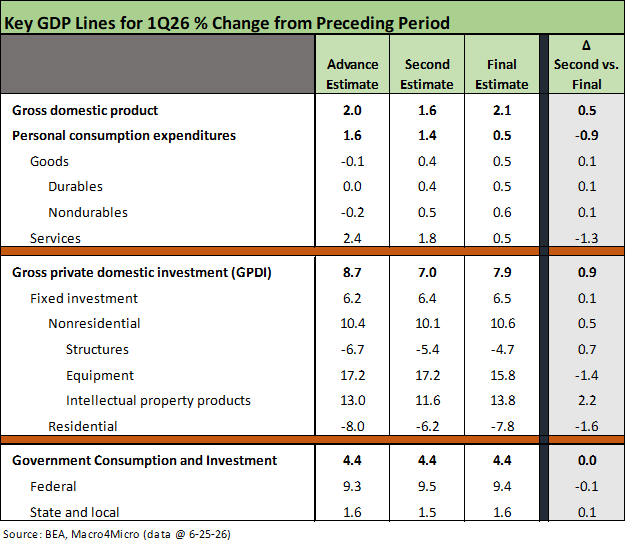
The above table updates the most important GDP line items for the final 1Q26 growth numbers. The most notable adverse variances are along the PCE lines with PCE sliding from +1.4% to only +0.5%. That was a downward revision of -0.9% from the second estimate. You can track that history in the second chart below.
The +0.5% growth rate for PCE in 1Q26 is the worst since 1Q22 at +0.4%. The total contribution to GDP from the PCE line in 1Q26 was only 0.37% (vs. 1.30% in 4Q25). The +0.5 growth in PCE was only slightly worse than the weak 1Q25 in Trump’s first quarter of his second term at +0.6%. We tend not to hear much from Bessent or Hassett on the GDP growth numbers cited in Trump’s recurring praise of the “hottest country” in the world (After all, why use objective numbers when adjectives are available?).
That +0.5% in 1Q26 can be framed against 2024 with +3.9% PCE in 4Q24, 4.0% in 3Q24, and 3.9% in 2Q24 (back when Trump claims the US was “dead” before the current “Golden Age”). Services growth in the final 1Q26 PCE saw a material negative revision of -1.3% to +0.5% for 1Q26 in Services. As noted in the chart, the period from 1Q22 through 1Q26 shows the two worst growth quarters for Services were 1Q26 at +0.5% and 1Q25 at +0.8%.
What has been impressive in the GDP accounts is the extraordinary growth in fixed investment numbers with even more upward revisions in the nonresidential lines in the final numbers. Equipment and Intellectual Property Products are soaring. Residential is obviously a very different story with the numbers getting even worse.
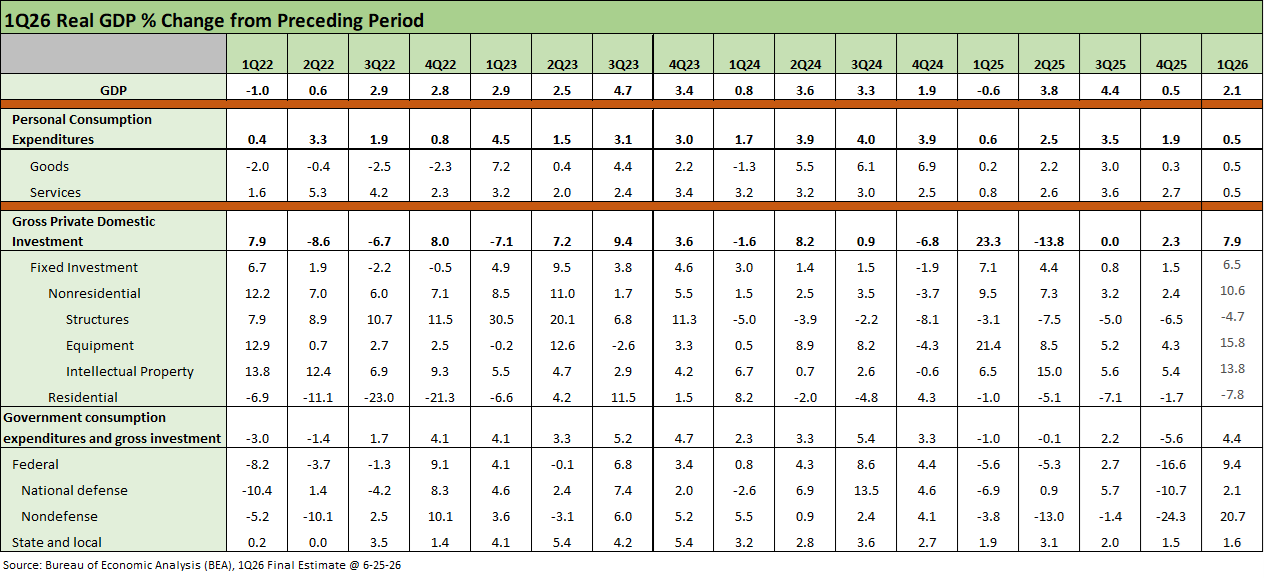
The above table offers a timeline that can be used to objectively frame how the GDP lines have performed across the periods from the end of ZIRP in 1Q22 across the inflation spike, into the tightening cycle, into the tech boom, across a backdrop of broad tariff policies, and then an oil spike related to the Iran War.
See also:
Trade Deficits: The Moving Parts and Macro Goals Matter Most 6-24-26
Market Commentary: Asset Returns 6-21-26
The FOMC Dance: Will Warsh and Trump Find a Rhythm? 6-17-26
Housing Starts May 2026: Weaker for both Single Family and Multifamily 6-16-26
Industrial Production May 2026: Steady, Balanced Utilization Levels 6-15-26
Geopolitical risk: Trump’s Nuclear Saber Rattling? 6-14-26
Producer Price Index May 2026: Too Many “Since 2022” References 6-11-26
CPI May 2026: The 4% Rubicon 6-10-26
Remembering D-Day: June 6, 1944
Employment May 2026: Big Rebound, Low Multiplier Bias 6-5-26
The Fall of CBS 6-3-26
JOLTS April 2026: A Modestly Positive Turn 6-2-26
Retail Signal Read Part Deux 6-1-26
New Home Sales April 2026: Slow Start to Spring 5-28-26
PCE Inflation: Income and Outlays April 2026 5-28-26
GDP 1Q26 Second Estimate: Shrunk in the Dryer 5-28-26
Retail Equity Comps: Looking for Signals 5-26-26
D.R. Horton: Financial Powerhouse Despite Cyclical Softening 5-20-26