GDP 2Q23: The Magic 2% Handle
We look at a 2Q23 GDP number that posts broadly positive numbers across PCE and Fixed Asset Investment categories.
The number 2% is a common refrain since Obama and Trump were not able to print an annual growth rate (vs. quarterly) above that number as a “handle.”
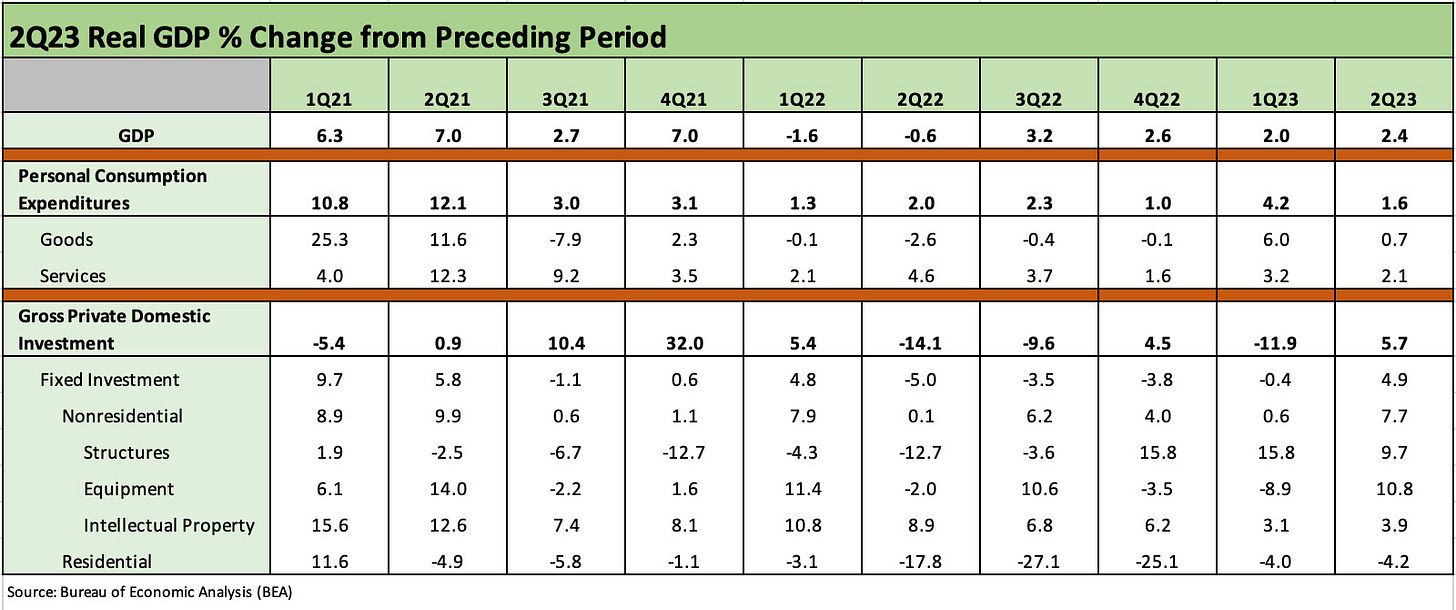
The recent quarter was very positive even if just on the breadth of positive line items in Personal Consumption Expenditures and domestic investment.
The critical PCE line was down sequentially but beat expectations while the Fixed Asset line was very solid and positive for all lines except Residential, which was a mild -4% handle for the second straight quarter in stark contrast to the sustained double-digit declines of some past periods of housing sector weakness.
PCE is always “priority one” for waving recession flags, but the healthy positive lines in Nonresidential Fixed Investment across Structures, Equipment, and Intellectual Property Products tell a very good story (even if backward looking).
The above chart breaks out our main event line items. We take these numbers from Table 1 of the GDP release and include the quarters from 1Q21 for a time series. The PCE line is always the biggest factor at over 68% of nominal GDP with Fixed Investment over 17%, Government Consumption over 17% and the usual trade deficit line bringing a negative 3% area weighting to the current dollar GDP number. The fact that PCE is positive and Fixed Investment lines are positive in all buckets except Residential is a strong statement on where the economy is now in terms of spending.
We are not big on “Bidenomics commercials” (what they failed to pass looked like a disaster waiting to happen), but those of us that grew up in the Great Society programs after the Eisenhower Highway Act programs (before I could read in the late “Ike years”) are not of the view that big government spending or incentive programs for the private sector spend are all that new in concept (the 1960s names were far cooler than the new millennium names). Cities were rebuilt. Schools were built. Infrastructure spending hit all regions and all aspects of life. The term “urban renewal” was a common phrase. This stuff ain’t new.
Construction spending, mega-projects, energy and propulsion transitions, the rise of smart warehouses and new freight and logistics spending, etc. all flow into Structures and Equipment spending. Intellectual Property spending walks hand-in-hand with tech investments and that line has been able to push through all other economic headwinds no matter how bad the cyclical downturns.
The one negative on the list is in Residential investment on lower build rates as mortgage rates soared. Compared to past housing cycles, this is an extremely muted contraction in 2023 after the initial pounding in 2022. Residential construction saw over 3 years of consecutive double digit quarterly contraction from 2006 to 2009. That was other worldly. This is mild.
A lookback at prior cyclical stewards…
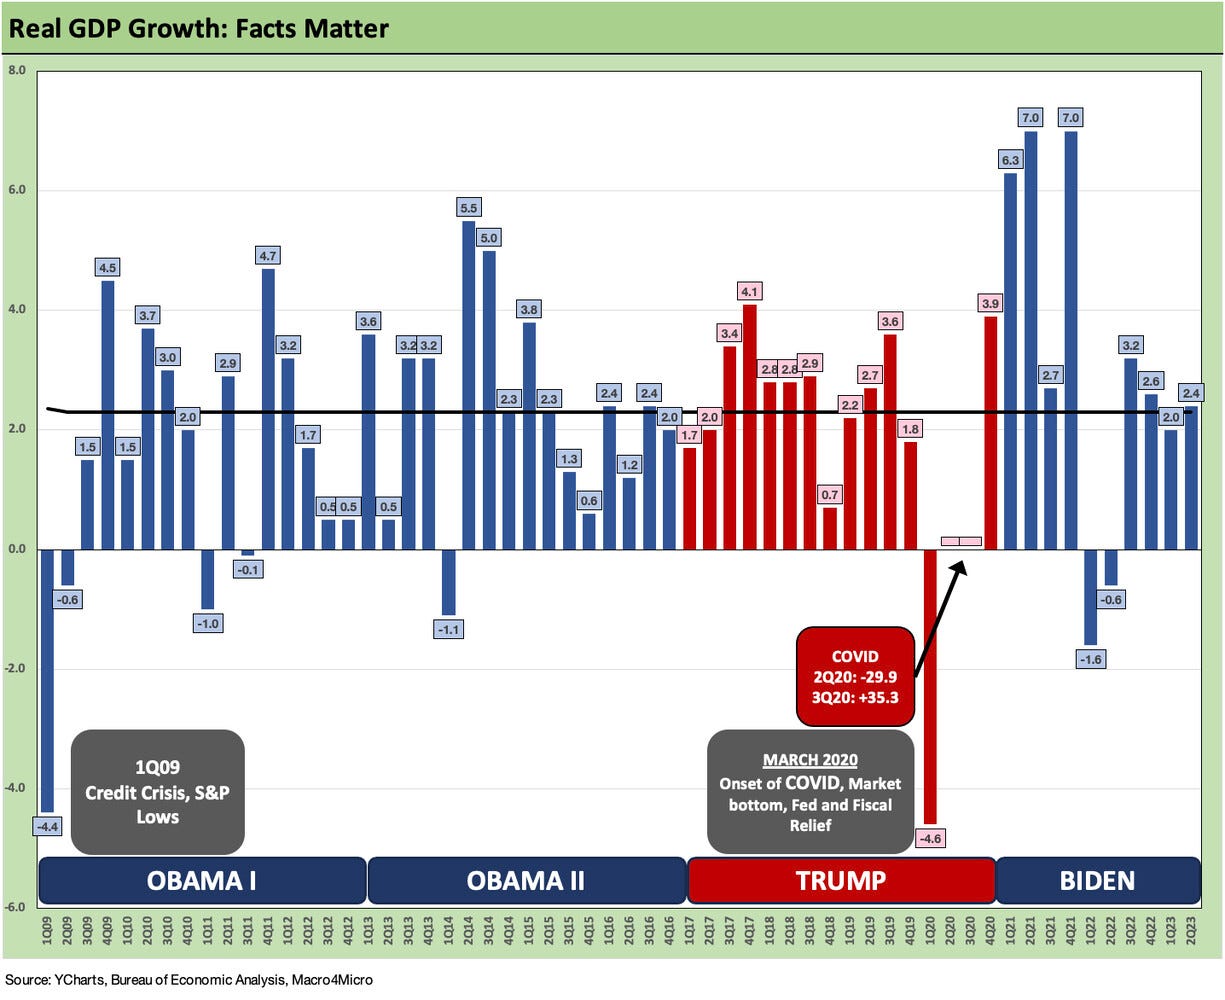
We like to highlight the “2%” growth number as a focal point since 2% handle GDP was a rare bipartisan moment of convergence of slow economic growth for multiple administrations. Reality is in the numbers (see 1Q23 GDP: Facts Matter 6-29-23), and we produce the GDP history below. Even if some of the prior Presidents preach a subjective view of their performance (“Best economy ever. Ever. Maybe in the history of the world ever. EVER…”), the reality is the US has been posting weak growth on average since the credit crisis.
We used red and blue bars in the chart above to keep in the spirit of the times (divided). The fact is the numbers are more purple than red or blue given the Congressional party mix variances over the decades, and a lot more goes into the cycles and economic performance than the guy giving the State of the Union Address. Arguably Obama had control of the political lineup for 2 years out of 8 (health care reform for most of his 8 years with that sectors massive GDP influence) and Trump for 2 years out of 4 (arguably he had control of trade policy for all 4 years with its adverse impact on corporate sector planning).
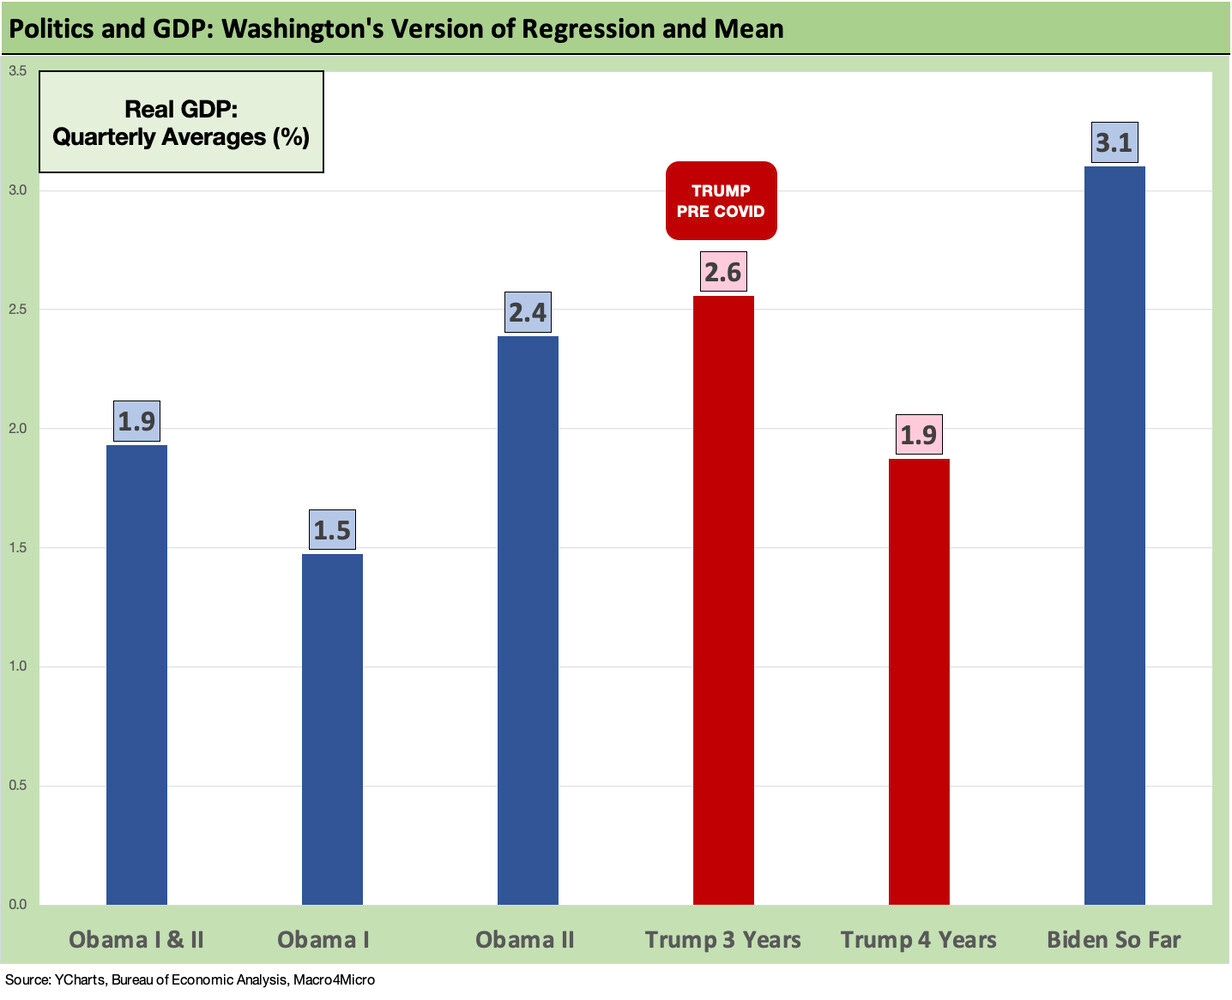
Some prior administrations have posted volatile swings across quarters (Obama first term coming out of the credit crisis) and some printed weak numbers in a narrow range (the first 3 years of Trump). The above chart just posted a simple average of the quarters. Coming off the disastrous year of 2020 and COVID, the market was almost assured a high annual growth rate in 2021. A great quarter can come after a very bad quarter, so we prefer to use the annual numbers from the BEA as a guide on how the timelines look for growth as pundits score policy outcome. GDP growth is one of various areas to score (employment next in line).
When the smoke clears on 4Q23, we would expect Biden’s tally for the annual GDP number to be a 2% handle and his running quarterly average to be at 2% average as well even if likely to be the high average of the list. The economy has been strong, inflation has been declining sharply, and CPI ex-shelter is already quite low at under 1% (see June CPI: Big 5 and Add-Ons…A Big Win 7-12-23).
Services inflation is the last holdout at this point, and services consumption on the PCE line was +2.1%, which was tied for second lowest since 1Q21 and the 10 quarters booked under Biden thus far. 4Q22 was lower at 1.6% after a few quarters of inflation and Fed tightening. We will get more inflation metrics and PCE price index data at the end of this week.
If Biden ends the full year at a 2% annual GDP number following a 2% annual 2022 number, we don’t expect Trump and Biden to run on the platform of “We ran economies just like the other guy with low growth and a lot of policy acrimony.” It just doesn’t lend itself to a good commercial. Biden has had to experience exogenous shocks (the COVID adjustment period) just as Trump did. Obama inherited a credit crisis that was less fatal to humanity but far more damaging economically with protracted credit contraction and high unemployment.
At the very least, such GDP statistics offer facts (a much maligned and poisoned food group in Washington). Partisans can spin the numbers but whether it be the Obama years on taxes or Trump on trade (and a failure to execute on an infrastructure bill when he had control of Congress), there is usually an invective-free explanation for low growth.
Broader shocks such as pandemics, systemic bank crises, asset and market bubbles, OPEC oil price wars, etc., must be part of the analysis. The macro events often don’t lend themselves to headline soundbites but usually end up as concept-free and fact-lite talking points anyway.
See also:
Consumer Debt in Systemic Context 7-13-23
1Q23 GDP: Facts Matter 6-29-23
GDP 1Q23: Devils and Details 4-27-23
GDP 4Q22: Thin Sliced 1-26-23


