
GDP 3Q23: Old News or Reset?
We look at 3Q23 GDP with the consumer jumping in with both feet and more bags.


The expectations for 3Q23 GDP numbers had set the bar at over 4% in many forecasts, so the 4.9% did not disappoint the optimists even if some were calling for a 5% handle.
The numbers were dominated by +4.0% growth in PCE for the highest since 4Q21 with other highlights including Durable Goods at a very strong +7.6% and Residential weighing in at +3.9% in a market with painfully high mortgage rates.
The big drivers of sentiment are tied to Personal Consumption Expenditures and the mix of line items in Gross Private Domestic Investment while changes in inventory is important as a distorting secondary factor.
The takeaway from the quarter is that the 3Q23 numbers continue a better year in 2023 than 2022 even as inflation has been at least checked and employment remains strong.
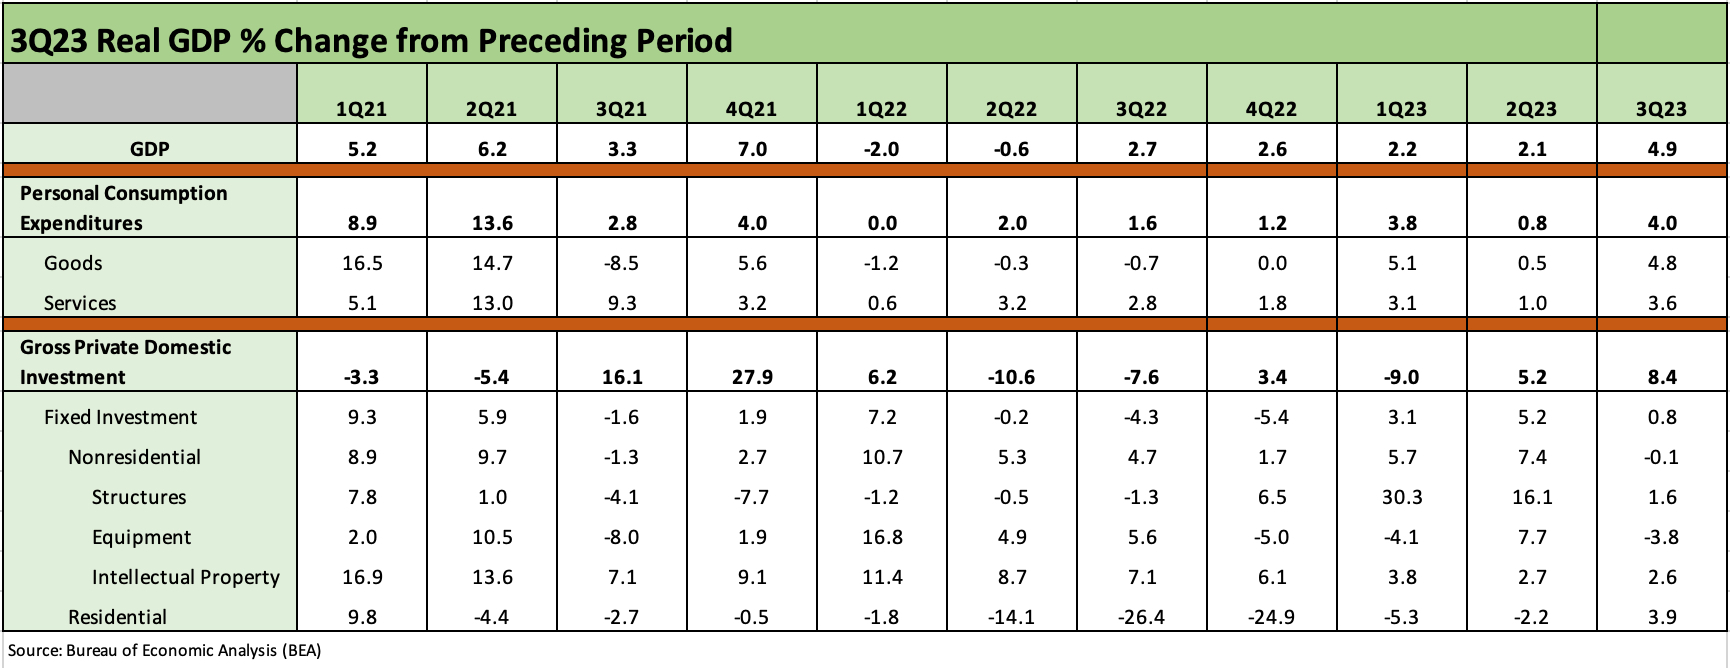
The chart above updates the recent GDP numbers by critical line item (corresponds to Table 1 in the GDP release). We went back and dropped in all the revisions and subsequent updates across time, but the 2021 numbers seem like ancient history at this point as the post-COVID rebound put up stellar numbers but also brought the inflationary effects of the supply-demand imbalances with it.
We usually run with the immediate first GDP release and don’t revisit the updates unless the #2 and #3 GDP releases say something important. We have noticed over the years that GDP releases pass by very quickly and are forgotten unless you are an economist modeling and forecasting.
The takeaway is strong consumer and steady capex, which is not really new news. The inventory build may signal continued confidence in spending ahead or restocking after muted numbers in 1Q23 and 2Q23. That takes more drill down by industry group.
Below we do a quick breakdown on the key moving parts for this 3Q23 first GDP release:
Personal Consumption Expenditures (PCE): The consumer strength certainly shows up in the numbers across both Goods and Services. We see +4.0% in PCE with Goods at +4.8%, which cuts across +7.6% in Durables and +3.3% in Nondurables (not shown in table). The Services piece was +3.6%. In a related consumer and household line item that falls under domestic investment (not PCE), the move in Residential to +3.9% was another piece of the new home and builder resilience story even at scaled down numbers with higher mortgage rates (see New Home Sales: The Need to Live Somewhere 10-25-23, Housing: Starts, Completions Firm Sequentially, Permits Down 10-18-23). Overall, the PCE line contributed 2.69% to GDP (corresponds with Table 2 of GDP release).
Gross Private Domestic Investment (GPDI). The GPDI line and the fixed asset investment that rolls up under it has been getting a lot of focus from line-item watchers since those GDP accounts tie back into the legislative initiatives and stimulus goals enacted (EVs, Semis, Infrastructure, etc.) that has pumped up nonresidential construction and driven more investment at the industry level (see Construction: Project Economics Drive Nonresidential 10-2-23). These are the lines that are essentially the “capex” part of the equation that are critical determinants of recessions also.
The GPDI line contributed 1.47% to the GDP line (Table 2 of the release) for the highest since 4Q21. The 2021 quarters were wild swings higher off the year of COVID. Fixed investment was relatively tame overall this quarter at +0.8% after a steady series of solid quarters under Nonresidential. The “Change in Private Inventories” part of GPDI was as a major contributor to GDP at +1.32% (See Table 2 of release).
Tale of the Tape: Trump Quarters vs. Biden Quarters
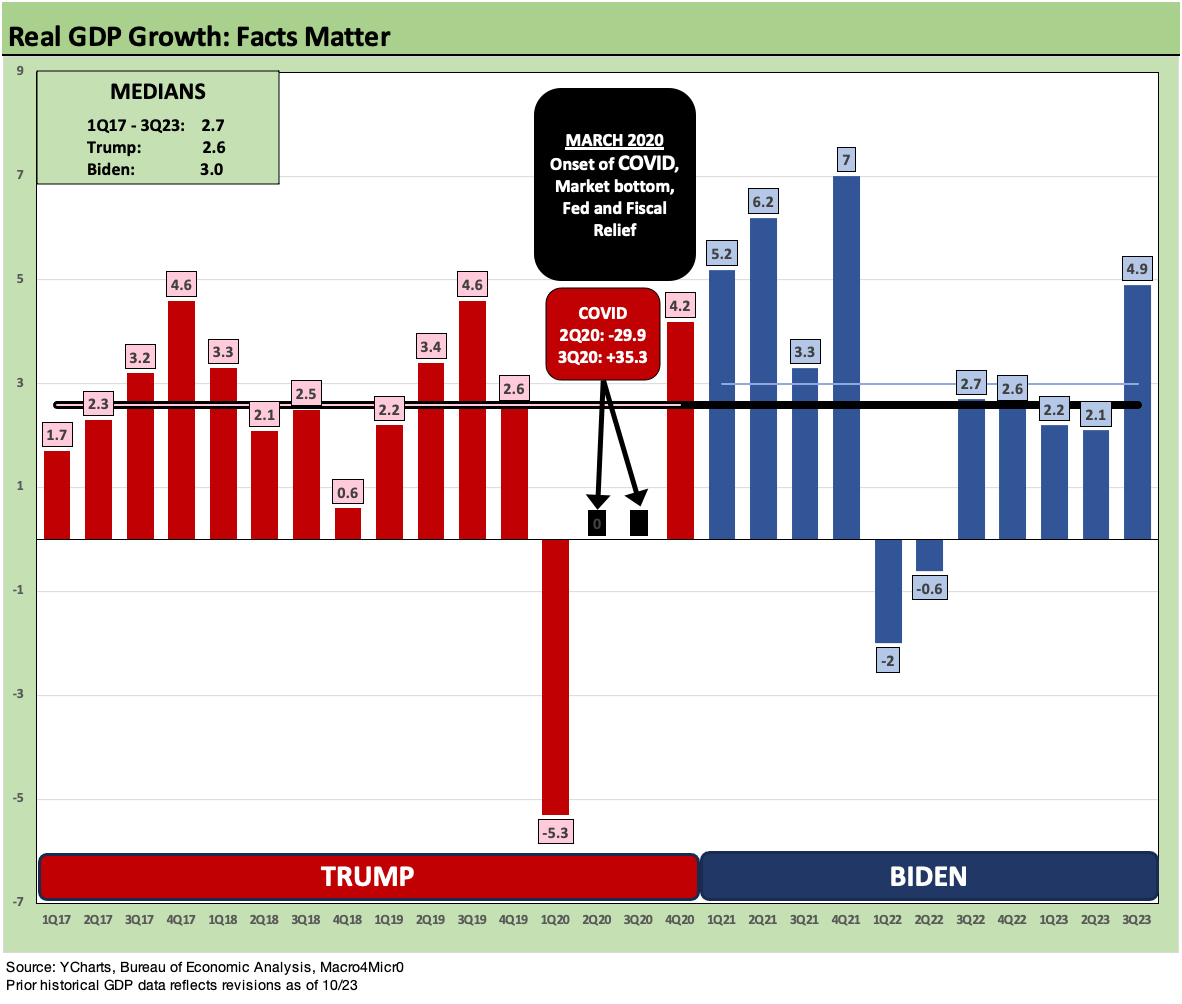
For this update, we just plot the GDP growth by quarters, and the objective eyes can ask which one is higher. The subjective brain can explain the differences away to their preset silo’d view. The median GDP growth across these quarters was 2.7%. We highlight the COVID GDP swings in the box rather than post them in the bar chart and mess up the visuals. This is easier to read across “normal” quarters.
Every now and then it is OK to use some facts in economic debates, and GDP growth is one of them. So are employment trends, inflation, trade flows and government deficits vs. GDP. For those who are in the political economic debate, they can even toss in some concepts. The tendency is not to use concepts in politics. They are almost as bad as facts. After all, they are the friend of reality and truth.
For the purpose of the economic comparisons of Trump vs. Biden, just framing the numbers sometimes works – just maybe not politically. Timing and optics are everything, and Jimmy Carter and George HW Bush are single-term examples. Carter had a better economic performance than George W. Bush, Obama, and Trump, but inflation and structural changes in the economy killed his reelection.
In the longer term contest across the 1980s and 1990s, the economic performance of George W. Bush, Obama, and Trump were decidedly below median in GDP. Biden gets some bragging rights for employment (see Employment Across the Presidents 8-15-23,) and annual GDP levels vs. the post-2000 Presidents, but Reagan and Clinton were big winners (see Political Economy: Topics Where Facts Matter 8-23-23)
When we look back across the cycles, we see the market might show secular trends or event risk that dictates where markets and the economy perform. We had the tech revolution and machines for manpower. We saw the rise of unconventional drilling driving oil and gas production higher (Do we give Obama credit for soaring oil production in his years? No. Nor should we). We see the rise of low-cost global supply chains that kept inflation low (Is that good or bad and who gets the credit or blame?). There have been major financial sector events (TMT bubble, Housing bubble, etc.) There is always geopolitics (read “war”) that can dictate the relative perception and opinions of leaders.
We have looked at some other aspects of relative performance of different administrations in past commentaries such as systemic UST debt (US Debt % GDP: Raiders of the Lost Treasury 5-29-23), but the value of repetition in Washington often beats static facts. The economic reports are either facts or they are deep state conspiracy economic releases. Yes, the world is that strange these days.
The reality is that generally facts do not play much of a role in political discourse on economic performance. Trump just repeats himself over and over with false statements about his economic performance and Biden keeps naming things after himself. It is “shirts and skins” (archaic schoolboy sports metaphor) and root for your team at all times these days. Facts need not apply. The numbers show Biden doing much better than Trump in GDP, and he will likely weigh in with another good annual number in 2023 with 3Q23 on the books.