
3Q23 GDP: Fab Five
Real GDP cracks the 5% line with favorable variances in fixed investment offset in part by declines on the consumer side.


We look at one of those rare crossings of the 5% GDP growth line in the post-2000 era before Biden (unless there was a disastrous period before it).
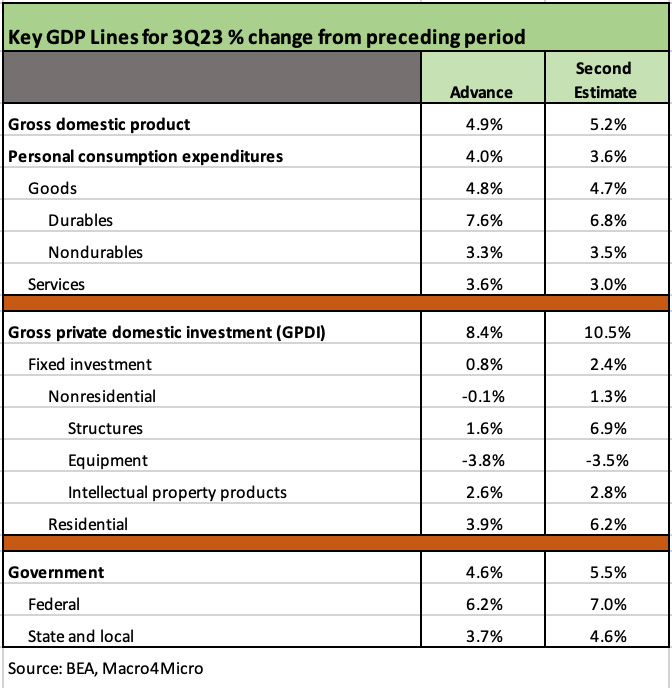
The health of fixed asset investment across both Nonresidential and Residential were the key drivers of the favorable revision along with government spending.
The Personal Consumption Expenditure line was trimmed back from 4.0% to 3.6% on lower Goods and Services estimates.
The desire to run down the economic performance of the current administration will remain high ahead of an election year, but a 5% handle GDP is backed up by some critical line items in Gross Private Domestic Investment (GPDI). The range of upward revisions is just one more solid data point to absorb on fundamental trends.
Government spending at both the Federal and State and Local level also picked up. We did not see any notable distortion in the GDP lines such as inventories or export/import deltas that can occasionally tweak the numbers after the advance release.
The GDP growth can easily be tied into corporate sector confidence in capex spending in the rearview mirror and in guidance during the 3Q23 reporting season. The capex is tied to such areas as nonresidential construction and shows up primarily in fixed investment as part of the structures line (see Construction: Project Economics Drive Nonresidential 10-2-23).
The 4Q23 reporting season is not that far away, and conference season for some industries will roll on into the new year. In other words, the fresh color on private sector spending will keep rolling in. We also see sustained strength on the Residential line coming out of a tough stretch in 2022 with the tightening cycle and mortgage rates remaining a headwind that builders have been successful in countering with incentives strategies.
The earlier 3Q23 advance estimate was clear enough in framing a good quarter already (see GDP 3Q23: Old News or Reset? 10-26-23), and the favorable revisions were supported by some key lines in the investment section as we detail in the chart above.
The overall GDP quarterly numbers since 2000 have usually rolled up into slow growth years and low annual GDP rates in the age of wars, deficits, and systemically excessive UST growth (see 1Q23 GDP: Facts Matter 6-29-23, US Debt % GDP: Raiders of the Lost Treasury 5-31-23). That said, Biden has printed more than a few outsized quarters that we don’t need to revisit here. They just happen to be notably higher on average than those posted by Bush, Obama, and Trump.
The fears around inflation have some items to grasp onto for some mitigating twists in the release. We tend to focus more on spending, but the Gross Domestic Income lines came in at an unimpressive +1.5%. PCE inflation metrics were also modest in the 2% handle range.